Authored by Daniel Fernández Méndez via UFM Market Trends,
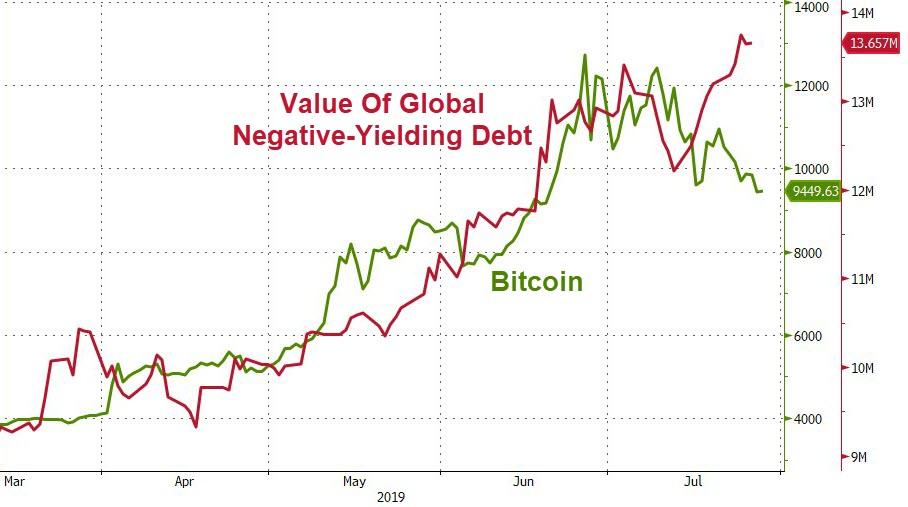
Capital markets exhibit some nervousness about the growing possibility of an economic crisis brewing that will ultimately affect the global economy. Recent increases in the prices of gold (+11.7 percent in May and June) and Bitcoin (+93.3 percent in May and June) are a sign of that nervousness. The Federal Open Market Committee’s most recent decisions and its members’ statements forecast cuts in the Fed’s benchmark rate despite the fact that unemployment in the US is at its lowest since 1969 and inflation is below the 2 percent target.
We attempt to identify here at what point in the economic cycle we find ourselves and whether the fears of a crisis and a recession are justified. To this end, we analyze several leading economic indicators that may be giving us some clues about the future of world growth.
The Bleakest Indicator: The Yield Curve
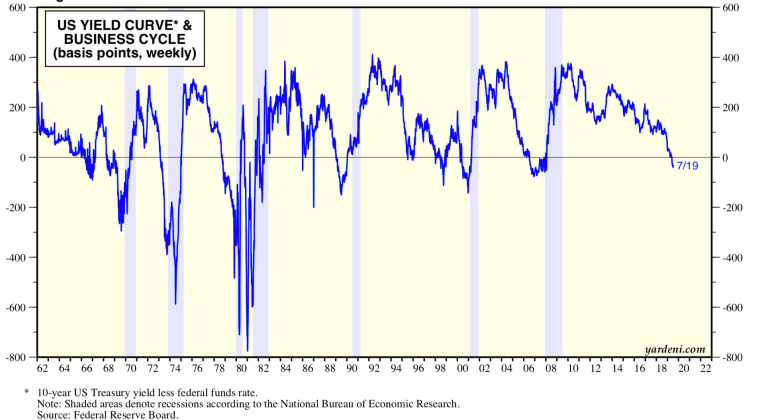
The yield curve spread is one of the most reliable leading indicators. One of the researchers who has written the most about the predictive power of the yield curve, Estrella (1998), suggests that the most reliable spreads is the yield of the ten-year sovereign bond (capital-market title) minus the yield on the three-month bond (money market title).
In the US, every time the spread has been close to zero or negative, a crisis has come within the next twenty-four months. In the following figure we can see the current spread along with those in the last two crises.
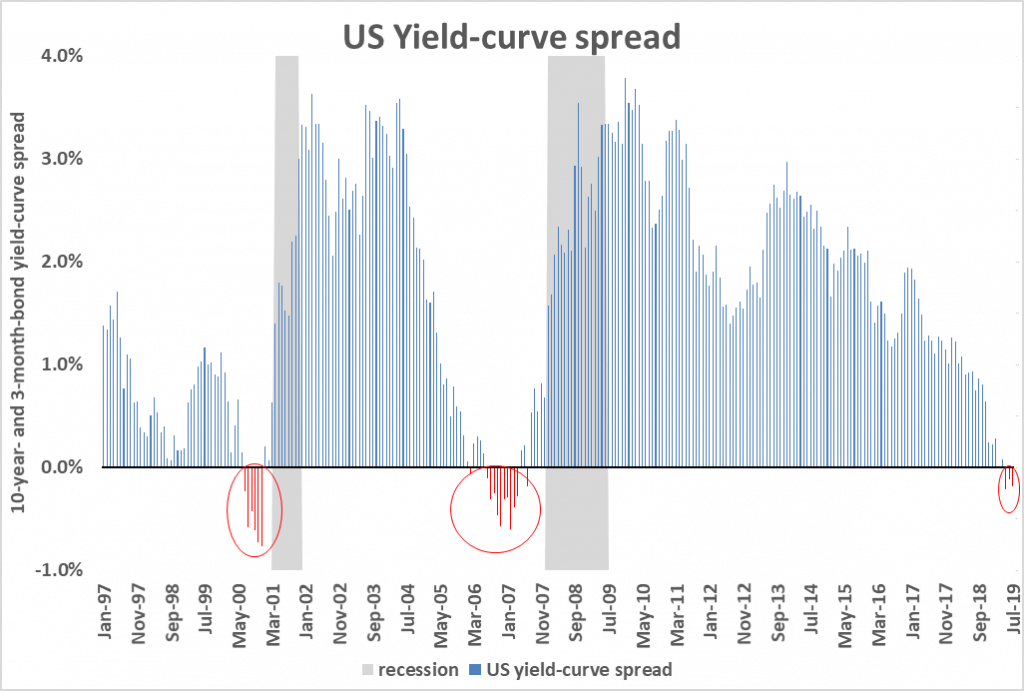
Source: Treasury.gov; NBER
The US yield-curve spread became negative in March and has remained negative for more than three months.
The 2001 recession caused by the dot-com crash appeared only nine months after the yield curve inverted and only four months after the spread moved back into positive territory.
For its part, the Great Recession of 2008–9 took place twenty-three months after the yield curve inverted and six months after the spread had returned to positive territory.
The following graph compares the path of the yield curve in the two previous crises with that today.

Source: Treasury.gov; NBER
If the data from the most recent recessions are extrapolated using this indicator alone, we can anticipate that the next crisis in the US will occur in no less than six months and no more than twenty. That is to say, a crisis will take place sometime between January 2020 and March 2021.
However, just as important as when the yield curve inverts is when it becomes positive again. The fact that a yield curve once again has a positive slope indicates that the pressures that kept the short-term rate high have relaxed because of bankruptcies and the disappearance of companies that urgently needed short-term funds. We could argue, again based on data from the last two crises, that once the yield curve recovers its positive slope, the crisis will appear within four to six months. The crisis does not seem imminent.
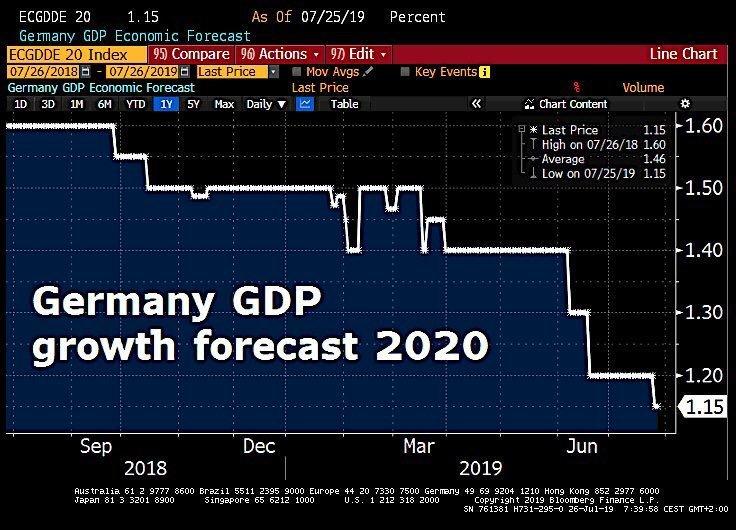
The outlook is not much better in other places. The yield curve in the Eurozone still has a positive slope, but the slope is falling rapidly. It is currently at its lowest level since the 2008–9 crisis.
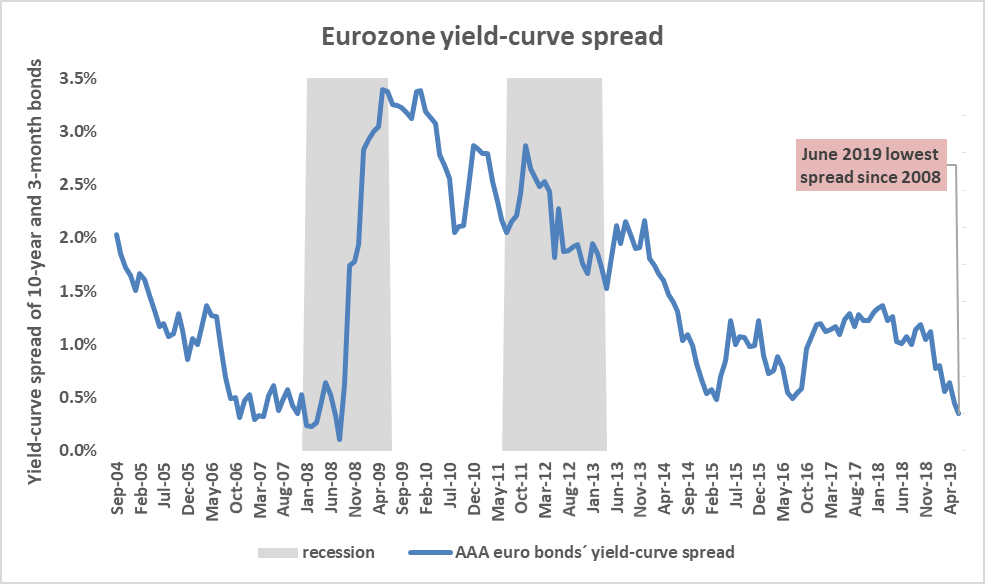
Source: Central European Bank
However, despite how well this indicator has predicted crises in the US, it is far from perfect and cannot be used in all cases. For example, it did not predict the recession and sovereign-debt crisis suffered by the Eurozone between 2011 and 2013. To be sure, that episode can be seen as a secondary recession following the 2008–9 recession. Nonetheless, the yield curve was a poor indicator.
Purchasing Managers’ Indexes: A Deteriorating Indicator
The Purchasing Managers’ Index, or PMI, has become one of the indicators markets watch most closely because of its incredibly high correlation with economic growth and because of its simplicity and speed of publication.
The indicator is created using a survey in which purchasing managers are asked whether they are purchasing more or less from suppliers now than in the previous period. If more than half say they increased their purchases (the indicator is greater than fifty), this suggests the economy will grow in the near future. If, on the other hand, more than half of the purchasing managers indicate they have purchased less than in the previous period (the indicator is less than fifty), the economy is expected to slow or decline in the near future.
We calculated the average of the manufacturing PMIs of the ten largest economies in the world weighted by GDP — that is, a synthetic PMI that reflects 67.1 percent of world GDP.
Our indicator shows a clear decline since the maximum of 56.6 in December 2017. It was 50.1 in June 2019 — still positive, but evincing a clear downward trend. We can also see the indicator’s strong correlation with economic growth.
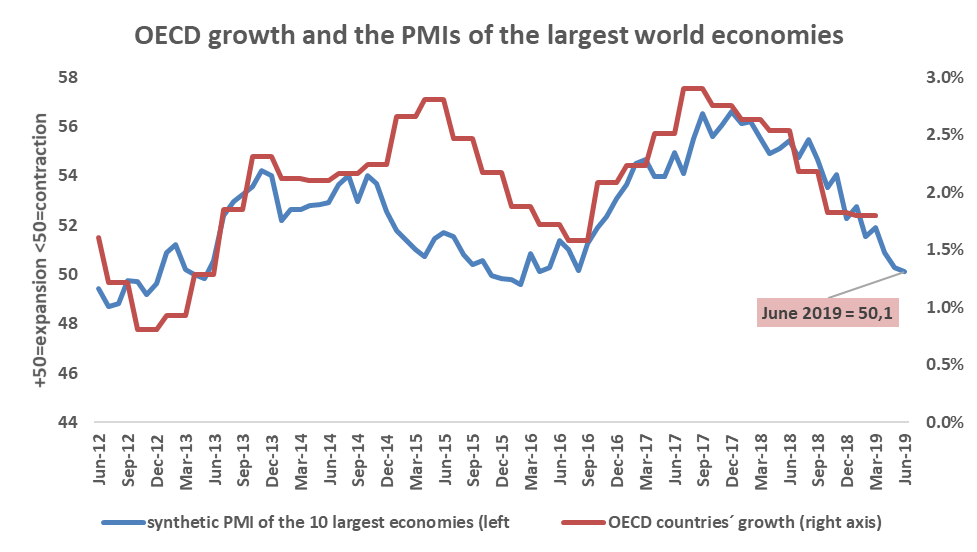
Source: Investing.com; OECD
To analyze whether economic problems are global, it is also worth following the PMIs of small, open economies. The internal dynamics of large economies do not always give signs of coming global slowdowns or recessions. In small economies we expect to see such signs some time in advance.
The PMIs of small, open economies have declined in the last two months. The decline has been faster in those economies than in large ones. This could indicate future global growth problems.
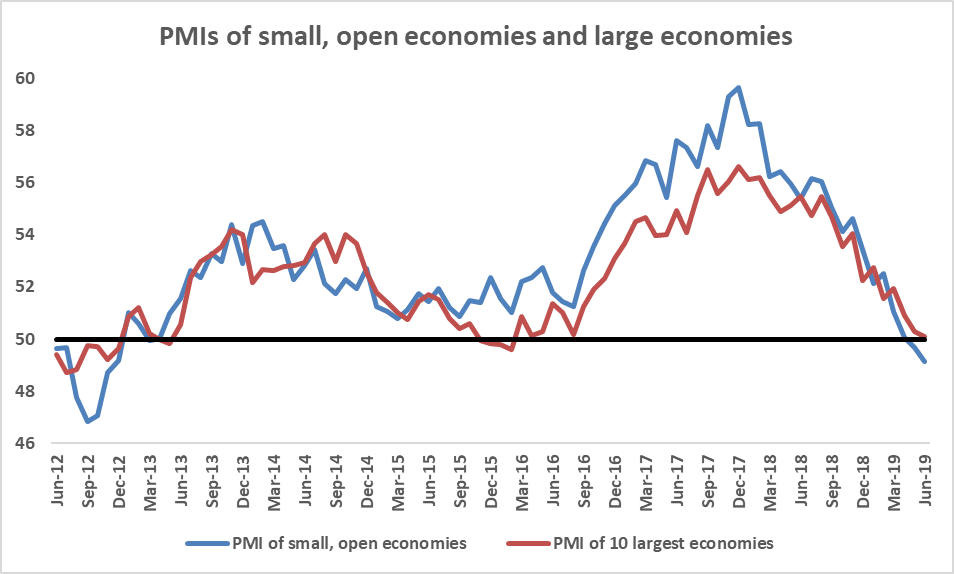
Source: Investing.com
Accordingly, although the PMIs still do not clearly predict a recession in the near future, they are declining significantly.
The TED Spread
The TED spread is the differential between the sovereign-bond yield and the financing cost in the financial sector (LIBOR or equivalent). This indicator measures the risk premium of the financial sector. In times of economic expansion and financial calm, the spread tends to be close to zero. However, in moments of financial stress that precede economic crises, the spread increases rapidly.
The TED spread is at a relatively low level in the US and does not indicate financial stress nor the possibility of a crisis in the short term.

Source: St. Louis Fed
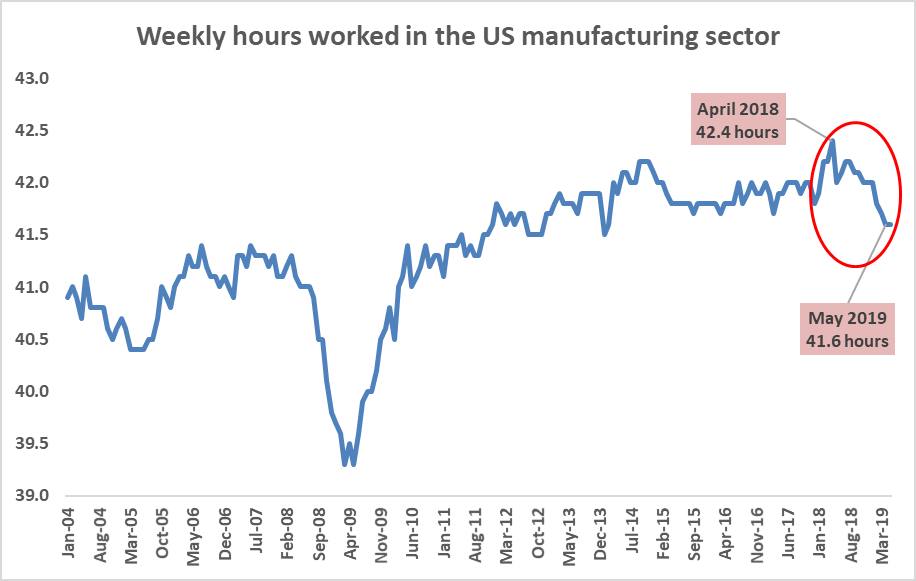
Weekly Hours Worked by Manufacturing-Sector Workers
The average weekly hours worked in the manufacturing sector may be a better leading indicator than unemployment. Many businesses that face a fall in demand prefer to cut back work hours before taking more drastic measures, such as laying off their employees.
Of the last twelve economic crises in the US, this indicator was able to predict ten of them. However, the indicator has a significant limitation: false positives. In other words, its warnings of possible crises are much more frequent than actual crises. Thus, this indicator should be used only to supplement other indicators.
This indicator has started to decline slightly in the US. The fall in average hours worked weekly is the greatest since the crisis of 2008–9. However, it is still too soon to know whether we are looking at a false positive or a credible warning sign.
Source: St. Louis Fed
The Performance of Other Indicators
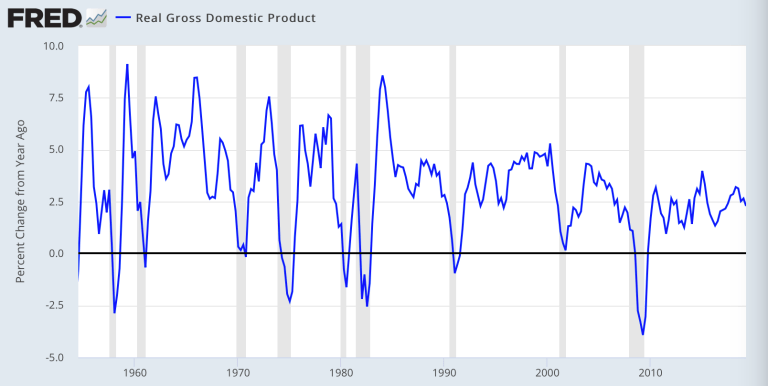
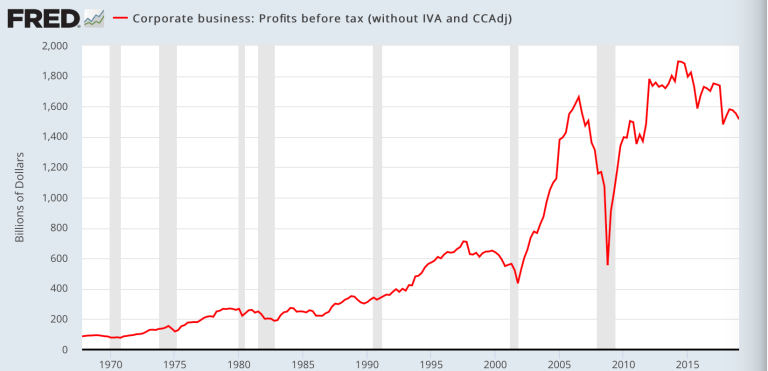
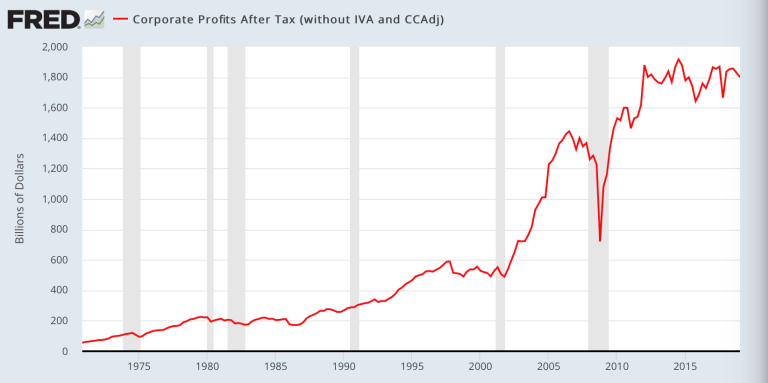
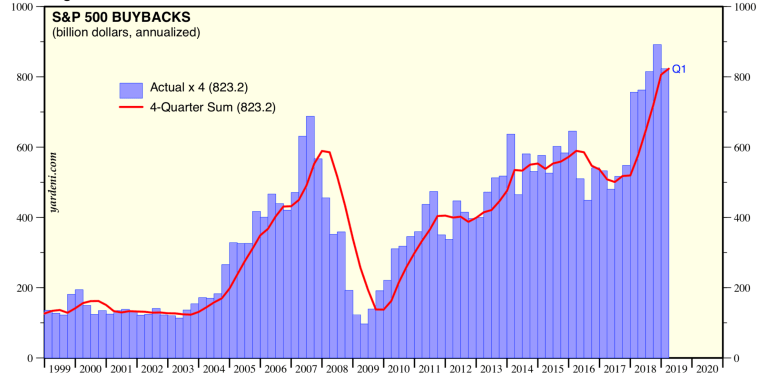
Other indicators show the North American and Eurozone economies are in perfect shape. For example, US economic growth is strong. The unemployment rates are very low in the US and in the Eurozone, and they are in constant decline. The US stock indexes are at record highs driven by unusually high corporate profits, which also are increasing workers’ salaries.
However, all of these auspicious indicators are procyclical and are usually at record highs before an economic crisis. Before the financial and economic collapse of 2008–9, they were all at record highs. Unemployment has been at a record low immediately before all US recessions since World War II (eleven recessions total).
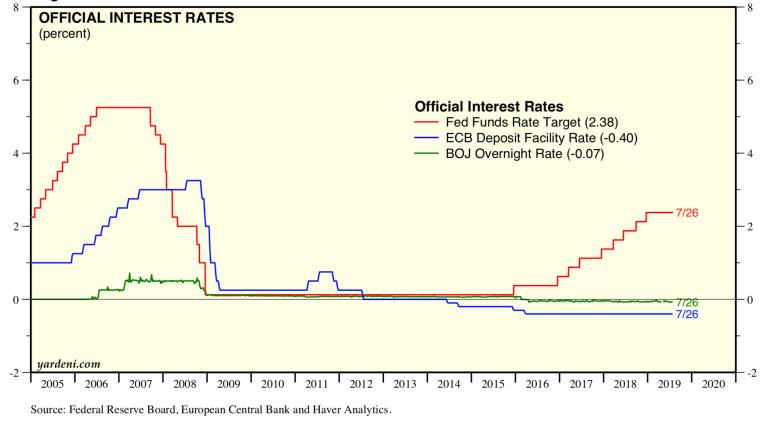
The Fed itself is observing the weakness of the US economy and has already indicated possible interest rate cuts in the near future. Every time the Fed has cut rates when unemployment was less than 4 percent (as in the current situation), an economic crisis has followed almost immediately afterward.

Source: St. Louis Fed; Javier Salamanca
Conclusion
The indicators shown here are some of the leading business cycle indicators we consider to be most accurate. Many other indicators can of course be included in an analysis of this kind, such as credit dynamics, the amount of currency in circulation, corporate risk spreads, and the demand for cyclical goods.
The indicators included here show weakness in the global economy. They indicate a possible crisis and recession in the US economy and perhaps in Europe as well. The crisis and recession do not appear to be imminent, but they are near. The yield curves indicate that the US recession could take place no less than six months and no more than twenty-four months from now. The world PMIs indicate a clear slowdown in global growth. They are close to recession levels, although they are still in neutral territory. However, the TED spread, which measures stress in the financial sector, is not showing any problems. Finally, the Fed is anticipating problems, as witness its announcement of possible cuts to the interest rate.
If our thesis holds true, there is still some time for economic agents to prepare themselves for an economic future with more shadow than light.
via ZeroHedge News https://ift.tt/2KcCA7x Tyler Durden


