Recession? The Risk Isn’t Gone
Authored by Lance Roberts via RealInvestmentAdvice.com,
Over the last few weeks, we have been discussing the “QE, Not QE” rally. Regardless of what the Fed wishes to call their bond purchases, the market has interpreted the expansion of their balance sheet as a “QE” program. Given that investors have been “trained” by the Fed’s “ringing of the bell,” the subsequent 6-week advance was not surprising.
(I might have missed a couple of “trade deal” headlines but you get the drift.)
The important part of our discussion over the last several weeks has been twofold:
-
What are the expected returns from various asset classes during a QE program, and;
-
Hedging for a short-term correction given the rather extreme overbought condition that occurred.
This week, we updated our previous analysis for our RIAPro Subscribers (30-Day Free Trial) on historical QE programs to review how far each of these markets and sectors have responded so far. The results were quite surprising. (If you subscribe for a 30-day Free Trial you can read the entire report ‘An Investor’s Guide To QE-4 The Update’)”
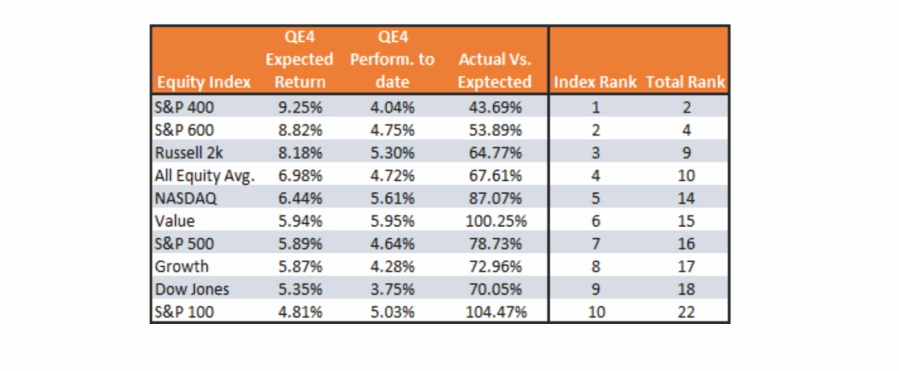
“The bottom line is that the Fed has taken massive steps over the last few months to provide liquidity to the financial markets. As we saw in prior QEs, this liquidity distorts financial markets. The following table provides the original return projections by asset class as well as performance returns since October 14th. The rankings are based on projected performance by asset class and total.”
(Get the FREE trial to see the full table of all markets, sectors, and commodities.)
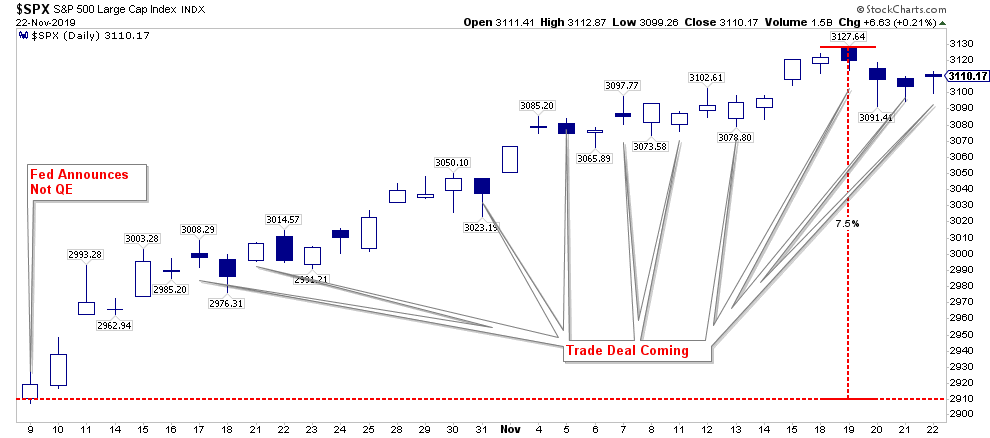
With QE-4 in play, the bias remains to the upside keeping our target of 3300 on the S&P 500 in place. This is particularly the case as we head further into the seasonally strong period combined with an election year cycle.
As shown in the chart below, the breakout to all-time highs was substantial, and regardless of your bias, this was a “bullish” advance and suggests higher prices in the short-term.
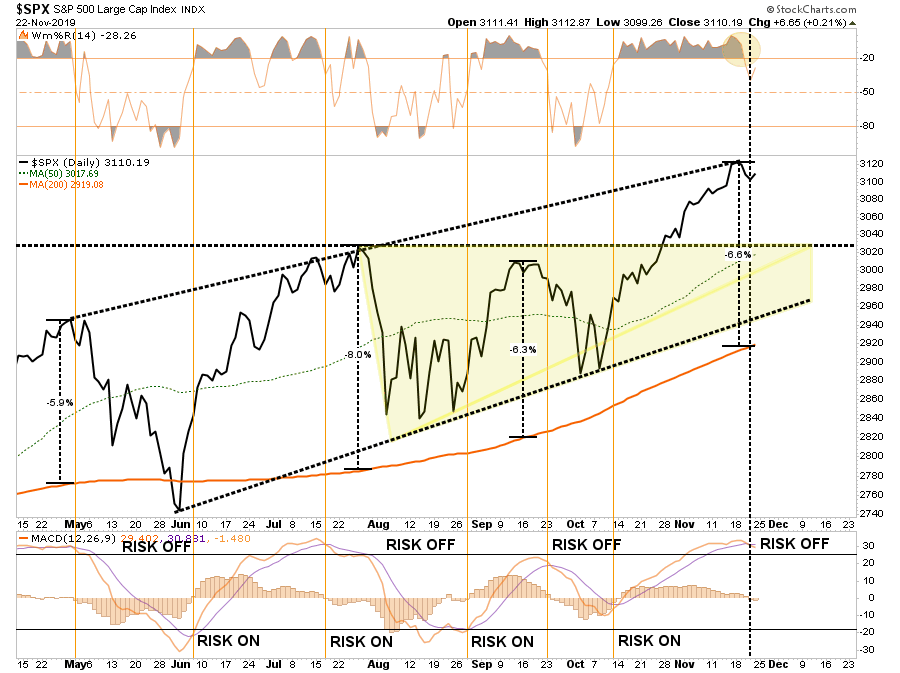
However, nothing travels in a straight line, and given the exceedingly overbought condition which currently exists, as we discussed previously, is why we hedged our portfolios. To wit:
“With the Fed engaged in pumping liquidity into the markets, and any day may also include a random market manipulation from a ‘Trump tweet,’ the most opportunistic method to hedge risk is to add a ‘short S&P 500’ index position to the portfolio.”
We currently still maintain our hedge at the moment.
Our short-term concern remains Trump’s “trade deal” dealings. The Chinese are stringing him along, now with calls for more meetings, even as he signs a bill which will directly infuriate the Chinese Government over their dealings with Hong Kong.
As I stated many times in this weekly missive, the Chinese are under NO pressure to “do any deal” with Trump which is not beneficial to their long-term economic goals.
“China is out for “China’s” best interest and will not acquiesce to any deal which derails their long-term plans. In the short-term, they may ‘play the game’ to get what they need as a country, but in the long-run, they will protect their own interests.
The pressure is on the Trump Administration to conclude a ‘deal,’ not China. Trump needs a deal done before the 2020 election cycle; AND he needs the markets and economy to be strong. If the markets and economy weaken because of tariffs, which are a tax on domestic consumers and corporate profits, as they did in 2018, the risk of electoral losses rise.”
There is a lot of room for disappointment over “trade” with respect to the markets.
-
Trump continues to delay
-
The Chinese “push back” over Hong Kong, or
-
Trump reignites, or just fails to delay, tariffs.
The market will likely not respond kindly to any of these disappointments as invetors have already priced in the most optimistic of outcomes.
Recession Risk Isn’t Gone
With the Fed once again engaged in QE, each “dip is bought” as “FOMO” continues to prevail. As the markets push higher, investors now believe the risk of recession is now gone.
However, as I have noted previously, there is a vast difference between today and 2009 when the Fed first launched QE-1 namely trailing valuations were 13x versus 30x currently. Also, pretty much every other metric is reversed as well.
As I wrote in “QE – Then, Now, & Why It May Not Work:
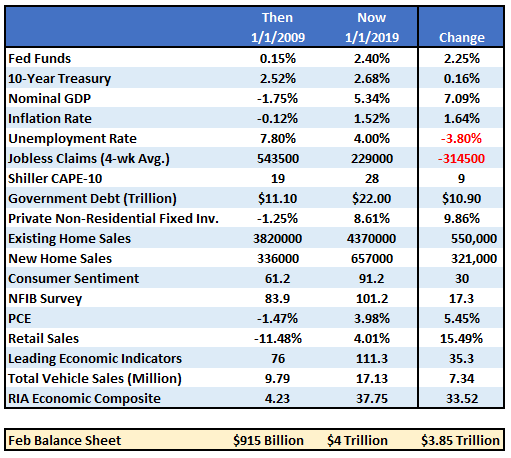
If the market fell into a recession tomorrow, the Fed would be starting with roughly a $4 Trillion balance sheet with interest rates 2% lower than they were in 2009. In other words, the ability of the Fed to ‘bailout’ the markets today, is much more limited than it was in 2008.
However, there is more to the story than just the Fed’s balance sheet and funds rate. The entire backdrop is completely reversed. The table below compares a variety of financial and economic factors from 2009 to the present.”
“The critical point here is that QE and rate reductions have the MOST effect when the economy, markets, and investors have been ‘blown out,’ deviations from the ‘norm’ are extended, and confidence is exceedingly negative.
In other words, there is nowhere to go but up.”
While such does not mean the market will crash tomorrow, next quarter, or next year, it does suggest that forward returns are likely going to become much harder to come by.
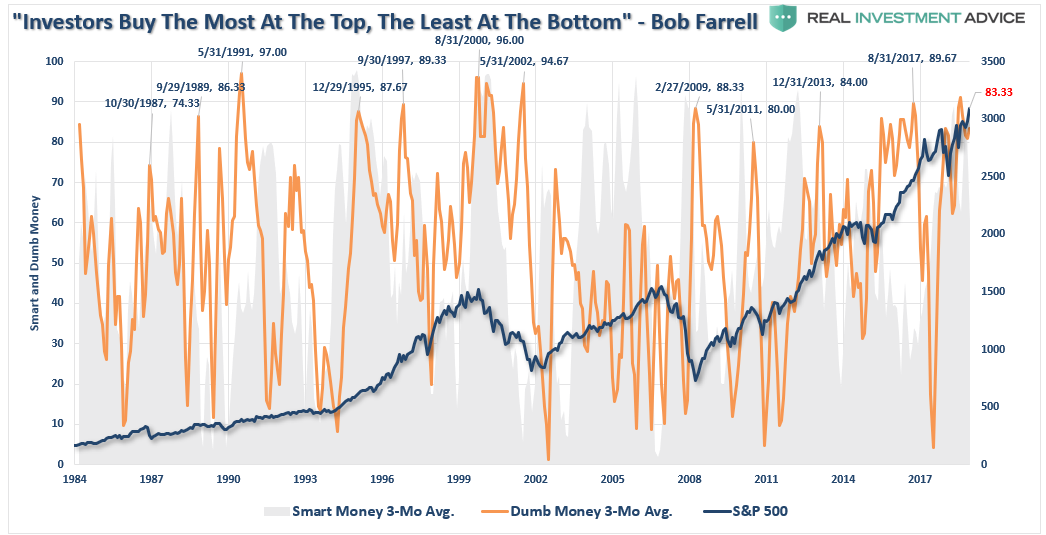
This is a point being dismissed by investors in the rush to chase markets higher. As we showed last week, investor sentiment swung from very “bearish” to “exceedingly bullish” in just a few short weeks.
This surge should not be dismissed, as David Rosenberg noted this past week:
“Enjoy it while it lasts, but think of how artificial it all really is and how to prepare yourself, at these lofty price levels, for the reversal that is as inevitable as night following day and vice versa. The stock market surely remains on wheels and is being driven by concentrated gains in certain large-cap names and a major shift in economic sentiment, with views that a ‘phase one’ trade agreement is coming our way soon.”
The problem is that there is not a “major shift” coming for the economy, at least not yet, as shown by the readings from our Economic Output Composite Index (EOCI).
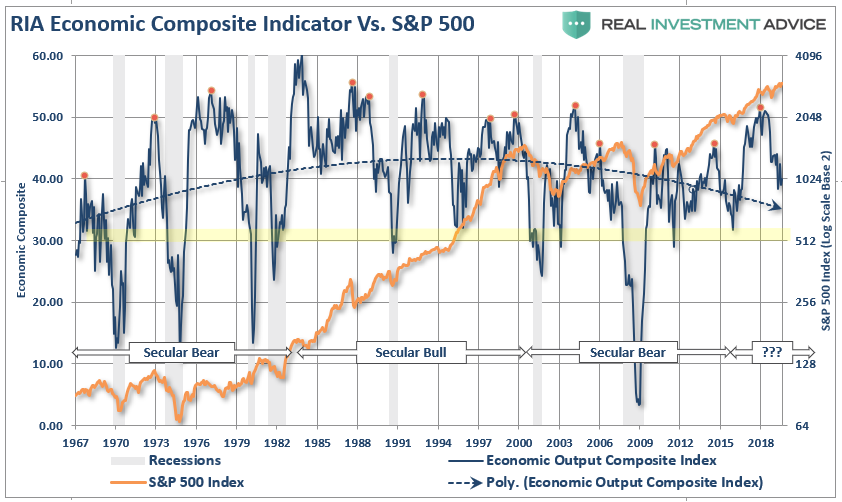
There are a couple of important points to note in this very long-term chart.
-
Economic contractions tend to reverse fairly frequently from high peaks and those contractions tend to revert towards the 30-reading on the chart. Recessions are always present with sustained readings below the 30-level.
-
The financial markets generally correct in price as weaker economic data weighs on market outlooks.
Currently, the EOCI index suggests there is more contraction to come in the coming months, which will likely weigh on asset prices as earnings estimates and outlooks are ratcheted down heading into 2020.
Again, this is a long-term indicator, but currently, the deviation between stock prices and economic growth is somewhat concerning. Throughout history, stock prices always, without exception, have “caught down” to the economic data and not vice-versa.
Furthermore, as we noted for our RIAPro Subscribers on Friday in our daily market commentary:
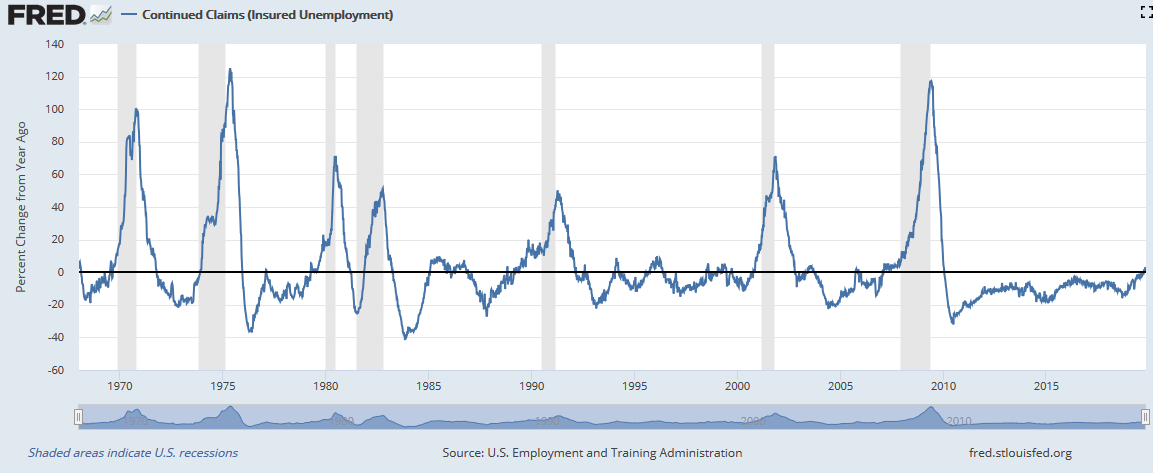
“The chart below shows that the year over year change in continued claims (new and old claims), turned positive for the first time in this economic expansion. Positive readings have preceded all prior recessions since at least 1970, but it’s not a full-proof indicator as there have been a number of false signals.”
Furthermore:
“Leading Economic Indicators rose 0.3% year over year, which is the slowest rate of growth in a decade. The last 5 times the index went from positive to negative growth on a year over year basis resulted in four recessions (2008, 2001, 1990, and 1981) and one false signal (1996). On a monthly the basis the indicator was negative for the third month in a row. Since the data was first calculated in 1959, three consecutive monthly declines occurred 11 times and 7 of those 11, were followed by a recession within 6 months. Needless to say, this indicator is flashing a warning sign.”
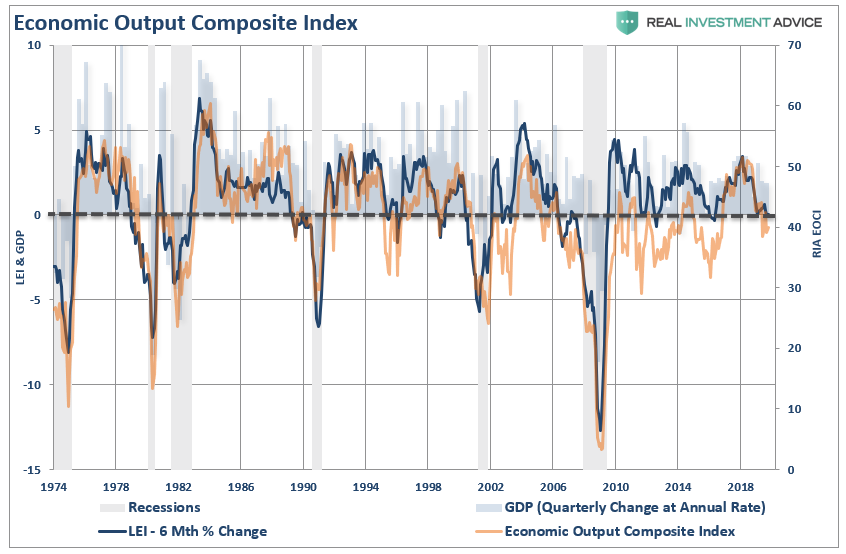
If we overlay the 6-month average of the Leading Economic Index with our EOCI index we see clear warnings of potential recession risks heading into 2020.
The point here is that “risk” remains elevated, and when that “risk” is combined with investor “exuberance,” poor outcomes tend to occur. By the way, it’s not just individuals who are overly exuberant, but professionals as well. As David concluded:
“In barely more than a month, we have seen portfolio managers move from their highest cash levels and recession concerns in a decade to downright exuberance. The just-released [Bank of America Merrill Lynch] survey of institutional investors showed the biggest improvement in economic growth expectations in the year ahead since the poll began in 1994.”
This is purely “FOMO,” in action.
Where Does This Leave Our Hedges?
As noted last week, we hedged our long-equity positions with a short-market hedge. This was done in anticipation of a short-term correction due solely to the more extreme overbought technical conditions.
The correction this past week is likely not yet complete. Our short-term trading indicators are NOT oversold, but it is worth noting they are not as overbought as they were. This suggests the market could certainly muster a post-Thanksgiving rally.
Looking ahead, a subsequent pre-Christmas correction remains likely, particularly as the market drifts between one “trade deal” tweet, to the next.
For now, we continue to maintain our hedges as all of our indicators are still suggestive of a short-term reversal.
Longer-term, a deeper correction remains likely, particularly as we head into 2020. If economic and earnings data don’t begin to improve markedly, as currently expected by Wall Street, the current overvaluation of asset price is going to become more problematic to justify.
Tyler Durden
Sun, 11/24/2019 – 10:30
via ZeroHedge News https://ift.tt/33hPHfc Tyler Durden