“Inflation Is Inevitably Going To Rise” – Is Alan Greenspan Right?
“Right now, there’s no real inflation at play. But if we go further than we are currently, inflation is inevitably going to rise.” That’s from Alan Greenspan on CNBC this week. The “further” relates to US Federal deficit spending, the idea being that +$1 trillion annual budget shortfalls will eventually trigger price inflation.
It isn’t just Greenspan that is worried about rising US consumer price inflation; as we read through the most bearish market commentaries for 2020 this concern often has pride of place. Easy monetary and fiscal policy combined with a reaccelerating US/global economy late in a cycle is THE playbook for rising prices, so fair enough. The counterarguments are more structural (aging demographics, Internet price discovery, etc.), and while those work over the long term we can’t lean on them too hard in any given year. So do the inflation hawks have a case to make about 2020?
You know our methods for evaluating questions like this – a combination of market-based expectations and historical/real time data – so let’s get right to it:
#1: Expected 10-year inflation expectations imbedded in Treasury Inflation Protected bonds (TIPS spreads):
-
Even during the period of Federal Reserve bond buying, TIPS spreads were reasonable proxies for market expectations about long-run future inflation. The lowest they ever got was 1.2% in early 2016 and they have often been +2.0% over the last decade, the Fed’s notional target (see chart below).
-
TIPS spreads were +2.0% for almost all of 2018, for example, only dropping in November along with US/global growth expectations.
-
Expected 10-year forward inflation as measured by the TIPS market hasn’t touched 2.0% in 2019 and currently sits at 1.73%.
Bottom line: after many years of holding out hope that US structural inflation could hold at 2.0%, TIPS spreads have thrown in the towel. The current TIPS spread of 1.73% is almost spot-on the 12 month average CPI of 1.82%. Even with the recently announced Phase 1 US-China trade deal and USMCA’s imminent passage, a late-year global equity rally, and a dovish Fed this market has resolutely refused to countenance the idea that US price inflation can make a comeback.
Here is the 10-year TIPS spread chart for the last decade:
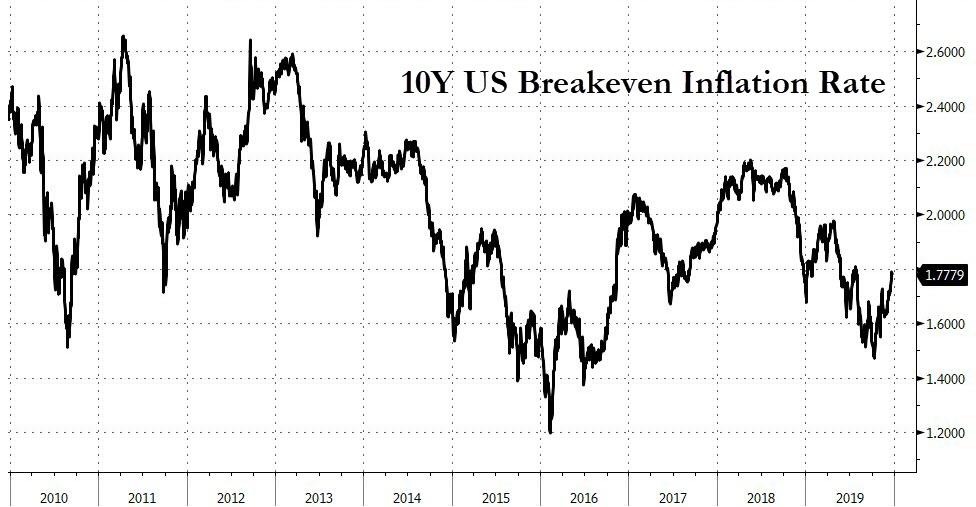
Source: Bloomberg
#2: Core measures of inflation (PCE and CPI):
-
The Fed uses Personal Consumption Expenditures (PCE) data, while markets tend to look at the Consumer Price Index (CPI). Since 2000 core (ex-food and energy) PCE inflation has been lower than core CPI. We’ve included an explainer from the Cleveland Fed below if you want to learn more about why that’s the case.
-
The latest inflation readings for each: core PCE is at 1.6% as of October 2019 (latest data) but core CPI is higher at 2.3%.
-
Over the last 12 months core PCE has: 1) never hit 2.0% and 2) averaged 1.7%.
-
Over the last 12 months core CPI has: 1) always been 2.0% or greater and 2) averaged 2.2%.
Bottom line: inflation, like beauty, is in the eye of the index-focused beholder. By the Fed’s preferred measure (PCE) the US economy is still shy of their 2.0% inflation target. By the market’s primary metric (CPI), it is running slightly hot.
Since PCE is how the Fed makes policy, here is the 10-year chart for this measure’s core inflation rate for your review (and note how few times it breaches 2.0%):
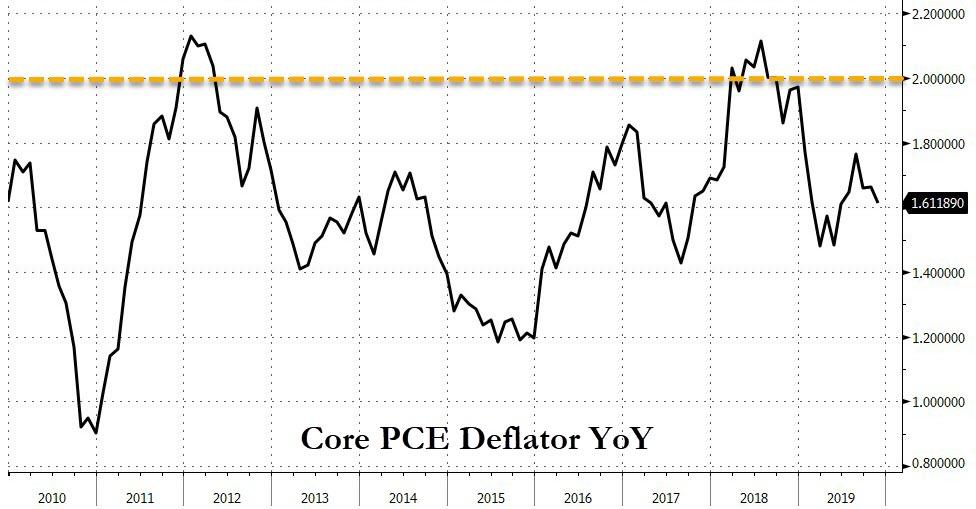
Source: Bloomberg
#3: Owners’ Equivalent Rent (OER):
-
OER is how the BLS measures housing price inflation in the CPI calculation. It asks homeowners how much their house would rent for and tracks those responses over time.
-
OER is the single most important piece of core CPI, at 31% of the total. That makes it a more important contributor of measured inflation than any other single category by a wide margin.
-
OER inflation has not accelerated in over 4 years, trending consistently between 3.0% – 3.5% since mid 2015 (see chart below).
Bottom line: given that OER inflation shows no sign of acceleration (November’s 3.3% was the lowest since January’s 3.2%), this anchor in the CPI Index seems firmly set.
Here is the OER inflation chart:
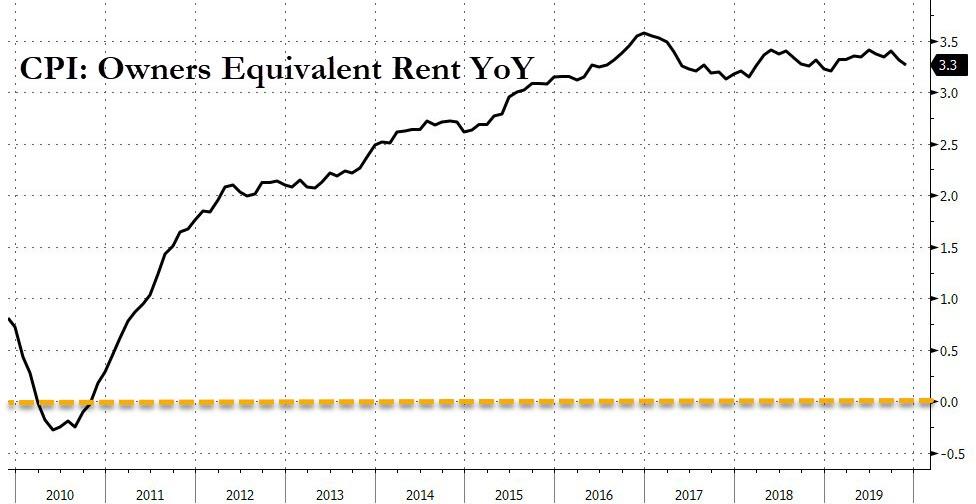
Source: Bloomberg
Now, let’s wrap this up:
-
To believe in a 2020 inflation surge, one has to assume that the US economy is at a tipping point where marginal economic growth and/or fiscal and monetary stimulus has more of an effect on prices than any point in the last decade.
-
Bond markets do not see that happening. TIPS spreads say as much, and the Treasury market is among the most efficient in the world. In fact, this market is more worried about recession (witness the still paltry difference between 3 month and 10 year yields) and lower (not higher) price inflation.
-
Also worth noting: excluding the 1965-1970 experience when CPI inflation went from 1% to 6%, oil shocks are the proximate cause of every sudden ramp in core (ex-energy) consumer prices in the last 50 years. That was the case in 1974 (3% in 1973, 12% in 1975), 1979 (6% in 1978, 14% in 1980), and 1990 (4% in 1989, 6% at the start of 1991).
Our verdict: we simply cannot make a case for structurally higher inflation either in 2020 or the following several years. First, markets say it’s unlikely and investors already know about $1 trillion deficits, low unemployment, and positive catalysts like trade deals. Second, recent history (i.e. this year) exhibits little proof an inflection point is nigh. Lastly, the one thing that could shock the system into inflation – a sudden rise in oil prices – seems unlikely. That may not be a classic monetarist’s view of the world, but the data is clear enough.
Tyler Durden
Mon, 12/23/2019 – 08:20
via ZeroHedge News https://ift.tt/2EPKr8M Tyler Durden