The Tight Rope Market
Authored by Sven Henrich via NorthmanTrader.com,
None of us can know where markets would be trading without the Fed’s constant massive liquidity injections, but now that the bubble recognition has gone mainstream (Bloomberg, FT) and acknowledged by at least one Fed president (Kaplan) I think it’s fair to say: Lower, much lower.

But while investors continue to dance on the liquidity driven momentum rally right into major resistance currently ignored data keeps suggesting that risk is much higher than anyone is willing to acknowledge. Indeed these data points suggest investors may be walking a precarious tight rope without even realizing it.
I do my best to keep pointing out these data points, but so far admittedly in vain:
It sucks being the only sober guy in a bar full of drunks. That is until they barf all over themselves.
— Sven Henrich (@NorthmanTrader) January 13, 2020
Since the Fed is currently hosting the most expensive frat party of all time it’s no wonder that investors are currently ignoring everything else consequences be damned.
I’ll let the reader be the judge, but below are a few charts I think are worth documenting as they highlight what investors are entirely ignoring at this stage.
And no I’m not talking about valuations. I’ve already made that point in the Ghosts of 2000, valuations are at records highs on many measures and that goes without saying. Valuations are high during any bubble, but rather there are underlying data trends that often precede coming recessions.
What recession? Everybody has declared recession risk to have faded. Why? Because stock prices have rallied to new all time highs? When has that ever be an indication that there is no recession risk ahead? Markets made new all time highs in the Fall of 2007. The recession started in December of 2007. Markets rallied to new all time highs in 2000. Did that mean there was no recession in 2001/2002? Of course now.
If anything high optimism is always a concern as it historically it is followed by, well, less optimism:
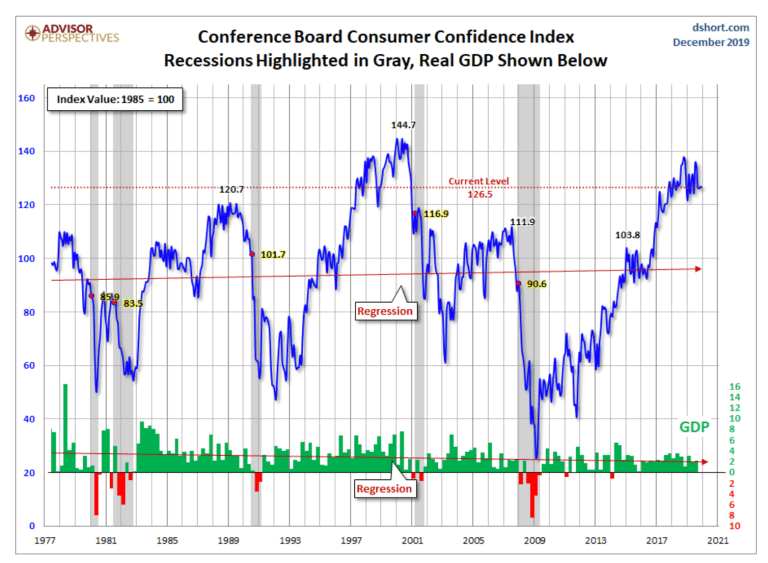
Yield curves have un-inverted and everybody declares recession risk to be over. Why?
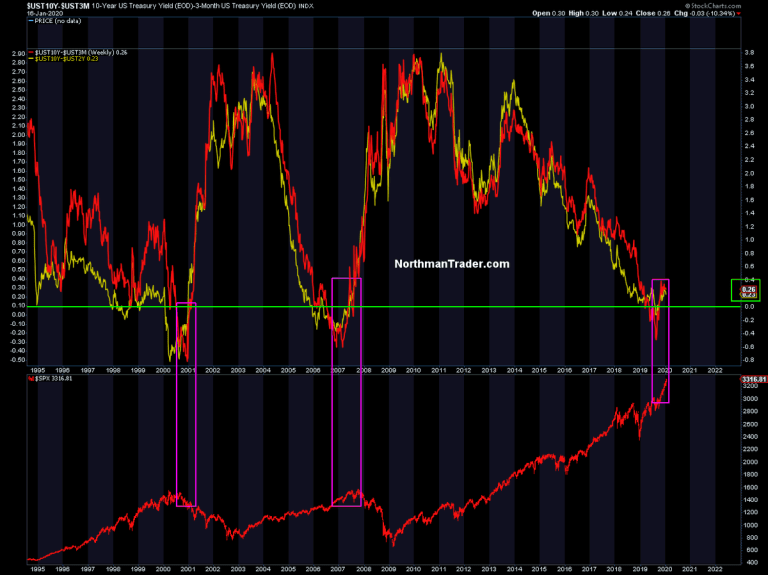
The steepening has traditionally been the red flag ahead of a recession. Along with a slew of other data points that everybody is again ignoring.
In order for markets to grow into excessive valuations you need growth to follow suit. In order to see growth to emerge you need to see an expansion investment and credit.
Commercial and industrial loan growth shows none of that, it continues to decline:
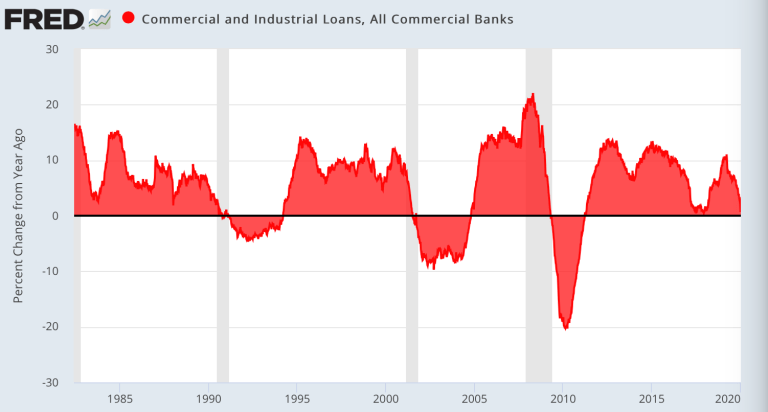
Often associated with coming recessions it signals that companies are not as confident as markets who are hoping for a 2016 repeat. But then we didnt have a yield curve inversion and then steepening.
In context then it’s perhaps noteworthy that suddenly job openings have dropped hard, the most in this cycle:
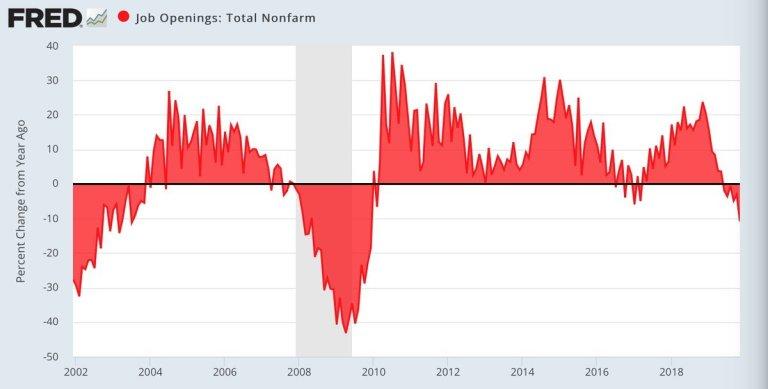
This cycle remains very much long in the tooth and slowing employment growth is always a red flag at the end of a cycle. Where are the great new hiring plans?
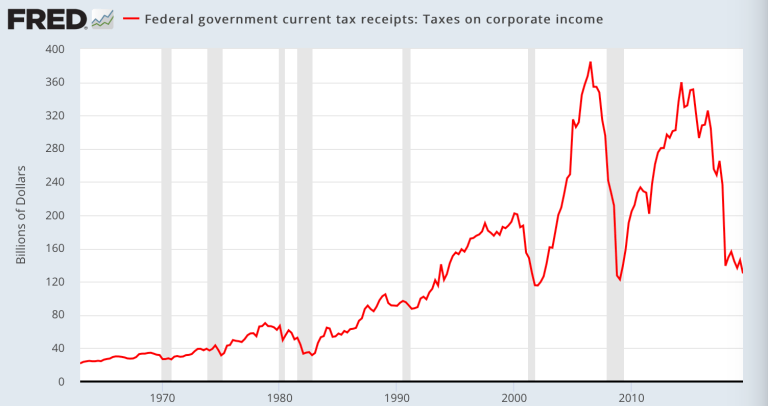
May I remind everyone there’s a US election coming and this one may have consequences. I can’t predict elections, but depending on outcome it may bring about a change in tax outlook.
Corporations surely must know that they were handed an unprecedented gift during the Trump presidency that may not last forever:
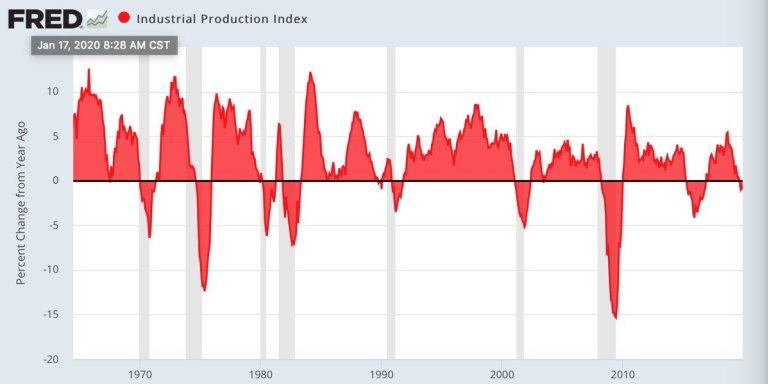
Uncertainty breeds risk and corporations may well hold off on big expansionary plans until after the election, especially considering that there a few signs that industrial production growth is picking up at this stage:
In fact, despite being awash in cash and in a tax nirvana corporations appear to dial it back on the buyback bonanza front:
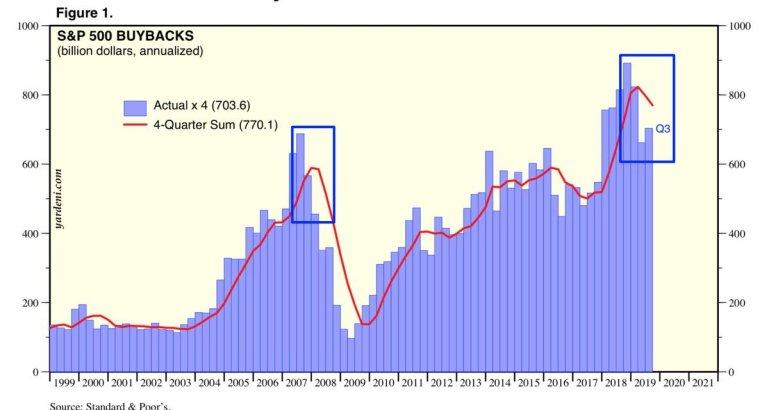
As they do when they sense growth issues ahead (see 2007 into 2008).
On that note, here’s a little watched indicator, heavy weight truck sales:
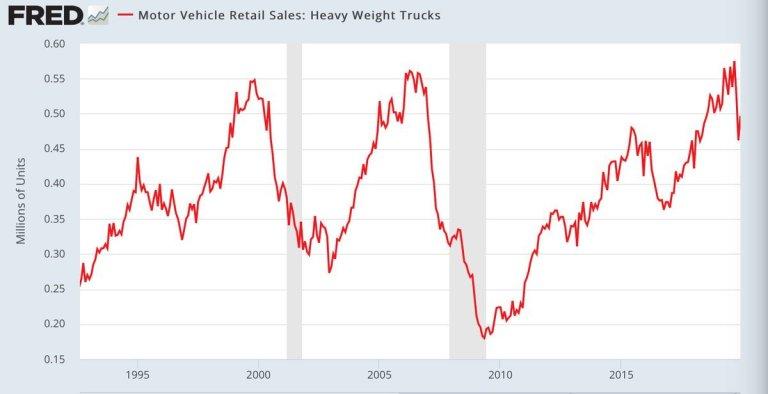
Oddly enough that one dropped hard in front of the last 2 recessions following an aggressive ramp up. And it just did as well.
These data points are by far an exhaustive list, but they show a confluent picture of data points that suggest recession risk is not off the table. If anything they show factors that are entirely consistent with previous business cycles coming to an end.
And if this rally is all Fed driven, then it’s the Fed that will have brought about the final spurt of excess that will lead to an ugly reversion that could bring about the very recession it was so scared of in the first place.
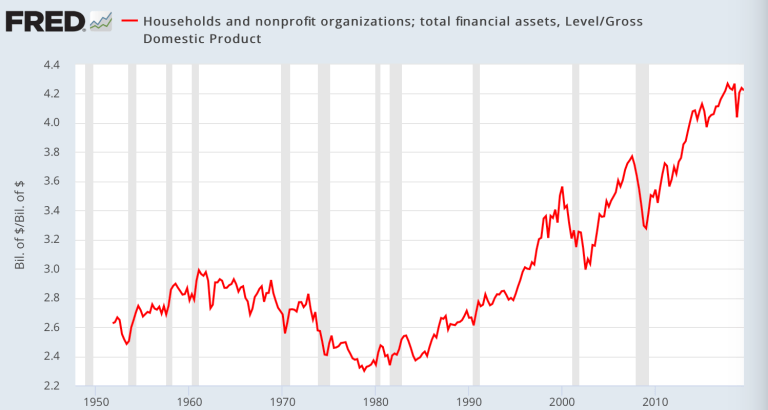
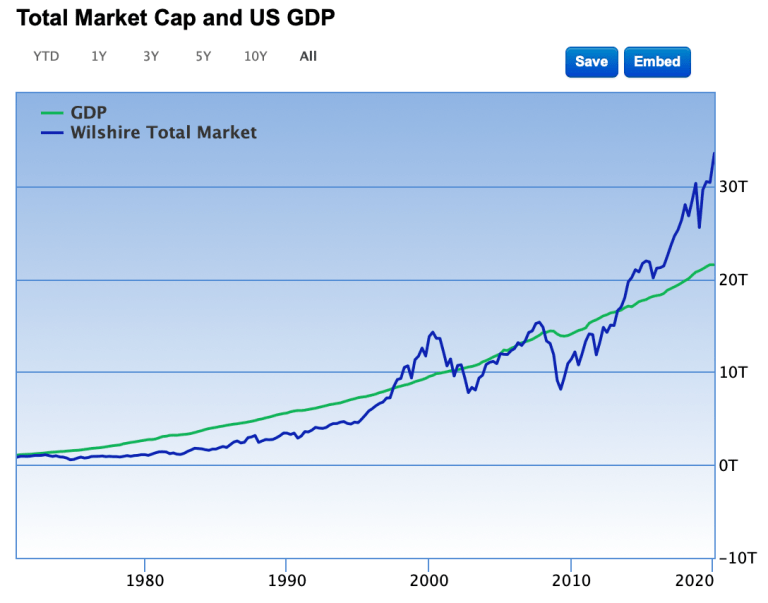
It’s not like financial asset valuations versus the the underlying size of the economy are historically outsized or anything:
The New York Fed Nowcast keeps showing less than 2% GDP growth for Q4 2019 and Q1 2020. 1.2% and 1.7% respectively.
That’s the growth we get with a $400B expansion in the Fed’s balance sheet, 3 rate cuts and a trillion dollar deficit?
“Who the hell cares about the budget?”
Nobody apparently. https://t.co/kLj6AoZPyo pic.twitter.com/2tQ53VL3mL
— Sven Henrich (@NorthmanTrader) January 18, 2020
It’s almost as if the Fed’s power to stimulate growth is waning:
The Era of Fed Power Is Over. Prepare for a More Perilous Road Ahead.
Central banks have long exercised influence over booms and busts, but their ability is shrinking:https://t.co/QdAfa1aFQp— Sven Henrich (@NorthmanTrader) January 19, 2020
I submit investors, drunk at the latest Fed party, are walking a very tight rope. Who’s the designated driver once the party ends?
* * *
For the latest public analysis please visit NorthmanTrader. To subscribe to our market products please visit Services.
Tyler Durden
Sun, 01/19/2020 – 16:15
via ZeroHedge News https://ift.tt/37dMFvq Tyler Durden