The Bad News, The Good News… And What To Do
Authored by Bank of America’s Chief Investment Officer, Michael Hartnett
Key takeaways
- Market cap loss: $6tn in global stocks, $4tn in US stocks in just 6 trading days.
- Credit “ghost in the machine” remains biggest market risk.
- We say March will be policy panic month, risk to rally.
The bad news…
Credit event: risk of credit event surging…extreme bond ETF volumes (e.g. HYG), ominous breakdown in levered loan ETF BKLN (Chart 2), CDS widening; exogenous shocks often expose bad leverage (e.g. Kobe earthquake led to Barings, Asia crisis… LTCM); liquidation of $1tn annualized bond inflows exposing systemic “ghost in the machine” remains biggest 2020 market risk (catalyst for policy response).
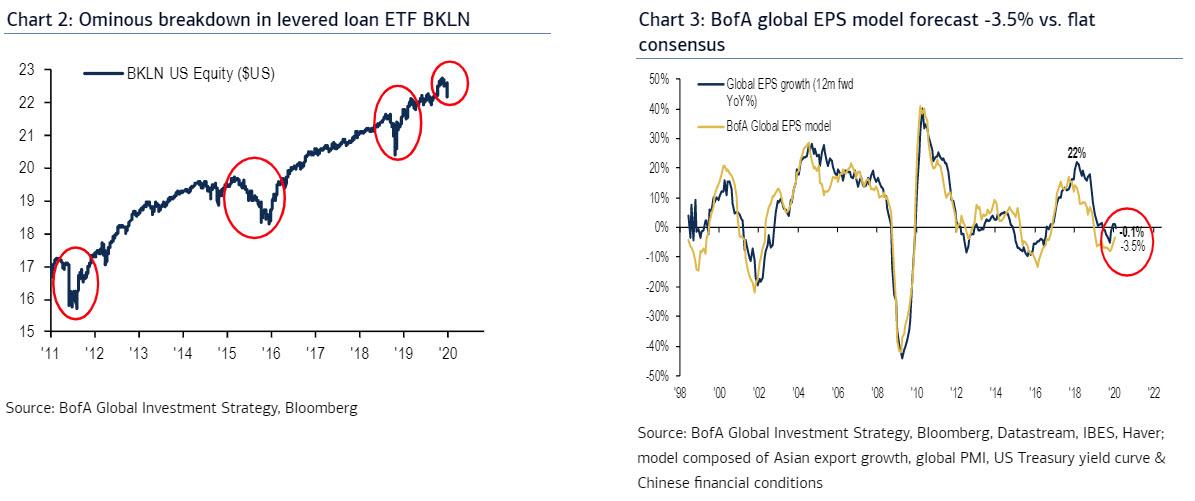
Macro: risk of global recession rising…BofA economists cut 2020 global growth to 2.8%, lowest since 2009 (link); BofA global 2020 EPS model forecasts -3.5% (vs. flat consensus)…model inputs (global PMIs, Asian exports) deteriorating (Chart 3).
Peak globalization: COVID-19 reminder that US/China tension, bifurcated global supply chains, competing technology standards…all negative for corporate profits in 2020s.
Politics: Oddschecker.com shows probability of Sanders victory in Nov’20 election @ 26%, up from 3% Oct’19 (Chart 4); US political risk hitting US$, helps explain surprise YTD outperformance of China stocks (A-shares) vs. S&P500.

Big Top: we had it coming…SPX highs, gigantic bond inflows, record low IG default risk, Microsoft, Apple, Google, Amazon all >$1tn, “toppy” corporate behavior; new lows in bond yields popped “irrational bubble” (we thought it would be Q2); “Showtime” for markets…big secular monthly floors for stocks (SPX 3000, NYA 12000, MXWD 500) must hold to prevent “Big Top”, end of bull market narrative (credit signals poor – Chart 5).
The good news…
Policy: “markets stop panicking when policy-makers start panicking”; March = policy panic month; policy-makers behind-curve, have 3/4 weeks to prevent small businesses cutting employment US & EU; Fed cuts 25/50 bps + China/Europe fiscal stimulus + semblance of global policy coordination = calmer “animal spirits” + risk rally; yield curve steeper this week, and fears of policy impotence, ironically, will boost easing impact.
Bigger Picture…YCC+MMT: crash/ recession worries accelerates Fed shift to Yield Curve Control (YCC – heavily hinted last Friday by Fed Governor Brainard) and “fixed” low rates; also accelerates shift from QE to Modern Monetary Theory (MMT) to finance fiscal spending frenzy in coming quarters…will mark crucial low in inflation expectations.
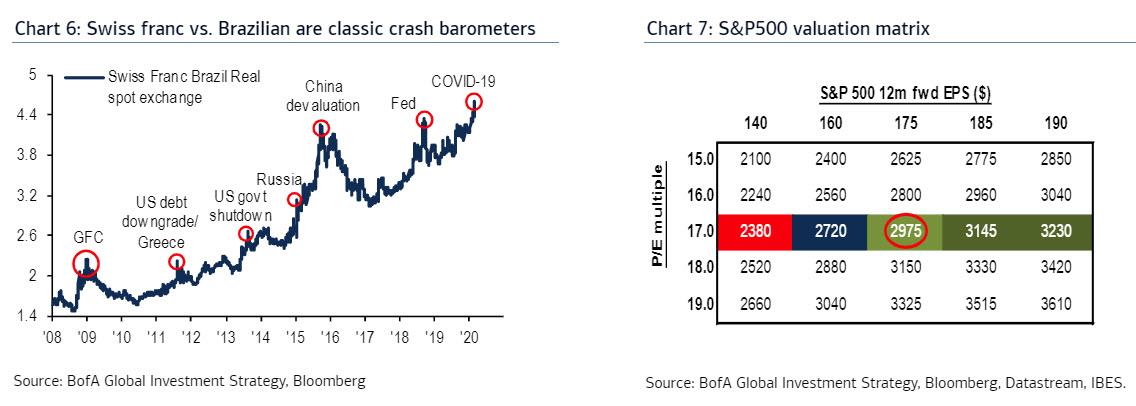
Price: BofA CTIs models today show US & EU stocks extremely oversold, US Treasuries extremely overbought; BofA Global Breadth Rule closed at 62%, could imminently hit “buy signal” of 88% (of MSCI country indices <50- & 200dma); classic crash barometers (e.g. Swiss franc vs. Brazilian real - Chart 6) ripe for reversal.
Positioning: BofA Bull & Bear Indicator peaked @ 7.1 Jan 22nd; now 4.6 (Chart 1); $20bn equity outflows this week = 19th largest past 15 years & 3rd biggest week HY bond outflow ever ($6.9bn) signal capitulation begins; record week of tech fund inflow ($2.6bn) & 7th most into IG bond funds ($11.8bn) shows capitulation incomplete.
What to do
Watch: decline in gold & Treasuries to signal panic over; decline in US IG bonds to signal its just beginning; key monthly floors of SPX 3000, NYA 12000, MXWD 500.
Buy stocks: we adjust 2020 EPS of $175 to $160 (as a 40% probability of recession means 8% EPS haircut) and apply policy reaction/yield collapse PE of 17-18X…says SPX 2880-3040 good entry point back into S&P500 (Chart 7).
Barbell stocks: 1998 analog (policy panic leads to upside) says own barbell of extreme growth and extreme value…long US Tech/FAANG and long “value ghettos” of Asia cyclicals/FTSE/oil.
Sell Treasuries: Fed panic to steepen yield curve; Treasury ETF TLT currently 2SD overbought (Chart 8).

Diversify via commodities & cash: use rally to position for rise of stagflation (demand-led lower growth, supply-led higher inflation; note in stagflation shock of Dec’68 to Sept’74 portfolio 60-40 stock-bonds dropped 5.5%, while portfolio of a 25-25-25-25 stock-bonds-commodities-cash rose 31.4% over period (Chart 9).
Tyler Durden
Fri, 02/28/2020 – 14:10
via ZeroHedge News https://ift.tt/3cerpIN Tyler Durden