“Buy The Re-Opening Rumor, Sell The Factual Horror”: 5 Reasons To Start Selling
Earlier today we posted a chart of forward PE multiples which based on crashing global profits which have yet to find a bottom, showed that the disconnect between markets and reality has reached idiotic proportions.
And while Bloomberg apparently took offense and tried to justify current stock valuations writing the “The S&P’s Real Forward P/E Is What Matters, and It’s Unknowable”, Citi’s Matt King agreed, writing that “the gap between markets and data is the largest on record”, as did Bank of America.
In a report from BofA’s Jared Woodard titled “Too fast, too furious” in reference to the recent market move higher, the strategist who learned his craft under Michael Hartnett’s wing writes that equities “seem to have run too far ahead of fundamentals. From the March lows, stocks have gained $246,567 in market cap for each newly unemployed worker.” And while overshoots are always possible, he expects stumbles ahead for five main reasons:
- Ignorance is bliss: 1 out of every 5 large companies has suspended earnings guidance
- Credit not confirming: after crashes, HY tends to bounce faster than equity; not happening today on drag from “real economy” sectors e.g. energy/retail/industrials
- Companies are saving: 1 out of every 5 large companies either suspended buybacks or cut dividends
- Households are saving: private clients bought the dip but now sell rips & are net sellers since 2012
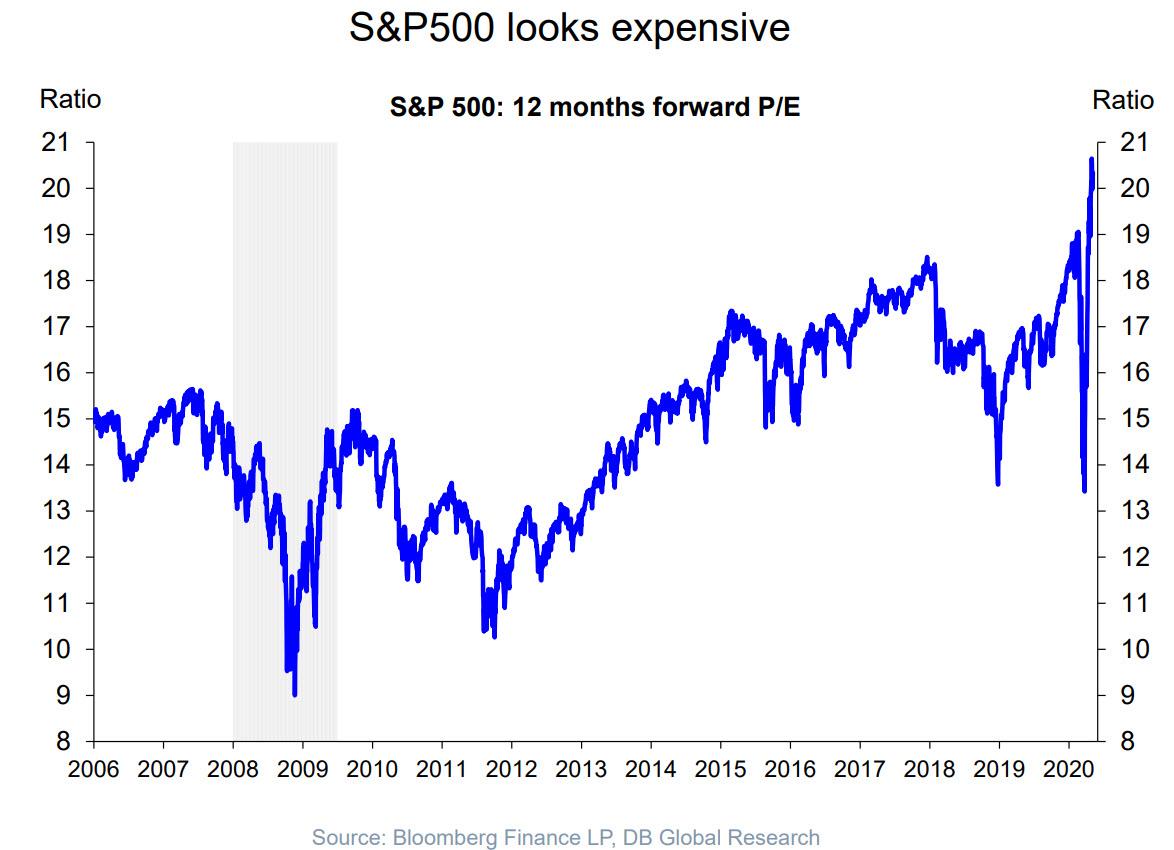
- Stocks are expensive: the S&P 500 trades at 19.4x earnings, a 20-year high; valuation favors credit
Below we present BofA’s arguments why, as Nomura’s Charlie McElligott wrote earlier, it’s time to selling the rally, but first a look at how we got here, namely “the deepest shock and the greatest response”
- “There are decades where nothing happens and there are weeks when decades happen.” (Lenin)
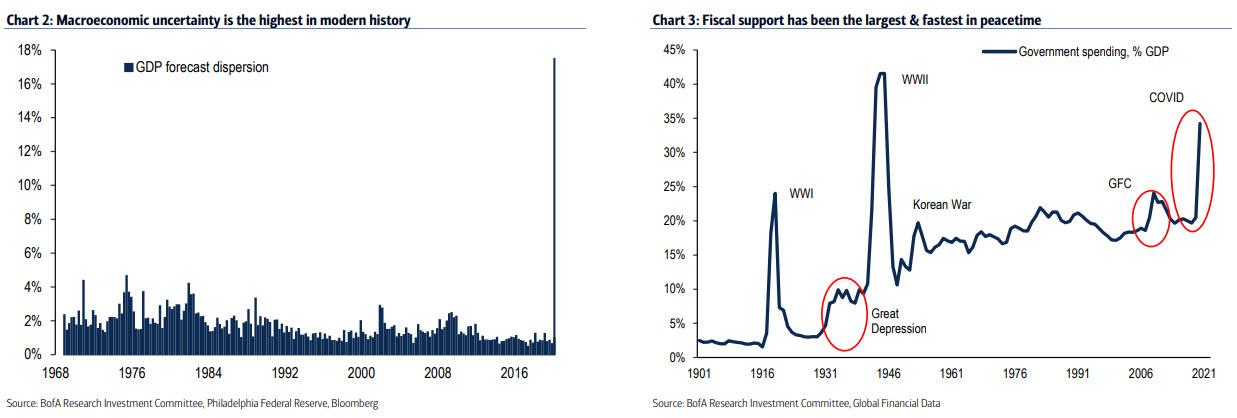
- Macro uncertainty has never been this high (Chart 2) and the virus shutdown took only 3 weeks to destroy via unemployment what the economy needed 352 weeks to build. The fastest bear market in history met with the fastest & largest fiscal response in US peacetime (Chart 3) and policy support has taken a retest of the lows off the table.
- But while overshoots are always possible, in our view there are good reasons to expect more stumbles in coming
months.
With that in mind, let’s go down BofA’s list why even banks whose “house view” is bullish can no longer hide their disgust at the “market” farce that central planning has created:
1. Ignorance is bliss
- Buy the re-opening rumor, sell the factual horror: rally-inducing news of stimulus & vaccine efforts will likely give way in coming weeks to disappointing realities of prolonged distancing, supply frictions, and confused calls for budget austerity. For example, a group of prominent restaurant owners just asked the UK government not to end the lockdown; if doors reopen, fiscal support ends, and demand has not rebounded, businesses will fail.
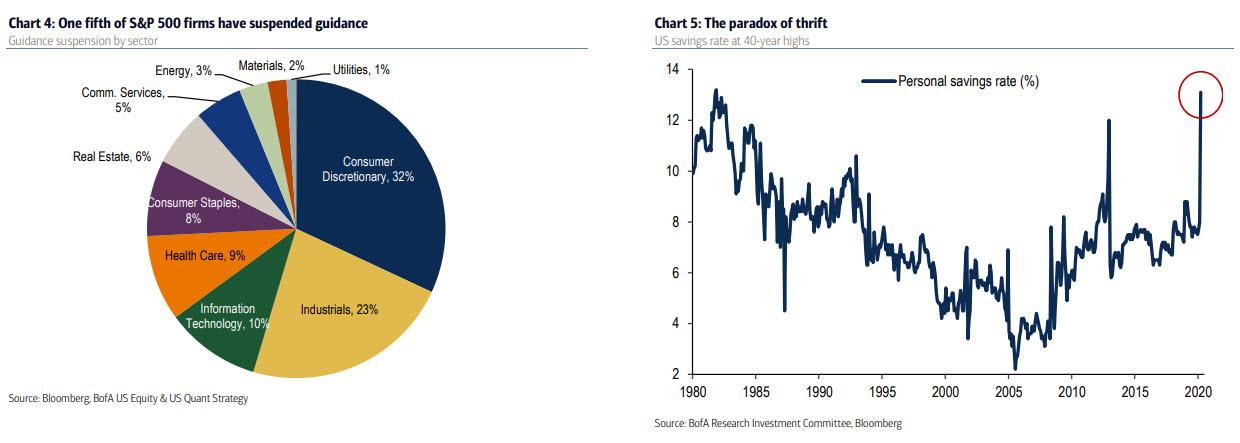
- Flying blind: 98 S&P 500 companies have suspended guidance (Chart 4) and fundamentals have rarely been cloudier. US retail specialists report that $2tn of orders were cancelled in just the first half of March. Even for doomed firms, it is hard to hold liquidation sales when no one can come.
- Dangerous savings: in March the personal savings rate spiked to 40-year highs of 13% (Chart 5). The paradox of thrift: if every sector saves at once (lower corporate capex & payouts, reticent households, fickle government), we all lose. Even if workers are quickly rehired, we don’t know yet how quickly they will be willing & able to spend.
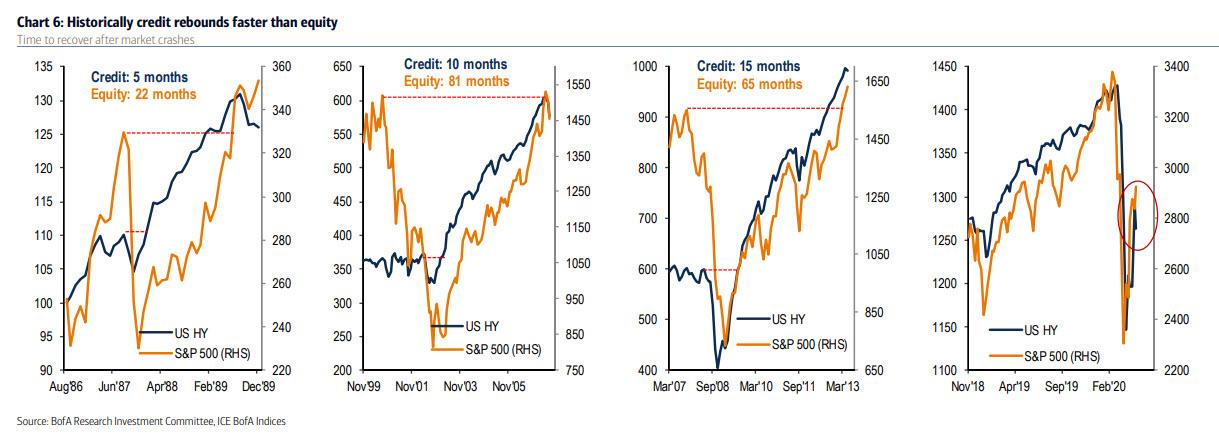
2. Credit not confirming the rally
- After the last three crashes, HY bonds made new highs within 10 months on average…equities needed 2+ years. But in recent weeks, HY has lagged rather than led (Chart 6, far right panel).
- This is due to the higher weighting of resources (energy/materials) at 24% of US HY vs. just 5% for S&P 500.
- Note the daisy chain of consequences from resources decimation. Secular trends, OPEC war & the rise of ESG = resources must defend dividends at all costs and thus cut capex. No capex = pain for industrials (e.g. CAT) & broader manufacturing. Manufacturing (8%) + retail (10%) + leisure & hospitality (11%) = 30% of US payrolls. The Great Depression peaked at 25% unemployment.
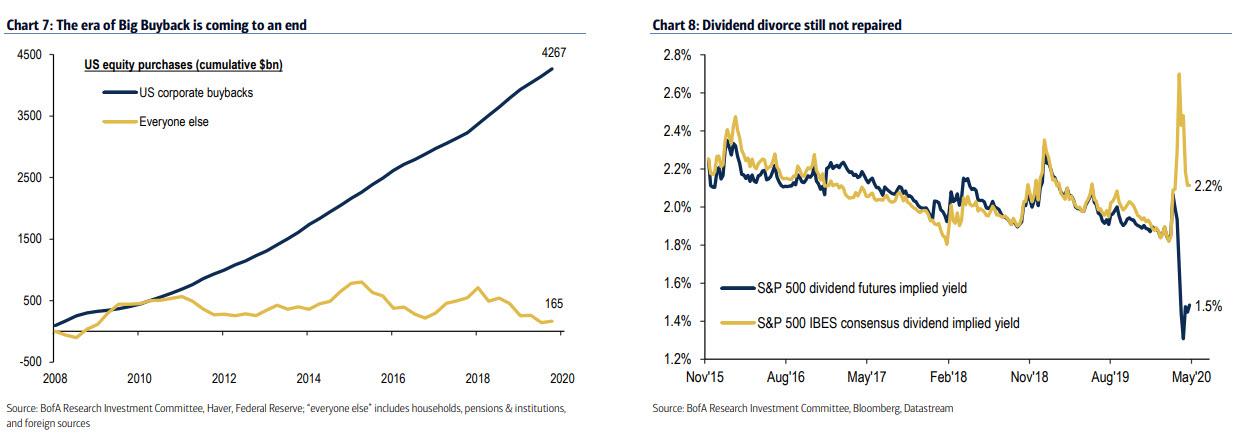
3. Buybacks and dividends are falling
- Owning equities made sense even in an era of economic stagnation because shareholders were well-paid. Since the GFC, companies bought $4.3tn of their own stock (vs. just $0.2tn of buying from other sources – Chart 7).
- But US equity market capitalization rose $7.4tn in recent weeks vs. unemployment up 30 million…equities have gained $246,567 in market cap for each newly unemployed worker. Every tick higher in equities = heavier political pressure to limit payouts.
- 70 S&P 500 companies have already cut their buybacks, and 30 have cut their dividends; consensus expectations for 2.2% dividend yields have diverged wildly with market-implied yields at just 1.5% (Chart 8).
- Tech, which briefly had positive returns again for 2020, also remains the king of buybacks. In Q1 Apple repurchased $18.5bn (& authorized another $50bn), Google $8.5bn, Microsoft $6.0bn.
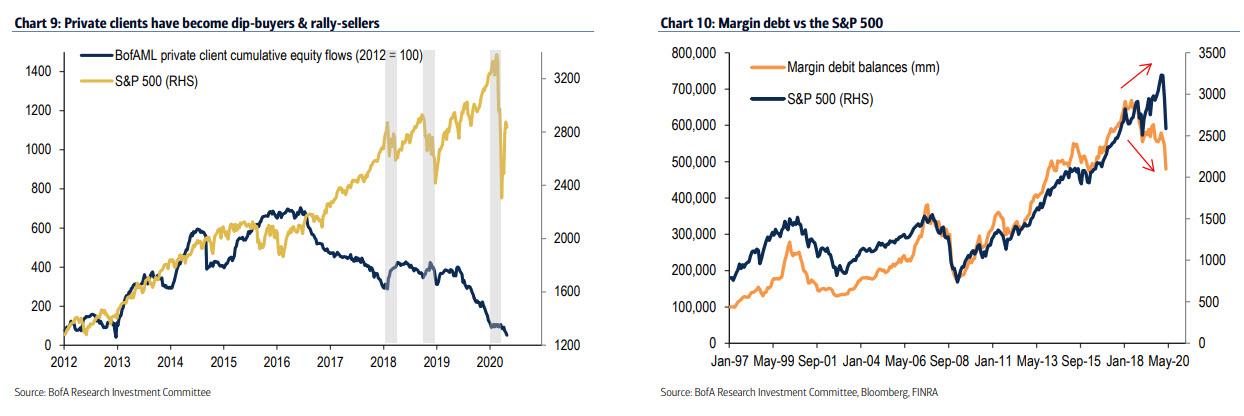
4. Households now sell into strength
- Smart money: since 2016, BofA wealth management clients have been “strong hands” during market selloffs. In 2020 private clients were small net buyers as equities tumbled (Chart 9).
- Skeptical money: they are also skeptical sellers of rallies, with net outflows from equities since 2012. Across US investor accounts, margin debt plunged in 2019-2020, failing to confirm the rally from late 2018 (Chart 10).
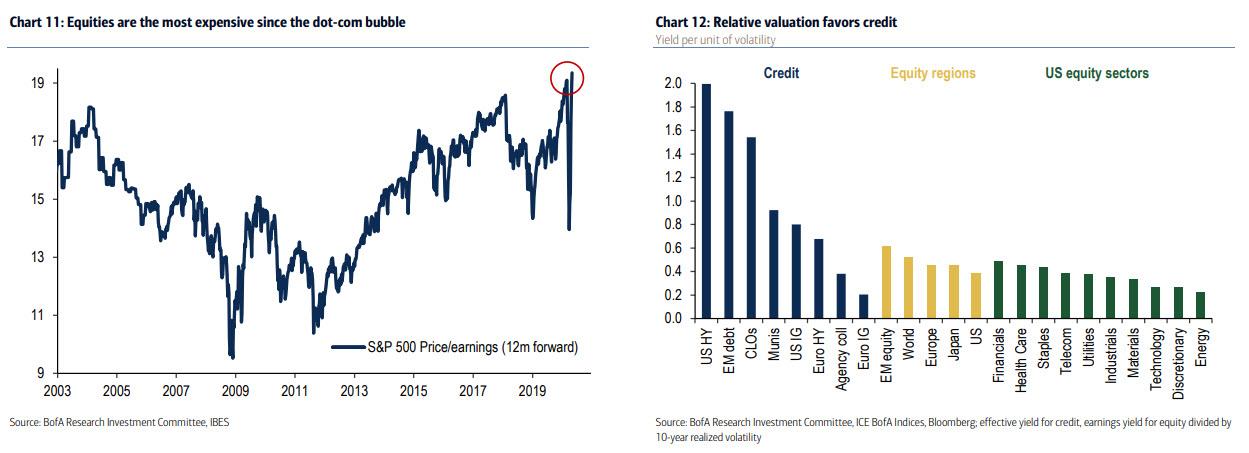
5. Stocks are expensive
- Stock prices are already back at 20-year highs relative to expected earnings (19.4x – Chart 11).
- While there has never been less competition from Treasury bonds, this is hardly the time to price equities for a perfect recovery.
- In relative value terms, most fixed income sectors offer better yield (relative to volatility) than any equity region or sector (Chart 12).
If it’s time to sell stocks, what does BofA like?
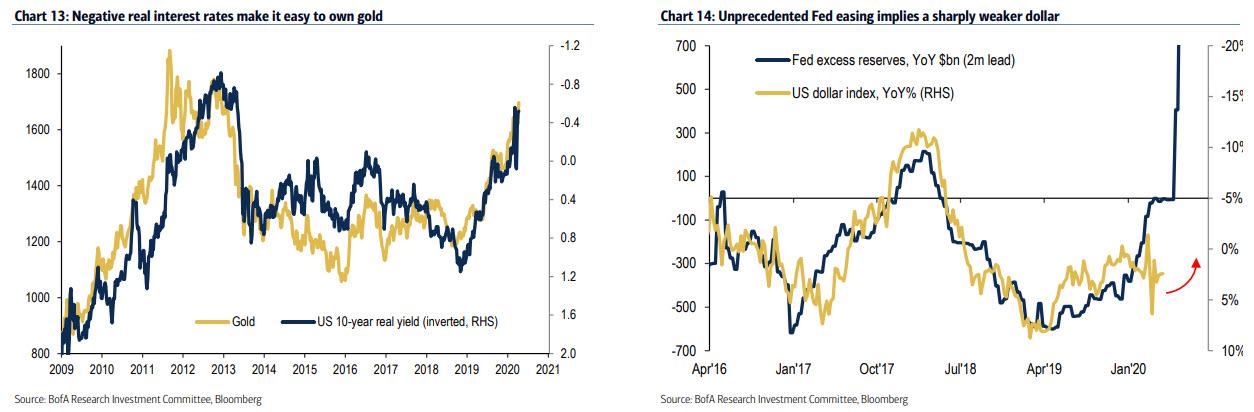
Three reasons to own gold
“Fed Can’t Print Gold”: Gold is more attractive today. Our gold price target was just raised from $2000 to $3000/oz. Three reasons to buy:
- Low rates: central banks will keep interest rates well below inflation for the foreseeable future. When the opportunity cost of shunning Treasuries is essentially zero, investors buy gold instead (Chart 13); that’s why real rates alone can explain 80% of the variation in gold prices.
- Weaker dollar: central bank balance sheet expansion implies a sharply weaker dollar…e.g. DXY below 2018 lows of 88 (Chart 14).
- Positioning is light: gold is just 10% from record highs yet institutional positions are only 0.6sd above the 20-year average (CFTC); and household allocations are even smaller…just 0.2% of private client holdings.
What happens next? While attention in the past few weeks has been diverted away from the biggest clash of civilizations in centuries, the reality is that tensions between the US and China will not go away on their own… or peacefully. Which means that absent an all out war, there are three conflicts to watch: i) the trade war; ii) the tech war, and iii) the capital war.
The Trade War
- A costly decoupling of US-China economic ties may increasingly be accepted by elites as the necessary alternative to a full-blown cold war.
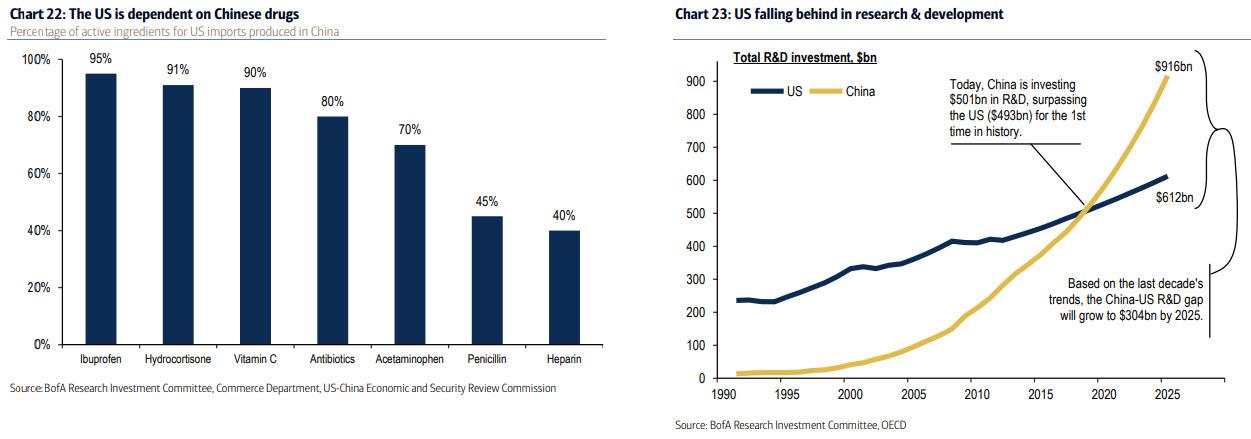
- The US has become increasingly reliant on Chinese and other foreign manufacturers for many key resources including pharmaceuticals (Chart 22), rare earths, machine tools, advanced materials, military components, casting, electrical steel, fasteners, aluminum, circuit boards, batteries, medical equipment, and much more (per US DoD).
- Just as importantly, the US has fallen behind China in research & development for the first time in history (Chart 23). R&D is one of the most important drivers of productivity and economic growth.
- The administration’s approach so far has been very popular. One poll found 83% of Americans favor a continuation or even tougher position on China (91% Republicans, 74% Democrats).
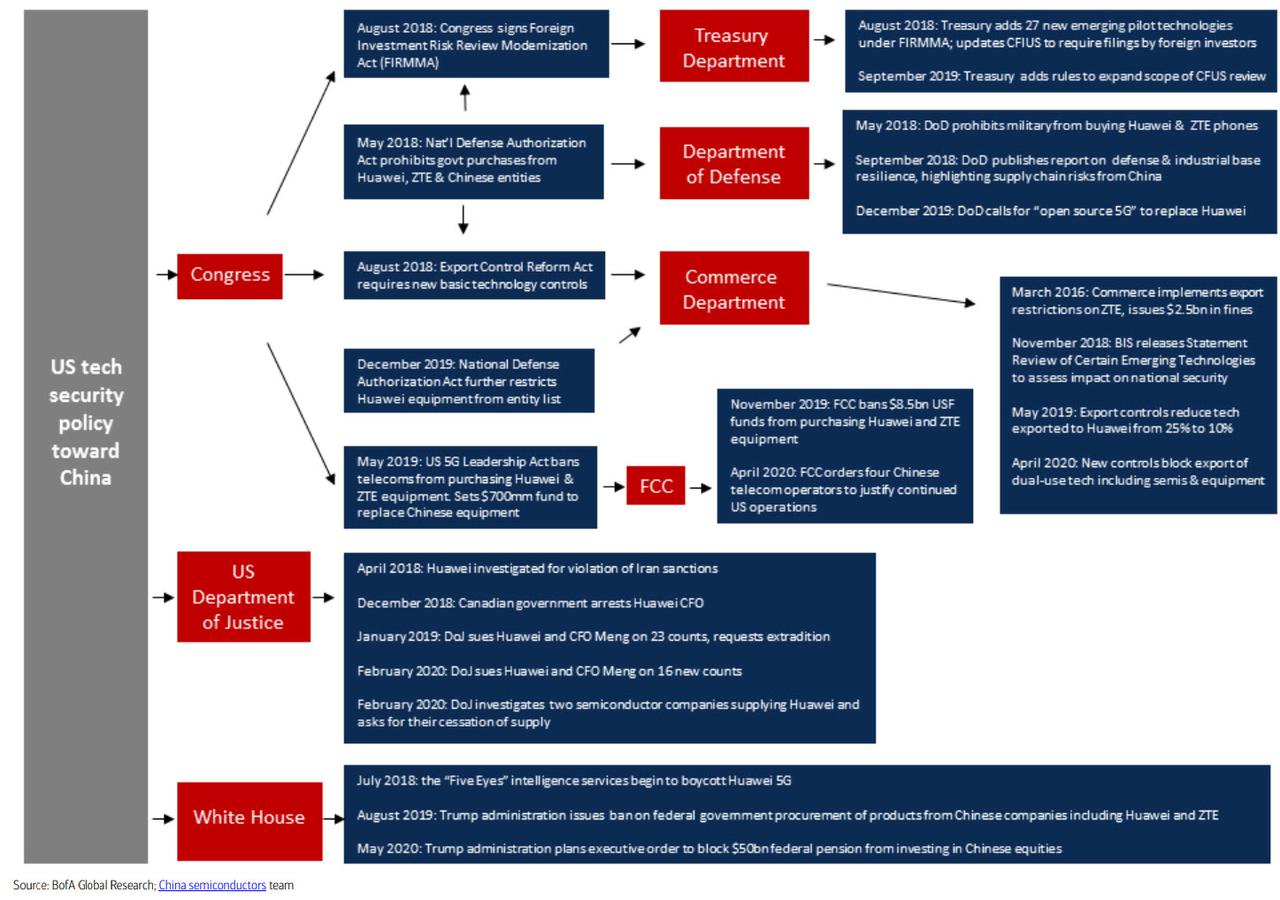
The tech war
The schematic below summarizes the tech security policy toward China
The capital war
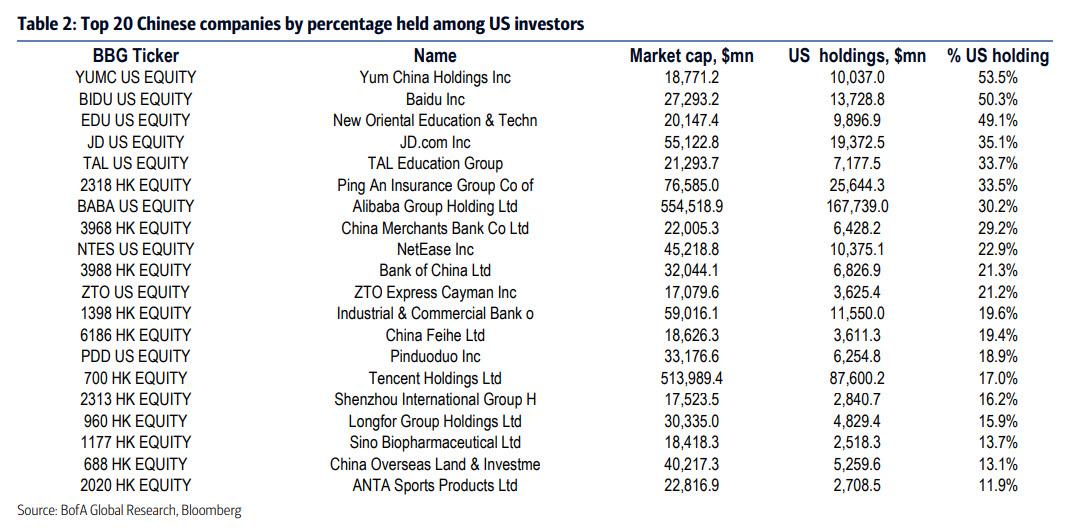
- The trade/tech war may become a capital war in which the US more power to determine the outcome. The first battle will be over delisting Chinese equities from US exchanges. US investors own nearly 10% of the 100 largest Chinese companies, with $5.4tn in market cap. (Table 2).
- In April, SEC Chairman Jay Clayton became vocal about the risks of investing in Chinese companies, which do not adhere to Sarbanes-Oxley accounting standards or give the Public Company Oversight Board audited statements. Investors burned by Sino-Forest and Luckin Coffee already understand.
- Chinese ADRs are often Cayman Islands-based “Variable Interest Entity” (VIE) legal structures, which do not provide ownership of the underlying company and do not confer voting rights. Chinese state authorities could revoke permission of these companies to distribute profits to foreign VIE shareholders.
- Capital markets are also ripe for other forms of intervention. Whether by halting IPOs, taxing foreign capital inflows, or cutting access to USD swap lines and Fed repo operations, policymakers have a range of very powerful unexercised options
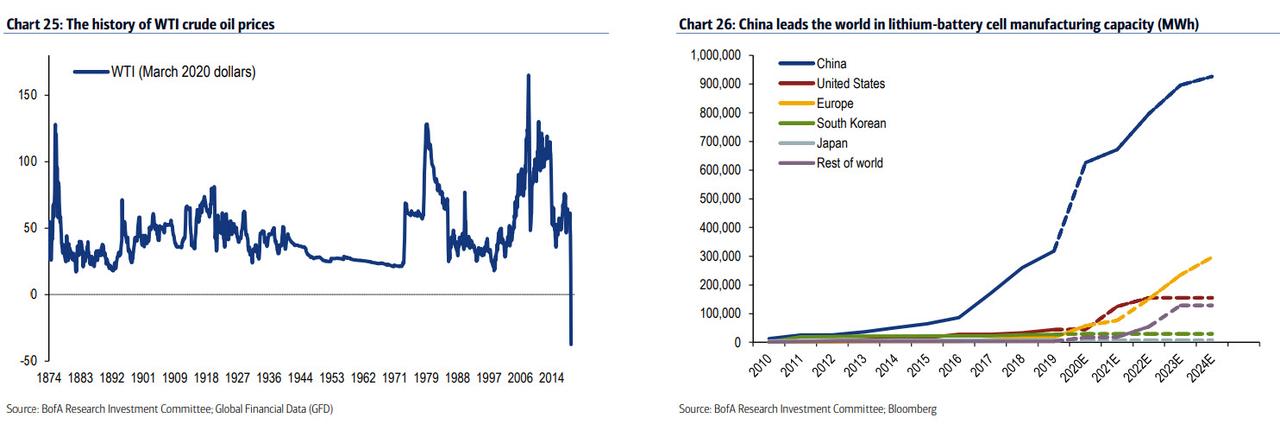
The energy war
- In 2020 WTI crude oil traded at negative prices for the first time in history.
- In 2020 China will have 626k megawatt hours of lithium ion battery cell manufacturing capacity, far surpassing capacity in the US & Europe, with the gap expected to widen sharply. (Chart 26).
Tyler Durden
Wed, 05/06/2020 – 20:25
via ZeroHedge News https://ift.tt/3dkIQY3 Tyler Durden