SPACs’ Dirty Secret: 6 Months After Deal Closure, Median Blank Check Underperforms Russell By 42%
One of the remarkable stories of 2020 and 2021, one which has sparked many comparisons to 2007 just before the credit/housing bubble popped, has been the record surge of blank-check, or SPAC, issuance where investors – at a loss what to invest in – hand their money to a marquee investor who promises to find an appropriate investment over a given period of time or refund the money. The issue with SPACs, as we quantified last year looking at the performance of the SPACs in 2007 just before the credit bubble burst, is that for all the euphoria and all the millions in fees they create for sponsors and organizers, they tend to badly underperform the broader market.
Thanks to Goldman, we now have empirical evidence that the current SPAC bubble is not performing better; in fact returns this time appear to be even more woeful than before the last bubble burst.
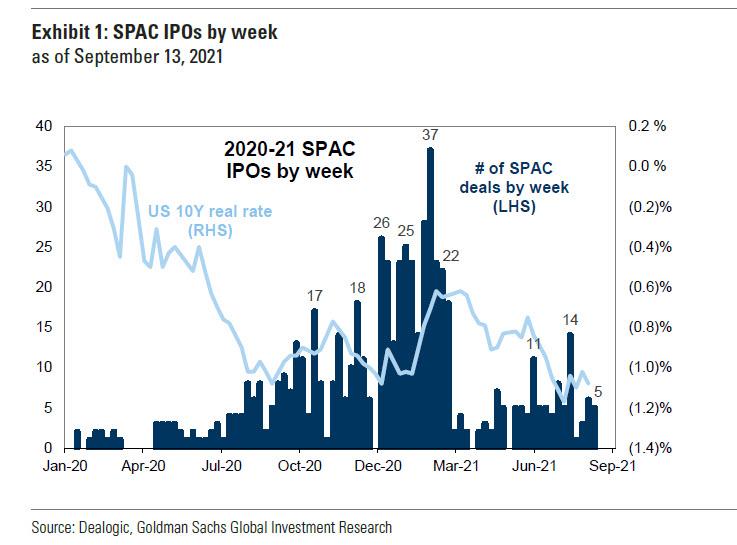
As Goldman’s David Kostin observes, SPAC issuance has accelerated recently despite continued regulatory uncertainty. While the first quarter SPAC boom saw an average of 21 SPACs each week, raising some $6 billion in capital on average, this number tumbled in Q2 to fewer than 4 SPACs IPO completed weekly as real rates rose and high growth stocks more broadly sold off. However, so far in 3Q, the SPAC bubble is trying to make a tentative return, with an average of 6 SPAC IPOs raising $1.2 billion in total capital each week as “lower real rates appear to have provided a renewed tailwind to SPAC issuance. However, regulatory and legal concerns continue to cloud the issuance outlook.”
More importantly, now that we have more than a year of SPAC activity, it allows us to quantify returns in the sector. And just as we warned one year ago, SPAC returns have been weak, especially following deal closure.
According to Goldman calculactions, since its February peak, an ETF of SPACs across stages of the lifecycle (ticker: SPAK) has returned -35% vs. +14% for the S&P 500. Other high growth and interest rate-sensitive pockets of the market (i.e., “bubble baskets”), such as long duration stocks and Non-Profitable Tech stocks have fared better but also declined.
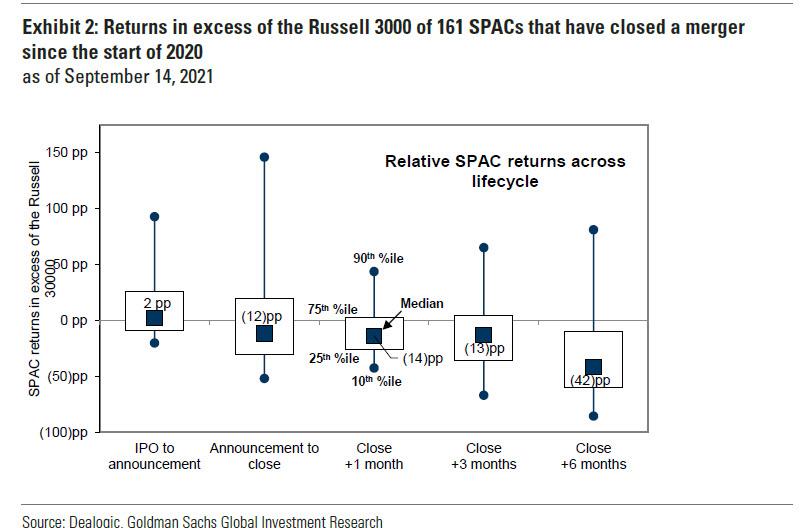
Of 172 SPACs that have closed deals since the beginning of 2020, the median has outperformed the Russell 3000 from its IPO to deal announcement. However, in the six months after deal closure, the median SPAC underperformed the Russell 3000 by 42%, which is to be expected: once the initial euphoria fades and the hype gives way to fundamentals, the SPAC emperor is exposed as having been naked all along.
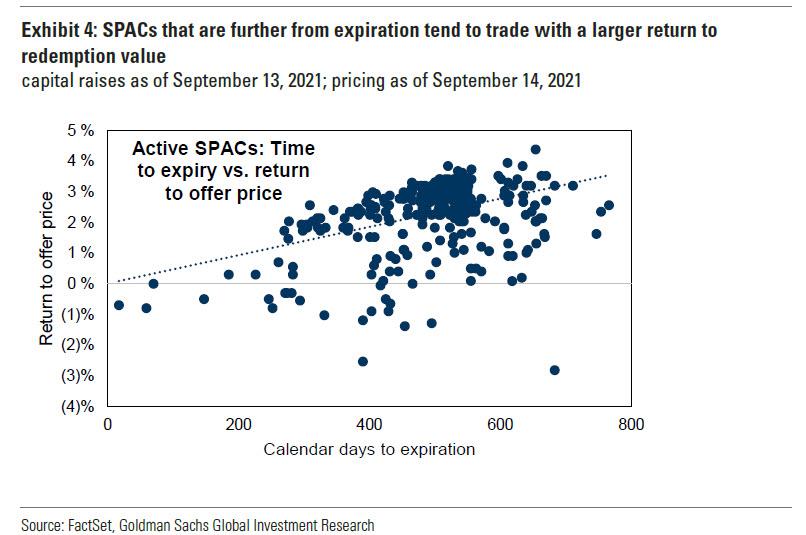
Adding insult to billionaire wealth, 93% of active SPACs now trade below their par values. The median SPAC currently seeking a target offers investors a paltry return of 2.7% if they were to hold until redemption.

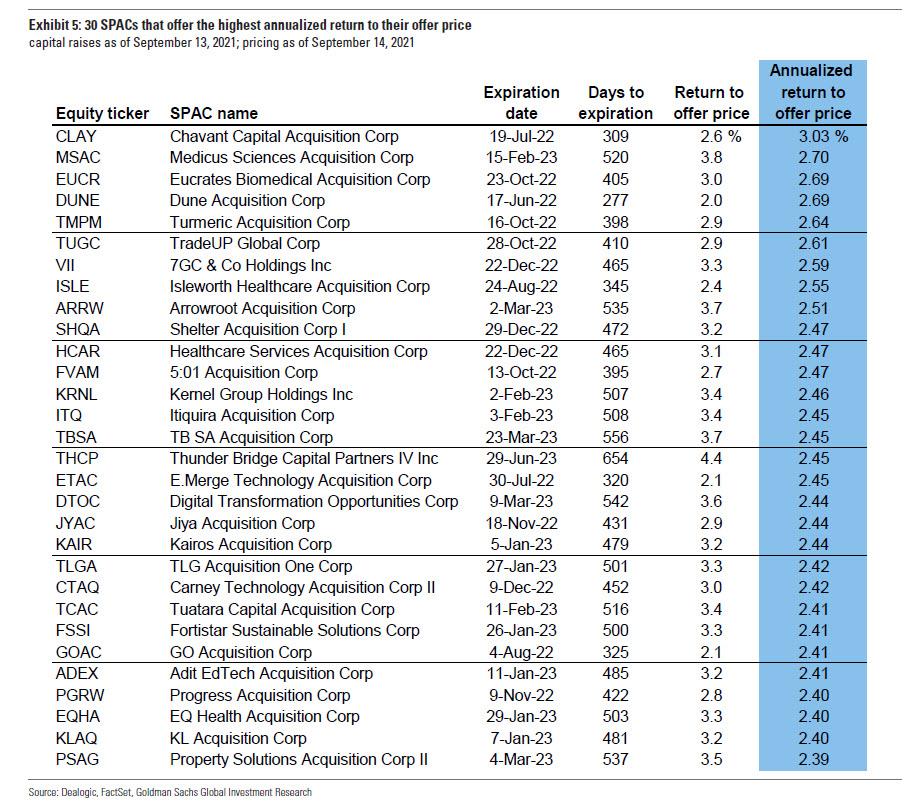
A list of the 30 SPACs that offer the highest annualized return to their offer price is shown below.
However, the median SPAC is 17 months away from its expiry date. Of the SPACs in our universe, at least 44 have had an extension of their search period approved by shareholders. The average approved extension has been 5 months.
The full Goldman report (available to professional subs) also details the 398 SPACs now seeking acquisitions with $120 billion of equity capital, the 110 SPACs that have announced mergers totaling $304 billion in EV, and 159 SPACs that closed deals since mid-2018.
Tyler Durden
Thu, 09/16/2021 – 14:20
via ZeroHedge News https://ift.tt/3hF2v9v Tyler Durden