Right in the middle of AG Barr’s testimony before the Senate Judiciary Committee and just before Fed Chairman Jerome Powell was set to begin his post FOMC-meeting press conference, CNBC dropped a headline claiming that a trade deal between the US and China may be ‘possible’ by next Friday.
Developing…
via ZeroHedge News http://bit.ly/2WjTQN9 Tyler Durden
Given the lack of change to policy and the lack of updated economic projections, today’s main event is Powell’s Press Conference…
Can Fed Chair Powell stick to his script and somehow walk the razor fine line between talking about how awesome everything is and yet feeling the need to be as uber-dovish as any Fed head since the crisis?
The market (and President Trump) certainly want moar…
Watch Live (starting at 1430ET)…
via ZeroHedge News http://bit.ly/2V8tjpx Tyler Durden
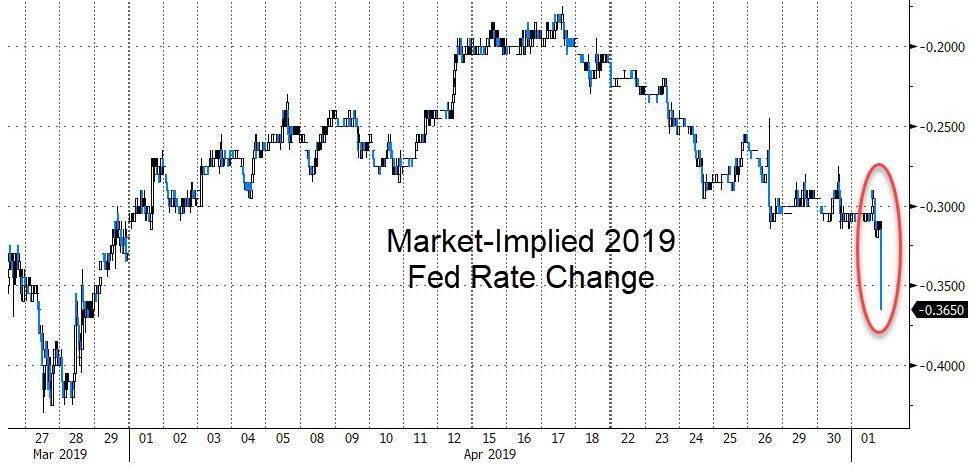
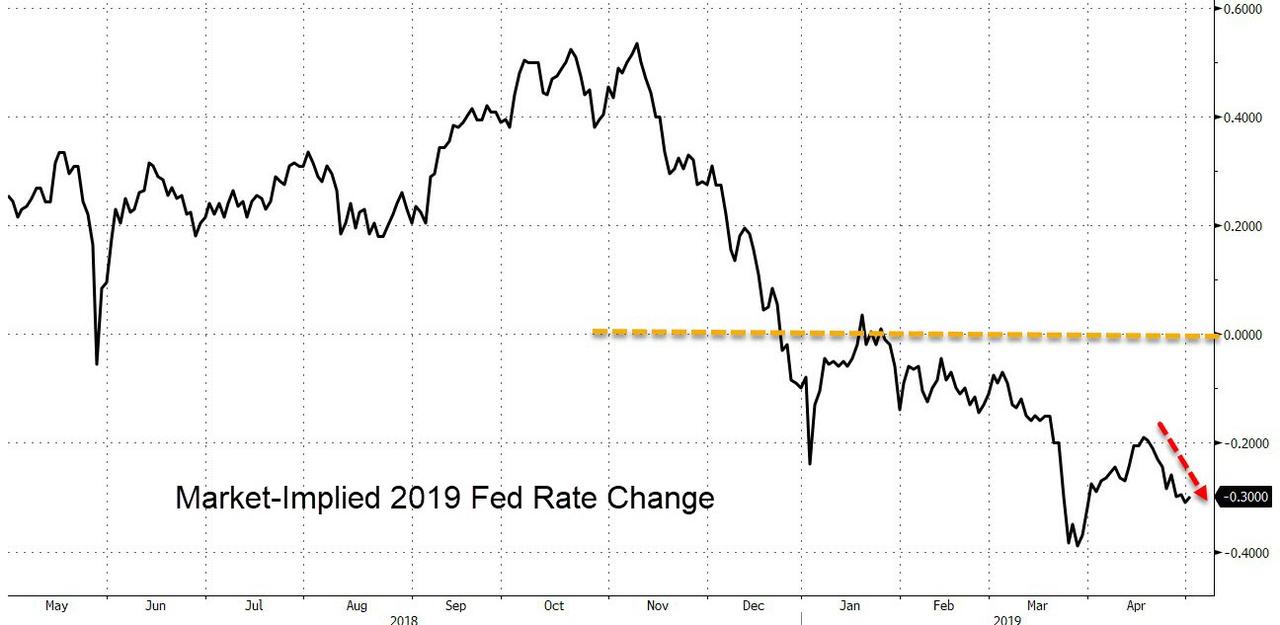
The market has instantly priced in an even more dovish Fed (now expecting 37bps of rate cuts to the end of 2019) as the IOER cut has dragged down bank stocks and bond yields broadly…
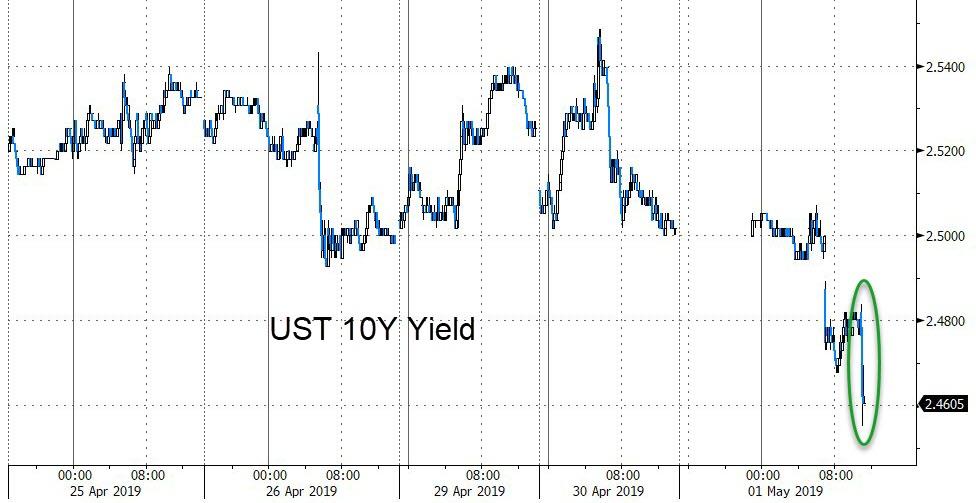
Bond yields are lower…
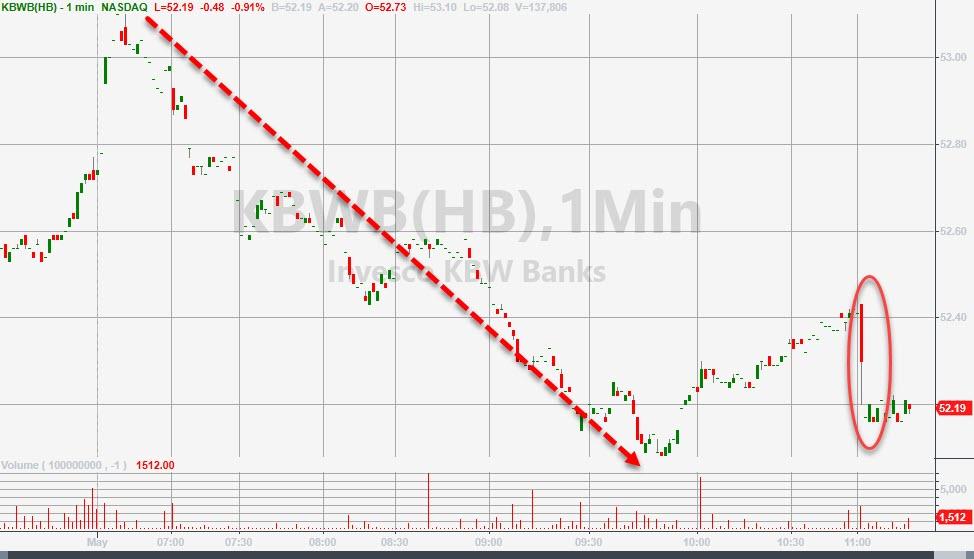
And bank stocks are sliding…
As BMO explains:
The most important development from the FOMC this afternoon was the cut of IOER to 2.35%; a drop of 5 bp while the Committee maintained the target Fed funds range of 2.25-2.50%.
The front-end of the curve is intuitively outperforming on this ‘fine-tuning’ cut and the curve, which has been grinding flatter on the day, has snapped back steeper. This also has created an outside-day steeper for the curve (very rare), which projects to at least 28 bp in 2s/10s.
To be clear, the IOER is a direct response to the relatively increasing scarcity of reserves (liquidity shortage) amid the balance sheet runoff.
via ZeroHedge News http://bit.ly/2XYxuRO Tyler Durden
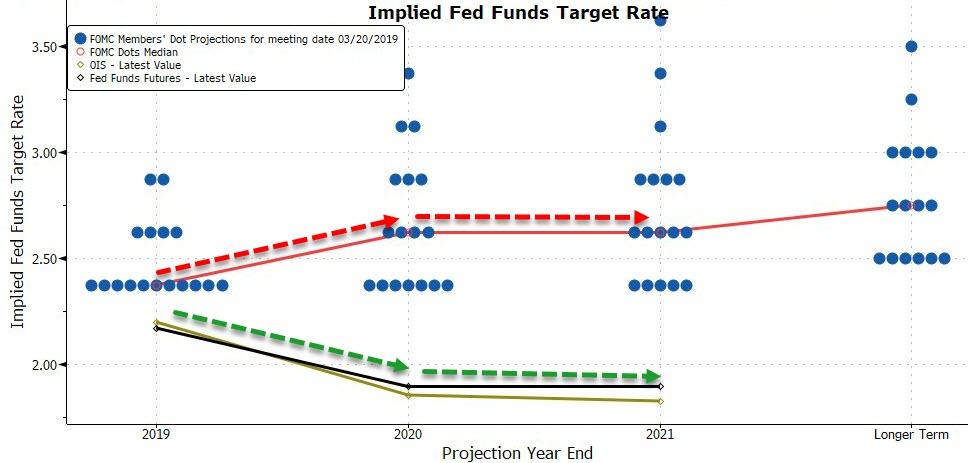
With employment and economic growth data shining even as inflation disappoints, and the gap between the market and The Fed remaining vast in terms of next actions, today’s FOMC statement (and press conference) is expected to be as ‘patient’ as possible with Powell desperately sticking to his script.
The market is pricing in 32bps of rate cuts for 2019 and more for 2020…
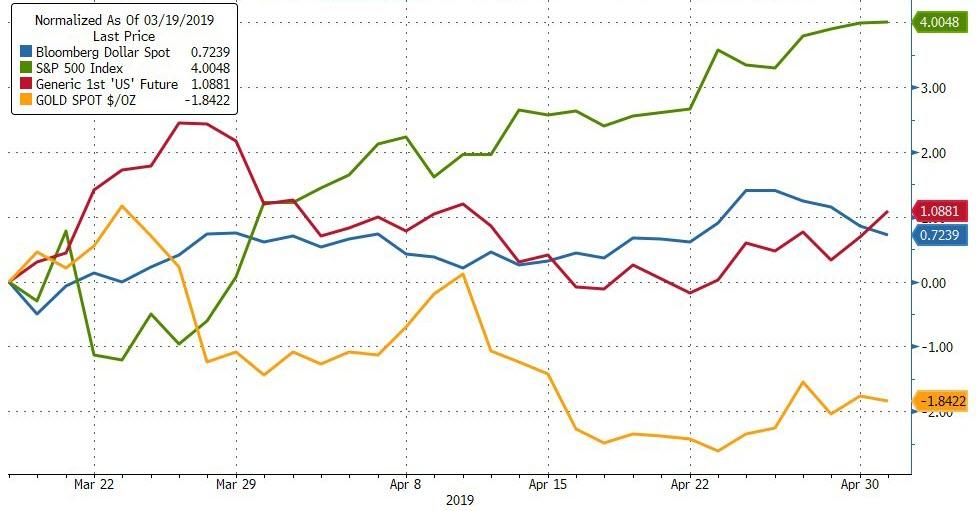
Since the last FOMC meeting (March 20th) confirmed The Fed’s dovish tilt, stocks have soared, gold has dropped, and the dollar and bonds have gained modestly…
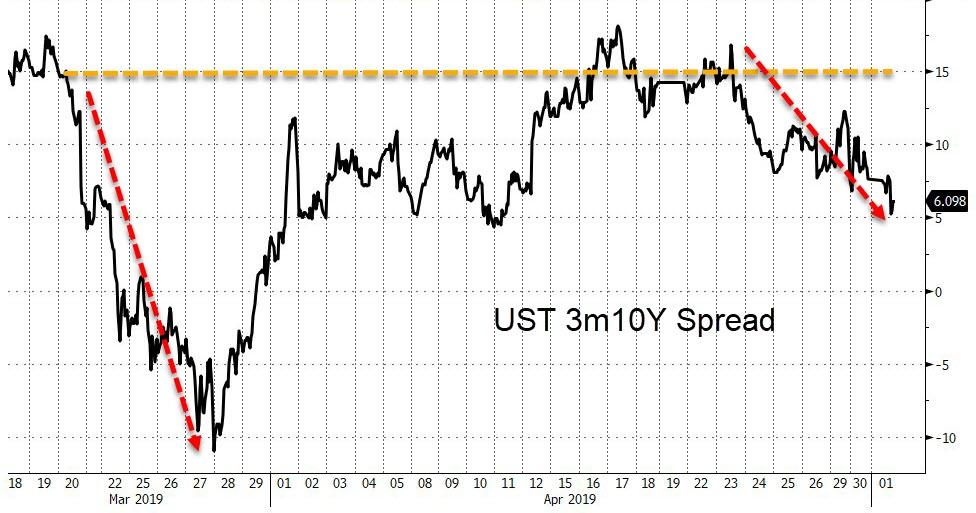
At the same time, the yield curve has flattened notably…
And today is expected to confirm no change whatsoever, and no new economic projections, the main event will likely be Powell’s press conference.
Here are Bloomberg’s Key Takeaways from the FOMC decision:
For third straight meeting, the Fed leaves federal funds target range unchanged at 2.25 percent to 2.5 percent, as forecast; it repeats language pledging to be “patient” on rate changes amid global economic and financial developments, muted inflation pressures.
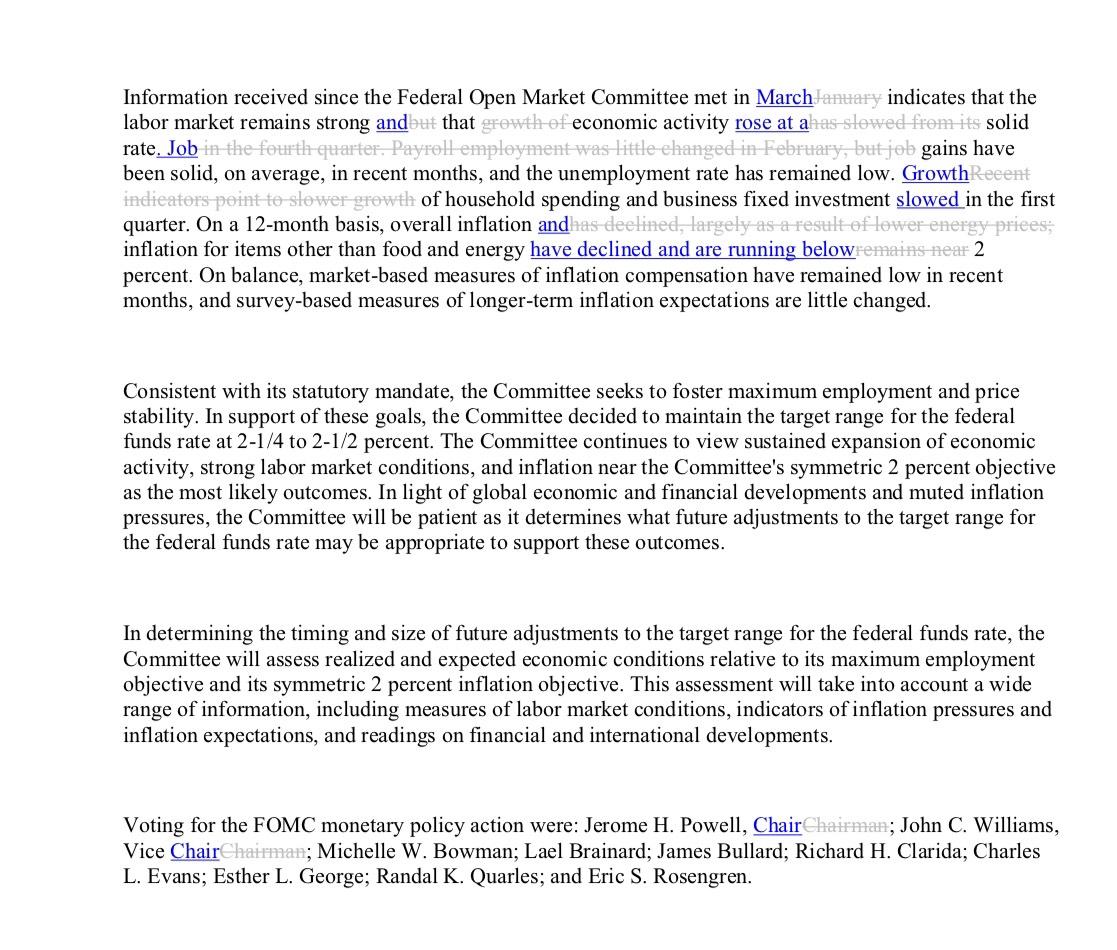
The FOMC adjusts its language on the economy, characterizing economic growth and job gains as “solid” while saying consumer spending, business investment slowed in the first quarter; the Fed acknowledges both overall and core inflation have declined and are running below 2 percent.
The statement shows central bank still reluctant to signal a policy bias in either direction, despite Trump’s call for an interest-rate cut — something projected by financial markets.
The decision is unanimous at 10-0; there have been no FOMC dissents since Powell became chairman in February 2018.
No comment whatsoever on markets or valuations amid this asymmetrical dovish bias.
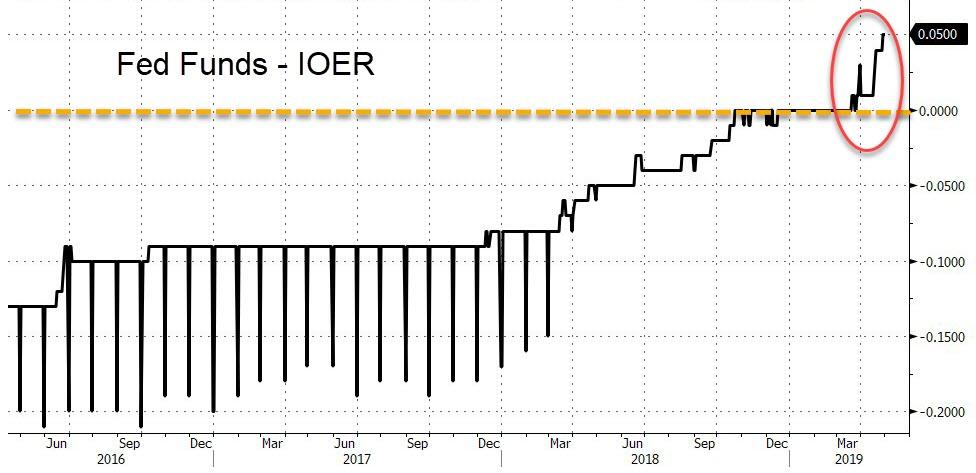
Most notably with Fed funds are trading above interest on excess reserves, The Fed cut IOER by 5bps to 2.35% hoping to push banks to lend rather than parking cash at the central bank.
This is the third time in a year that the Fed has adjusted the gap between IOER and fed funds; the Fed cites a desire to foster trading in federal funds “well within the FOMC’s target range.”
To be clear, the IOER cut tends to imply the relative increasing scarcity of reserves amid the balance sheet runoff.
Bespoke Investment Group macro strategist George Pearkes weighs in:
Focus will be on the change in tone around inflation language and “slowed” first quarter numbers but to me that seems to be a justification for the “patience” rather than a forecast given multiple FOMC members have commented on upside data surprise ahead of the blackout.
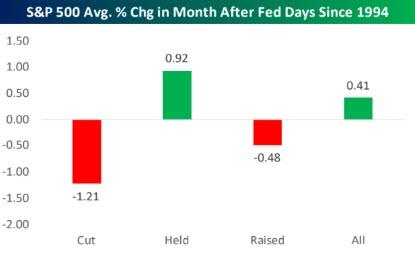
As Bloomberg notes, a Fed hold could be music to the stock market’s ears. Bespoke Investment Group notes that the S&P 500 Index’s forward one-month returns after Fed meetings since 1994 have been best when the central bank has stood pat.
* * *
Redline below…
Which looks a lot like Goldman’s…
via ZeroHedge News http://bit.ly/2LuXX8n Tyler Durden
“Richard was an active trader and analyst in the early 1900s, his career coincided with other Wall Street greats including Jesse Livermore, Charles Dow and JP Morgan. Many have called this the “golden age of technical analysis.”
“Richard Wyckoff began his Wall Street career in 1888 as a runner, scurrying back and forth between firms carrying documents. As with Jesse Livermore in the bucket shops, Wyckoff learned to trade by watching the action firsthand. His first trade occurred in 1897, when he bought one share of St. Louis & San Francisco common stock. After successfully trading his own account several years, he opened a brokerage house and started publishing research in 1909. The Magazine of Wall Street was one of the first, and most successful, newsletters of the time. As his stature grew, Wyckoff published two books on his methodology: Studies in Tape Reading (1910) and How I Trade and Invest in Stocks and Bonds (1924).”
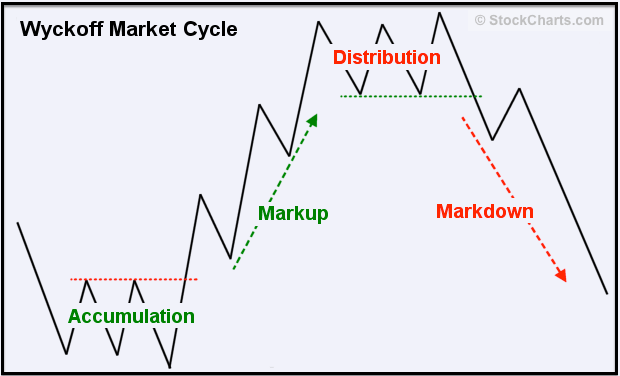
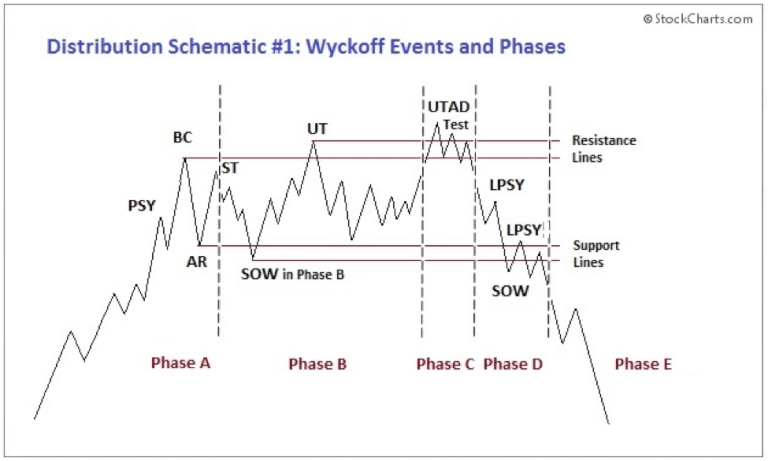
Why may market participants of today want to listen to Richard Wyckoff? Because he developed this market cycle pattern:
A period of accumulation/consolidation a massive mark-up run, then a bunch of back and forth called distribution, and then note the final new high at the end there, followed by a reversal markdown process that reverses it all.
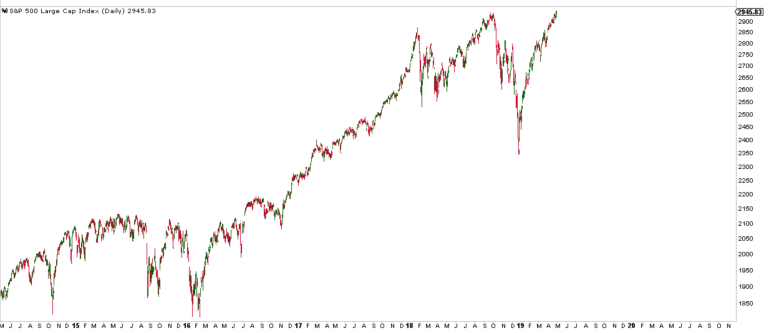
Does this structure look at all familiar to you? If not, it really should:
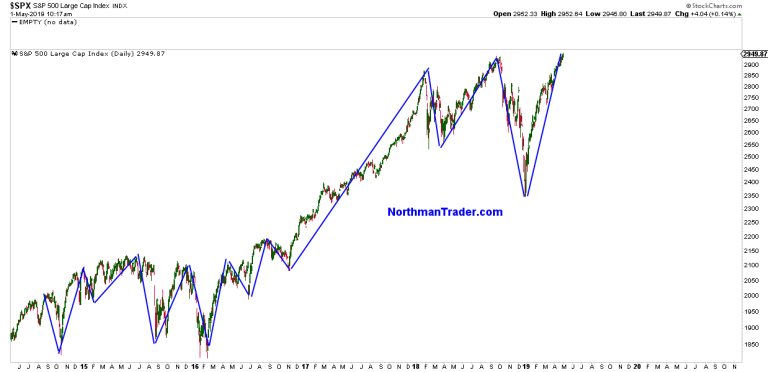
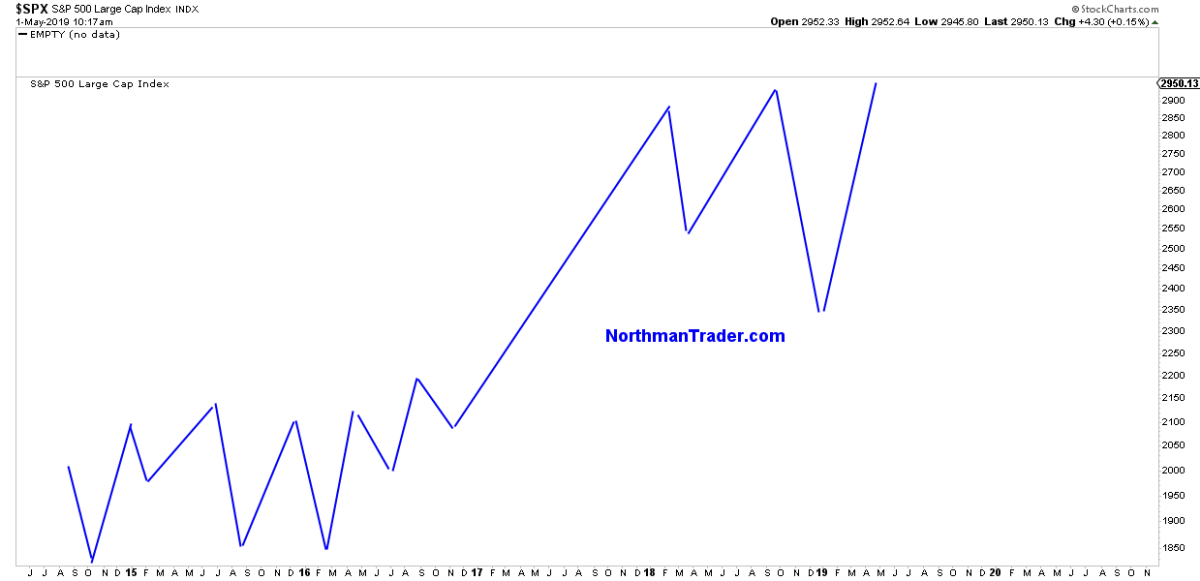
Let me overlay lines outlining the larger moves of the past few years onto the chart and you get this:
Remove price and you get this structure:
Now compare this to Wyckoff’s market cycle structure:
Are there some differences? Sure there are, smaller deviations have to be allowed for, the key is the larger structure and it fits the larger $SPX structure quite closely.
The structure suggests that the 2014-2016 time frame was the accumulation phase, the run between 2016 into early 2018 was the mark-up phase and the period since January 2018 has been the distribution phase.
If the pattern is applicable it suggests with current new highs we’re in phase C, the UTAD (upthrust after distribution) test.
The definition:
“Upthrust after Distribution. This last gasp rally from support occurs occasionally, and will drive the stock price above resistance and the prior price peaks in the distribution trading range. Price rallies with conviction and often has big leaping bars and volume. Once at new highs, price can stay above the resistance area for days to weeks. The conviction of this rally and breakout will attract a following of buyers. After a series of tests, price begins to sink back below the prior peaks and in short order is heading back to the Support area. After a UTAD, price becomes persistently weak to and through support and into a confirmed downtrend”.
Key takeaways:
Phase C is much shorter compared to the previous phases and any new highs will not sustain suggesting that prices above the September 2018 highs are ultimately a selling opportunity.
This process of new highs could be short lived, a matter of days or it could drag out for weeks perhaps even months, but any price advances from here would be limited.
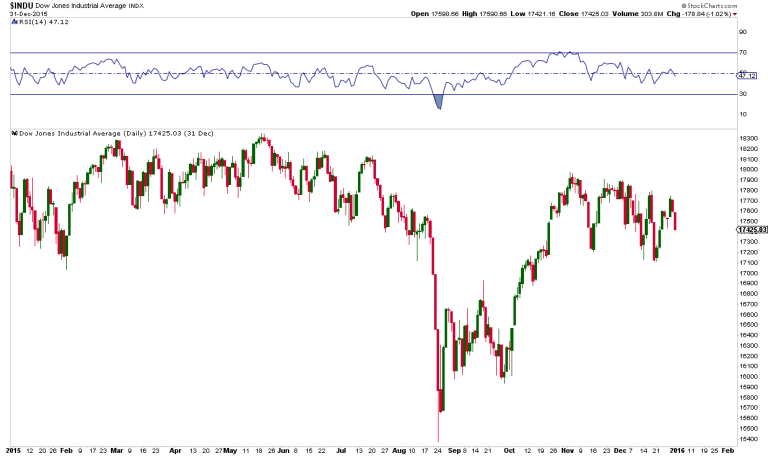
For reference I offer 2015. Prices peaked early in May, frustrated for 3 months and then dropped fast:
But the Wyckoff pattern is suggestive of something more sustained than a quick August 2015 move to come. Rather is suggests not only new lows versus December it suggests an ultimate move back to the accumulation price range meaning back to the 2015 highs or around 2100-2150 $SPX.
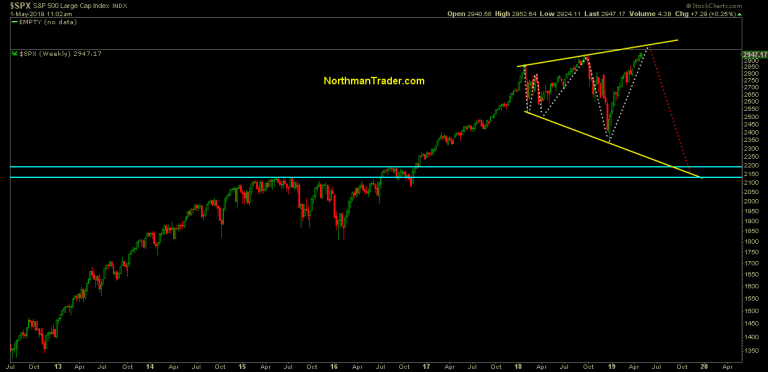
What’s the upside risk to stocks here and still fit the pattern? Ironically the price risk range I outlined with the broadening top pattern in Combustion:
Wyckoff’s pattern however does not require for the upper trend line in the chart above to be reached. It can reverse at any time, but strongly suggests some back and forth probing and testing at new highs first before a confirmed breakdown.
The main message of the pattern goes to the question of sustainability of new highs which I recently discussed in my most recent video analysis:
How will we know if the pattern applies to our markets today?
When we see evidence that the break above the September 2018 highs on $SPX does not sustain and price falls back below the 2940 area and then fails to regain it. Then the pattern suggests that the 2019 gains will not only be given back, but that new lows are to come. A price destination that the broadening top pattern is also suggesting.
Until then: Party hardy at your own risk. But remember: “Those who cannot remember the past are condemned to repeat it.” – George Santayana
* * *
For the latest public analysis please visit NorthmanTrader. To subscribe to our market products please visit Services.
via ZeroHedge News http://bit.ly/2VCpYyu Tyler Durden
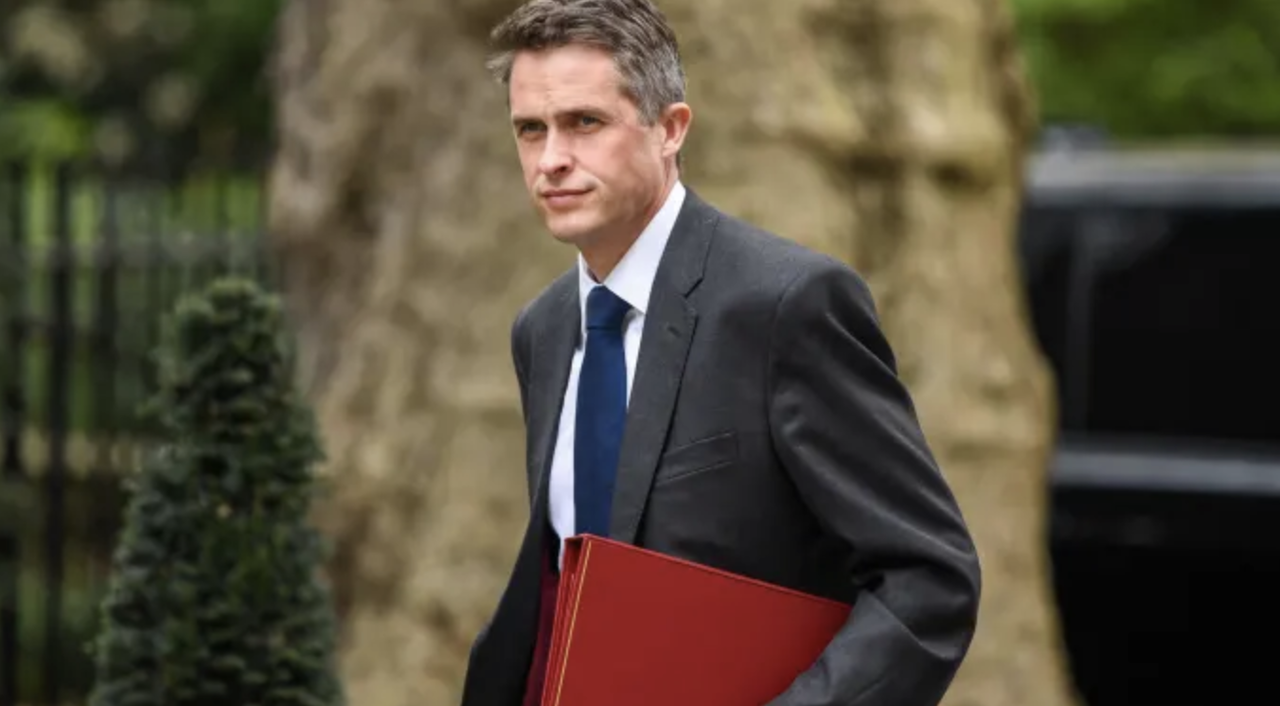
No. 10 has finished its investigation into the source of an embarrassing leak about a National Security Council vote to allow Huawei to help build out the UK’s 5G infrastructure despite Washington’s warnings and even some misgivings within the UK government itself.
As a result, the PM has decided to sack Defense Secretary Gavin Williamson, presumably because he was the source of the leak.
In a statement, May thanked Williamson for his service, but said his conduct relating to an “unauthorized disclosure” out of the NSC.
The leak, which surfaced last week, prompted No. 10 to launch a diligent investigation. All cabinet members who attended the meeting were asked to deny being the source of the leak by Whitehall’s most powerful official, Cabinet secretary Sir Mark Sedwil, who was tasked with leading the investigation.
“The prime minister has this evening asked Gavin Williamson to leave the Government, having lost confidence in his ability to serve in the role of Defence Secretary and as a member of her Cabinet,” a Downing Street spokesman said. “The prime minister’s decision has been informed by his conduct surrounding an investigation into the circumstances of the unauthorised disclosure of information from a meeting of the National Security Council. The prime minister thanks all members of the National Security Council for their full co-operation and candour during the investigation and considers the matter closed.”
No. 10 confirmed almost immediately that Williamson would be replaced at the MoD by international development secretary Penny Mordaunt, who will become the UK’s first female secretary of defense…offering a welcome break from the interminable coverage of May’s disastrous negotiations with Labour, and the mounting internal rebellion against her rule.
Williamson was hardly a prominent figure in May’s cabinet, and his departure prompted the Twitter wits to crack a few jokes.
I’ve always thought Gavin Williamson looked like an accident Huawei-ting to happen. #HuaweiLeak
— British Politics teacher (@Mike__Towers) May 1, 2019
via ZeroHedge News http://bit.ly/2LiBzin Tyler Durden
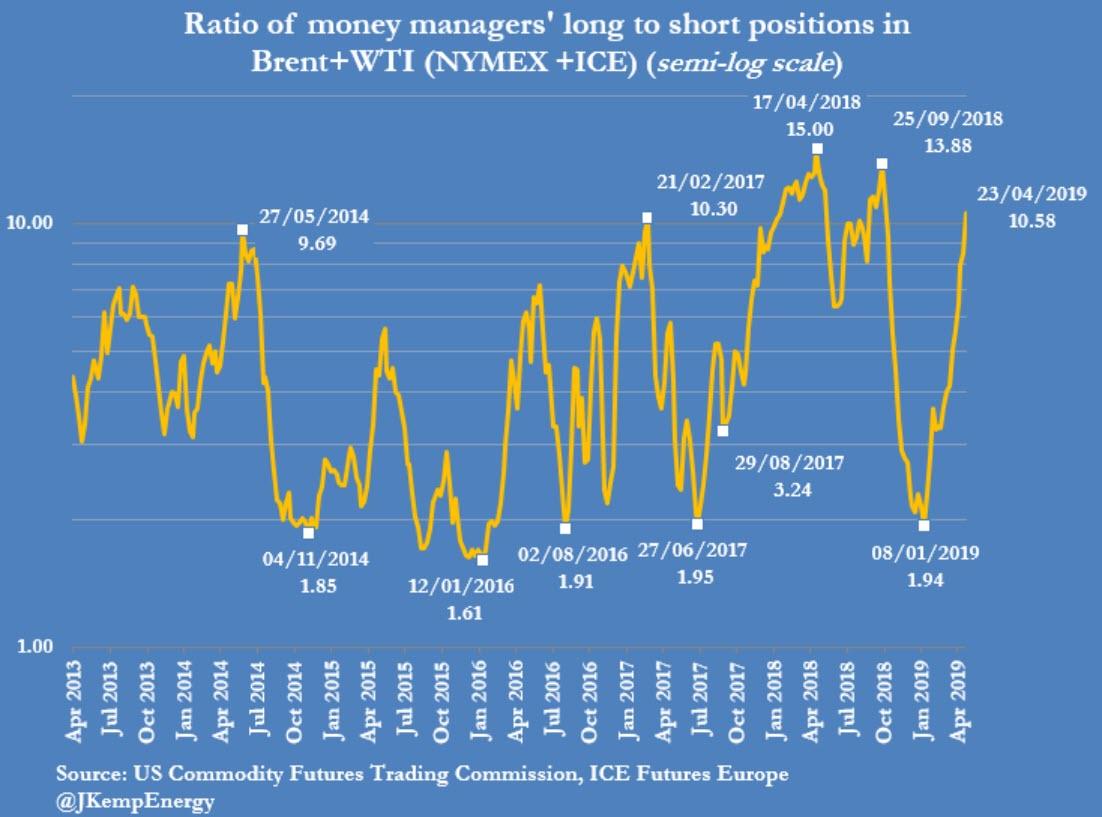
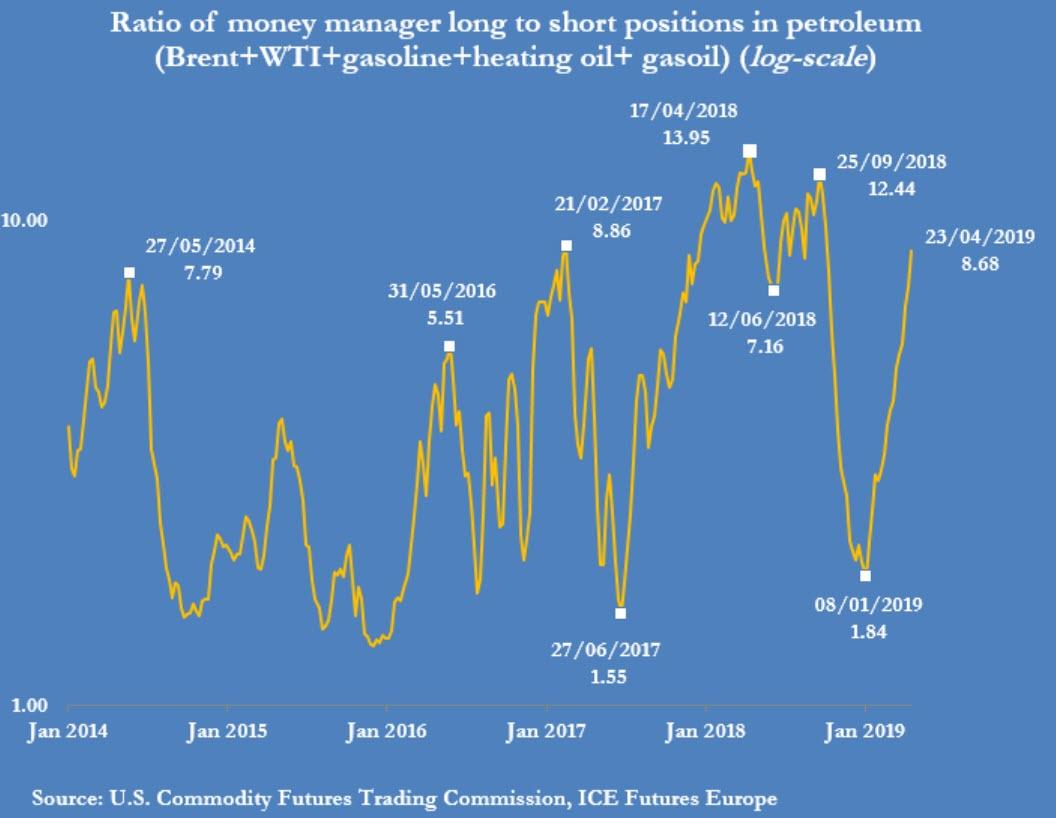
For more than ten weeks, portfolio managers have been consistently amassing bullish bets in the most important petroleum futures contracts, as market fundamentals were pointing to OPEC over-delivering on the production cuts, Venezuela’s supply crashing, and potential losses from conflict-torn Libya, amid resilient global oil demand growth.
Last week, oil prices jumped on Monday on the news that the U.S. is ending the sanction waivers for all Iranian oil buyers. And hedge funds continued to bet on higher prices and a tightening oil market.
However, the net long position – the difference between bullish and bearish bets – in WTI and Brent begins to look too stretched to the bullish side, making oil prices vulnerable to declines now if (or rather, when) money managers decide to do some profit taking and liquidate some of their bets on rising oil prices, analysts say.
According to data compiled by Reuters market analyst John Kemp, as of April 23, the latest available exchange data, hedge fund and other money managers held long positions in Brent Crude and WTI Crude that outnumbered shorts in a ratio of 11:1—the most lopsided bullish positioning since October 2018, when oil prices started crashing to lose 40 percent until the end of 2018.
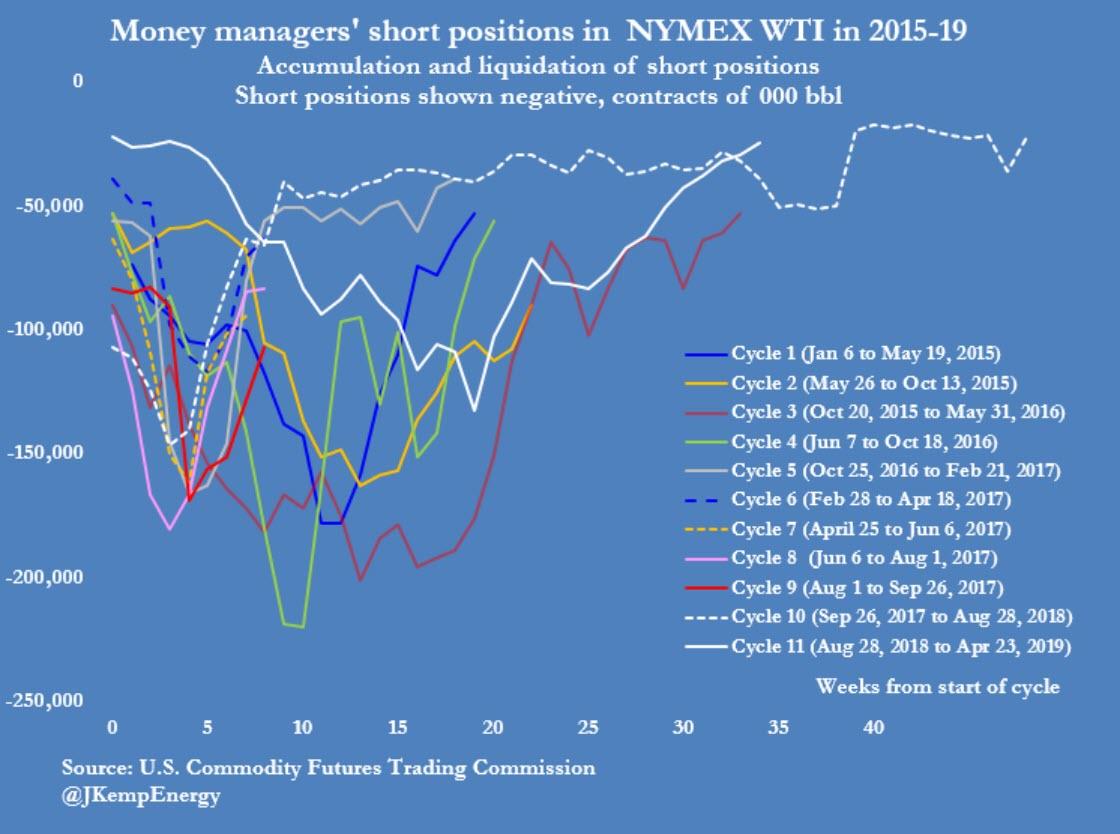
Portfolio managers have now closed out nearly all short positions that they had started to open at the end of August last year, Kemp says.
Hedge funds have been continuously amassing bets on rising WTI Crude prices for the past nine weeks, the longest bullish-building trading sentiment since 2006, according to data from the U.S. Commodity Futures Trading Commission compiled by Bloomberg.
The number of long positions in WTI Crude increased by 1.7 percent in the week to April 23, while the number of short positions slumped by 18 percent.
Money managers continue to bet that the market will further tighten, leading to higher prices, but this now overstretched bullishness is setting the scene for a pause in the oil rally, according to analysts.
“There’s been a lot of hedge fund buying, a lot of speculative interest, and we probably need to hit the pause button for now,” Phil Flynn, a senior market analyst with Price Futures Group, told Bloomberg on Monday.
Oil prices already hit the pause button, after jumping to six-month highs at the start of last week when the U.S. took the market by surprise announcing the end to all Iranian sanction waivers.
On Friday, oil prices tanked nearly 3 percent as U.S. President Donald Trump said that he “called up” OPEC and told the cartel that they have to bring gasoline prices down.
“Spoke to Saudi Arabia and others about increasing oil flow. All are in agreement,” President Trump tweeted later on Friday, but neither Saudi Arabia nor anyone else at OPEC appears to have spoken to the U.S. president.
While the U.S. and President Trump seem convinced that Saudi Arabia and other OPEC members will, once again, respond to Trump’s call to “increase oil flow,” the Saudis have been careful in statements about potential future production increases. Unlike last year, the Kingdom will not rush into pre-emptive increase in production unless it sees the actual number of barrels off the market, according to Saudi Energy Minister Khalid al-Falih.
“We are of the view that Saudi Arabia will increase output as soon as May, something they were likely to do anyway in the lead up to summer,” Warren Patterson, Head of Commodities Strategy at ING, said on Monday.
But even if the Kingdom were to raise its production by 500,000 bpd, it would still be complying with the OPEC+ pact because it has been over-complying with its share of the cuts by that amount.
“In the past when the President tweeted about oil, OPEC and its oil cutting co-conspirator Russia dutifully raised output. They won’t do it again. Already they are saying in comments that before they raise output, they want to see a shortage of oil, increased demand or signs that Iranian barrels are coming off. I don’t think the phantom OPEC phone call, or a tweet is going to change that,” Flynn wrote on Monday.
Further reduction of Iranian oil supply, on top of the U.S. sanctions on Venezuela and fears of a supply outage in Libya, where rivaling armies fight for the capital Tripoli, continue to lend support to oil prices. But the already crowded bullish positions of the hedge funds are bearish for oil prices.
via ZeroHedge News http://bit.ly/2J7PcxV Tyler Durden
In just over an hour, the FOMC will leave its rates unchanged.
As RanSquawk notes, the Fed will not publish new economic projections at this meeting (the next SEP is released in June), although the market will be closely watching whether the Fed outlines conditions that might compel the Committee to discuss lowering rates. There are some risks that the Fed might tweak its statement to reflect stronger growth and softer inflation since the last meeting, although the market has already priced in a “goldilocks” environment.
There is also a small possibility the Fed could lower its IOER rate, which has been trading 4 basis points below the Effective Fed Funds rate and is in need of adjustment. Overall, the Committee’s tone is likely to remain one of patience and data dependence.
And that is what Goldman Sachs expects also, noting that with patience the watchword for now, the FOMC will keep the target range for the policy rate unchanged at 2.25-2.5% at its May meeting next week.
We see only a one-third chance of an adjustment to IOER if fed funds stays at 2.44%, though the odds would rise if fed funds ticks higher. Markets are likely to look further ahead, listening for clues about both the possibility of rate cuts if inflation declines further or growth falters, and the latest developments in the Fed’s framework debate in advance of the Chicago conference on June 4-5.
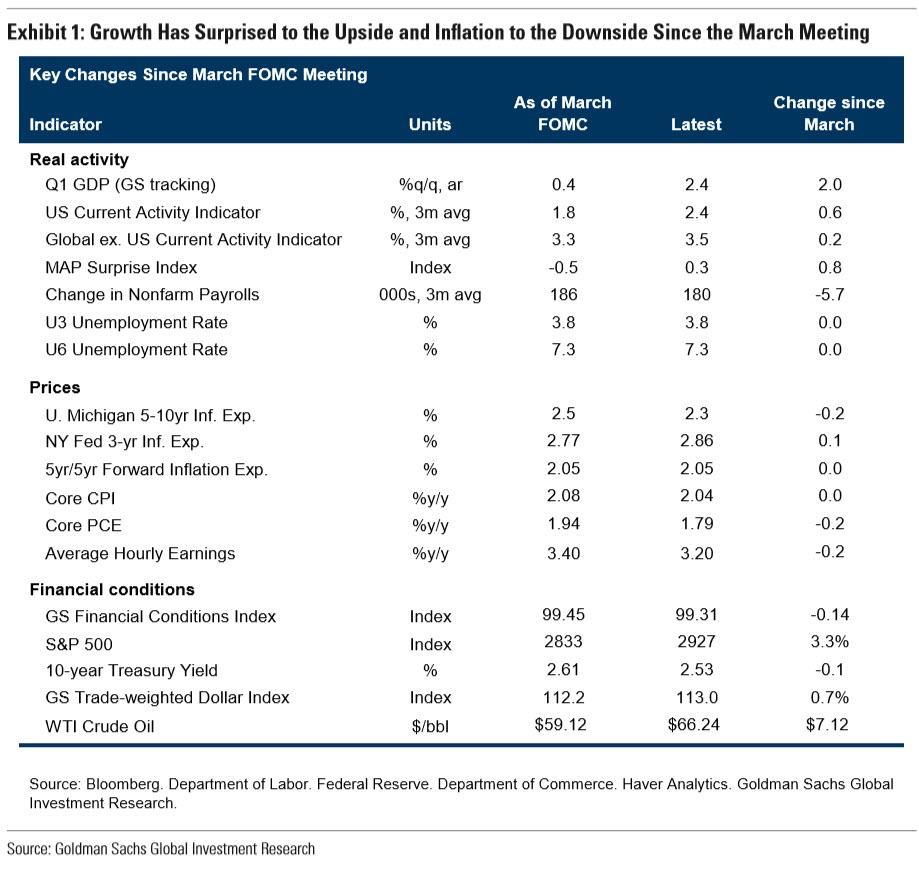
Since the Fed last met in March, the growth picture has improved but inflation has fallen short of expectations. Exhibit 1 summarizes changes in the economic and financial data since March 20.
Our Q1 GDP tracking estimate has risen 2pp to 2.4%, reflecting the positive surprises over the last month captured by the large improvement in our MAP index. The outlook for the rest of the year has also continued to brighten as our financial conditions index eased further.
In contrast, core PCE inflation has declined from 1.94% to 1.79%, and we expect it to decline further to 1.64% in the March report to be released next Monday, a 0.3pp drop from the rate at the last meeting. The University of Michigan survey measure of longer-run inflation expectations also fell 0.2pp over the last month.
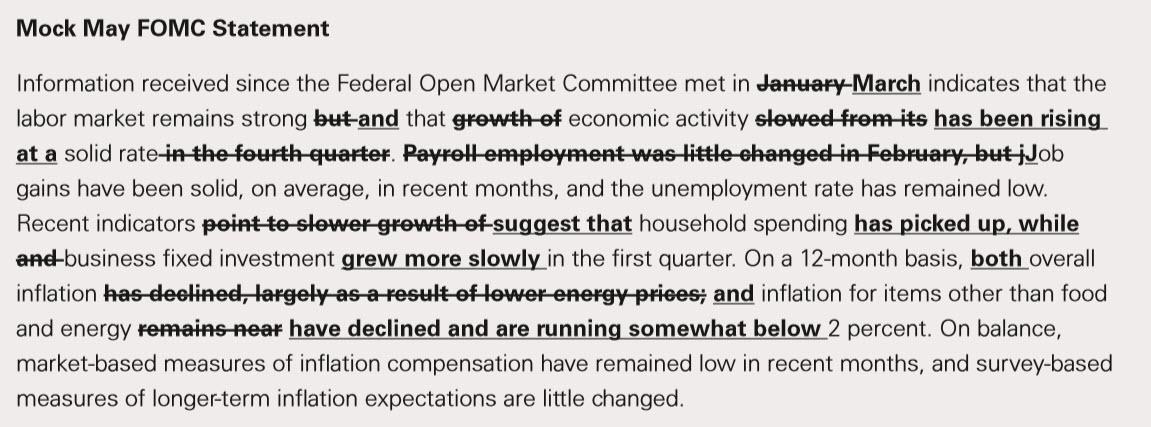
The May FOMC statement will likely reflect the better growth and softer inflation data. We expect the statement to characterize both growth and job creation as “solid” and acknowledge the rebound in retail sales by noting that household spending “has picked up.” Headline and core PCE inflation have both declined to a level below 2% since the last meeting, and we expect the statement to acknowledge this. The box below shows the revisions we expect to the first paragraph of the statement.
One possible dovish surprise to our expectations is a downgrade to the description of survey-based measures of longer-term inflation expectations in acknowledgement of the decline in the Michigan survey to 2.3%, assuming it holds in the final print on Friday. As we noted in our latest FOMC Chatterbox, a number of Fed officials have recently expressed concern about inflation expectations drifting lower. A downgrade is not our base case, however, because the Committee looks at a range of survey measures and the other three noted in the March minutes—from the Blue Chip survey, the Survey of Primary Dealers, and the Survey of Market Participants—have been roughly stable.
We do not expect any changes beyond the opening paragraph. While downside risks have abated, we do not think the Committee is ready to revisit its intention to remain “patient” yet.
Market participants will listen for clues about longer-run issues in Chairman Powell’s press conference. On some issues currently in focus in financial markets—in particular the eventual target composition of the Fed’s balance sheet and the possibility of adding a repo facility—we think it is premature to expect new information. Two other key issues—the threshold for rate cuts and the latest thinking in the Fed’s framework debate—are likely to come up during the press conference.
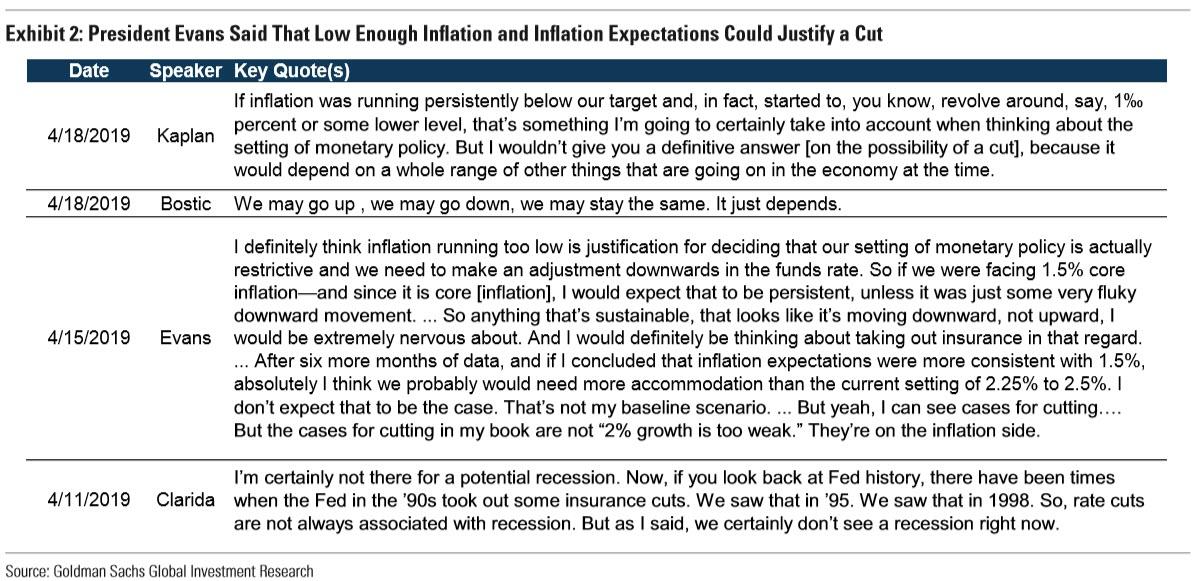
The first issue, a possible “recalibration” rate cut, has received growing attention following recent comments from Fed officials. Most notably, Chicago Fed President Charles Evans said that if core inflation fell sustainably to 1.5% and if he thought inflation expectations were more consistent with 1.5% inflation, he would think about “taking out insurance” by cutting rates. Chairman Powell will likely be asked about such a scenario, and while he will probably be less specific than Evans, he might agree that in principle a sufficiently low level of inflation and inflation expectations could justify a cut.
Our view remains that the next move is more likely to be a hike than a cut, with the next rate increase coming after the election in 2020Q4, followed by another hike in 2021. We continue to see a recalibration cut as unlikely for several reasons.
First, we expect core inflation to bottom out in March at 1.64%, above the threshold Evans cited. Base effects should provide a further bounce in August, so that any dip below 1.5% in coming months would likely prove short-lived.
Second, Fed officials would likely worry about the risks that a rate cut could appear political or unnerve markets, which might mistake a cut in response to low inflation for serious concern about the growth outlook.
Third, we suspect a cut in response to modestly lower spot inflation would be quite divisive on the Committee. Without a meaningful further decline in inflation expectations, many participants would likely object.
Additionally, the Fed’s framework review, is also increasingly in focus with the Chicago conference on the subject on June 4-5 approaching. Our best guess remains that the review will end in the adoption of a fuzzy version of average inflation targeting. We expect any comments from Chair Powell to lean in that direction while also giving some attention to “makeup” policies, namely price level targeting.
via ZeroHedge News http://bit.ly/2ISLlFF Tyler Durden
While it is common knowledge that the US budget deficit is soaring even though the US economy is allegedly growing at a brisk, mid-2% pace, resulting in recurring bond trader nightmares about funding the growing twin US deficits (Budget and Current Account), what few people know is the increasingly ominous composition of this budget deficit.
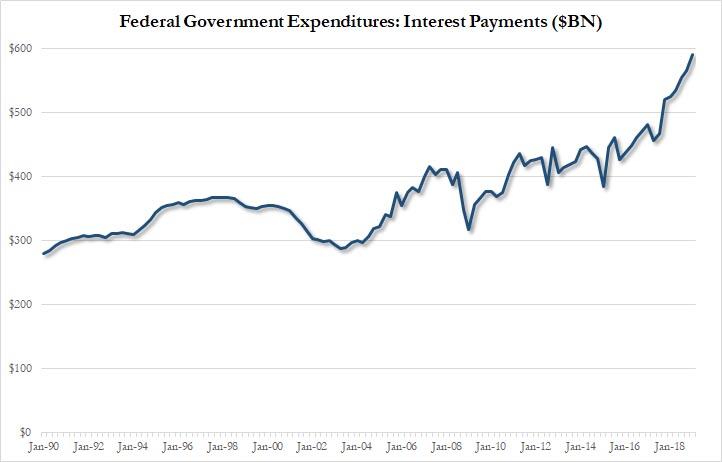
As we first pointed out one month ago, when looking at the US ‘income statement’, most concerning by far is that for the first four months of fiscal year 2019, interest payments on the U.S. national debt hit $221 billion, 9% more than in the same five-month period last year, with the rate of increase breathtaking (see chart below). As a reminder, according to the Treasury’s conservative budget estimates, interest on the U.S. public debt is on track to reach a record $591 billion this fiscal year, more than the entire budget deficit in FY 2014 ($483 BN) or FY 2015 ($439 BN), and equates to almost 3% of estimated GDP, the highest percentage since 2011.
It only gets worse from there.
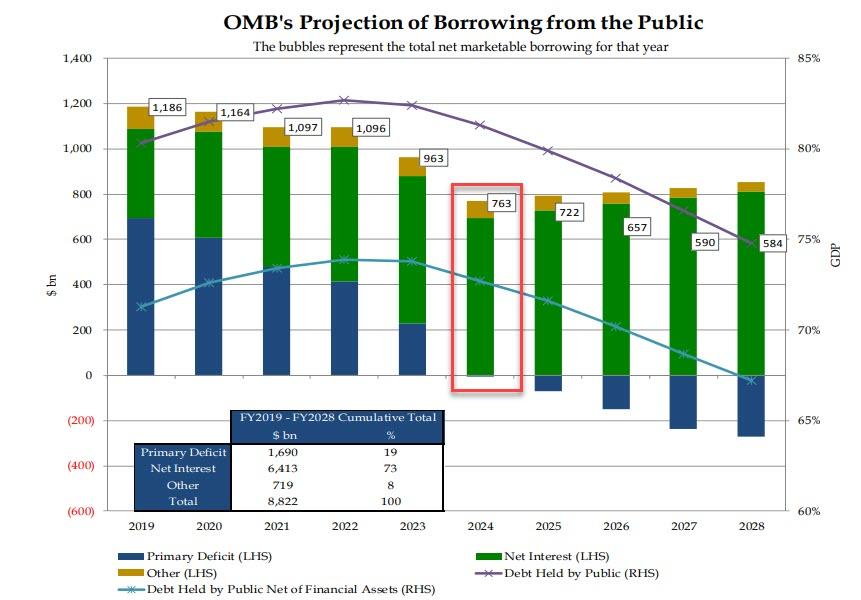
As part of today’s Treasury Presentation to the Treasury Borrowing Advisory Committee, there is a chart showing the Office Of Debt Management’s forecast for annual US debt issuance, broken down between its three component uses of funds: Primary Deficit, Net Interest Expense, and “Other.”
That chart is troubling because while in 2019 and 2020 surging US interest expense is roughly matched by the other deficit components in the US budget, these gradually taper off by 2024, and in fact in 2025 become a source of budget surplus (we won’t be holding our breath). But what is the real red flag is that starting in 2024, when the primary deficit drops to zero according to the latest projections, all US debt issuance will be used to fund the US net interest expense, which depending on the prevailing interest rate between now and then will be anywhere between $700 billion and $1.2 trillion or more.
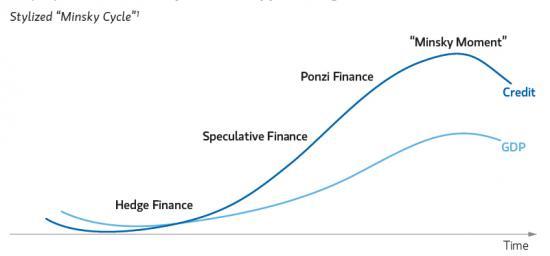
In short: in the stylized cycle of the US “Minsky Moment”, the US will enter the penultimate, Ponzi Finance, phase – the one in which all the new debt issuance is used to fund only interest on the debt – some time around in 2024.
From that point on, every incremental increase in interest rates, which will eventually happen simply due to rising inflation expectations, will merely accelerate the ponzi process, whereby even more debt is sold just to fund the rising interest on the debt, requiring even more debt issuance, and so on, until finally the “Minsky Moment” arrives. At that point, while we don’t know yet what the next reserve currency – either fiat, hard or digital – after the US dollar will be, we urge readers to own a whole lot of it.
via ZeroHedge News http://bit.ly/2VBxiud Tyler Durden