Leader Of California’s Largest Labor Union Quits After Tax, Embezzlement Charges

Leader Of California’s Largest Labor Union Quits After Tax, Embezzlement Charges

Authored by Matthew Vadum via The Epoch Times (emphasis ours),

The executive director of California’s largest labor union has resigned from her post after the state charged her and her husband with embezzlement, tax fraud, perjury, and failure to pay unemployment insurance taxes.

Then-Service Employees International Union (SEIU) California Executive Director Alma Hernandez and her husband, Jose Moscoso, were charged in a seven-page felony complaint filed with the Sacramento County Superior Court earlier this month. Hernandez had held the position since 2016. The charges, which came about as a result of a multiagency investigation led by California’s Tax Recovery in the Underground Economy Task Force, were made public this week by California Attorney General Rob Bonta, a Democrat.

SEIU represents more than 700,000 workers across California. Hernandez campaigned to defeat the September recall effort against Democratic Gov. Gavin Newsom. Her organization reportedly donated upward of $6 million to the anti-recall campaign. Newsom easily won the vote.

“The union is also a major player in the Capitol, pushing for policies such as a $15 minimum wage,” The Sacramento Bee reported. “It represents local government employees, state workers, in-home caregivers, lecturers, janitors, and health and care professionals, among others.”

In announcing the criminal proceeding on Oct. 13, Bonta defended the role of labor unions.

“Labor unions are an integral part of what makes California strong. Unions are working people standing together to demand fair wages, quality healthcare, a safe work environment, and the ability to retire with dignity,” he said in a statement.

“Working people deserve leaders they can depend on to help them achieve these goals at the bargaining table and through political advocacy, but also leaders they can trust. When there is reason to believe trust has been broken and crimes have been committed, we have an ethical duty to investigate—we owe that to the people of California.”

The California Department of Justice’s Bureau of Investigation began probing the married couple’s finances after the Fair Political Practices Commission alleged following an investigation that Hernandez had embezzled $4,500 from an SEIU California-sponsored political action committee, or PAC. It’s also alleged that she declared on a form that the PAC paid $11,700 to her husband for food vendor services that she knew hadn’t been provided.

The California Franchise Tax Board alleges that Hernandez and Moscoso underreported their income by $1.4 million from 2014 to 2019. The Employment Development Department also claims that Moscoso’s air duct cleaning business failed to report and remit taxes on employees’ wages from 2017 to 2020 and that he paid employees under the table.

The complaint also included a so-called white-collar crime enhancement that would force the couple to serve time in state prison if convicted.

Family spokesperson Mari Hernandez told The Sacramento Bee that Hernandez quit her job so that she could focus on “legal issues facing her family.”

“Those who know her know she has devoted her entire working life to the cause of justice and dignity for working people, especially those without power, privilege, or papers,” she said.

Timothy Snowball, California litigator for the Freedom Foundation, which has been critical of public-sector unions, said malfeasance in labor unions is commonplace.

Timothy Snowball, California litigator for Freedom Foundation (courtesy Timothy Snowball)

This kind of corruption at the highest echelons of leadership of SEIU California or any other union,” comes as no surprise “unfortunately,” according to Snowball.

“We’ve been documenting and spending time for years explaining to public employees about this type of corruption,” he told The Epoch Times.

“So the way this works is public employees show up at their jobs the first day, and like many jobs, you’re handed a pile of paperwork to fill out.”

That paperwork typically contains union membership cards, according to Snowball.

“A lot of times they don’t even explain what these cards are,” he said. “Sometimes, they’ll send in union representatives to strongarm people into signing these things. They find them, and then they have money taken out every paycheck to unions like SEIU California, who then take that money and spend it on political causes that those members very well may oppose.

“And when people find out about this, they go, ‘Oh, my gosh. I had no idea you’re going to be spending this on fighting the recall or anything else. And hey, I don’t want my money spent that way.’ And the union winds up saying, ‘Sorry, you signed this card. You didn’t read the fine print, and now you’re out luck.’ And it’s absolutely outrageous.”

Steve Smith, a spokesman for the California Labor Federation, implied that criticism now being leveled at SEIU wasn’t sincere.

These charges “provide fuel” to union opponents, Smith told The Sacramento Bee, but stated that every union leader in the state “takes the responsibility of being a good steward of members’ funds very seriously.”

“The way we fight back against politically motivated attacks is by continuing to show what a strong, unified labor movement accomplishes for working people,” he said.

Tyler Durden
Sat, 10/16/2021 – 20:30

via ZeroHedge News https://ift.tt/3aK5GJf Tyler Durden

US Coal “Roars Back” Under Biden Unlike Trump 

US Coal “Roars Back” Under Biden Unlike Trump 

One of the biggest ironies to start this decade is the transition from fossil fuel generation to green energy has created a global energy crisis that is forcing the U.S., among many other countries, to restart coal-fired power plants monumentally ahead of the winter season in the Northern Hemisphere to prevent electricity shortages.

The virtue-signaling assault by the green lobby spearheaded by hapless puppet Greta Thunberg must beside herself as U.S. power plants are on course to burn 23% more coal this year, the first increase since 2013, despite President Biden’s ambitious plan for a national grid to run on 100% clean energy by 2035. 

A global energy crunch is rippling through the world amid a huge rebound for power. Natural gas has soared to record highs as supplies remain tight, and countries are finding out that renewable energy sources aren’t as reliable as previously thought. This has created a massive worldwide scramble by power companies for fossil fuels, especially coal. 

U.S. utilities are transitioning to coal because soaring natural gas prices make it uneconomic to produce electricity. At the moment, 25% of all U.S. electricity produced is derived from coal-fired plants, up ten percentage points since the beginning of COVID. 

“The markets have spoken,” Rich Nolan, the National Mining Association chief executive officer, told Bloomberg. “We’re seeing the essential nature of coal come roaring back.” The Energy Information Administration forecasts U.S. utilities are estimated to burn 536.9 million short tons of thermal coal, up from 436.5 million in 2020. 

Ernie Thrasher, CEO of Xcoal Energy & Resources, the largest U.S. exporter of fuel, said demand for coal will remain robust well into 2022. Last week, he warned about domestic supply constraints and power companies already “discussing possible grid blackouts this winter.” 

He said, “They don’t see where the fuel is coming from to meet demand,” adding that 23% of utilities are switching away from gas this fall/winter to burn more coal. There are not enough coal miners to rapidly increase mining output. 

 Kevin Book, managing director of research firm ClearView Energy Partners, said the decarbonization communication from Western governments would undoubtedly be challenged due to the energy crisis it has sparked. 

“The goal of policy, if you listen to what’s being said in Western countries in the context of climate discussions, is not only to stop building new coal but to eliminate the existing capacity to burn coal,” Book said. “This is a moment in time when that idea is going to be challenged.”

One thing Greta and the wealthy elite that likely fund her campaign to reeducate younger generations into believing the green energy transition will be seamless is that it won’t and may take decades.

A pure-play coal company that is already benefiting from the demand surge and rising prices is Peabody Energy Corporation. As cooler weather fast approaches, the company may see increased demand for its thermal coal that utility companies use to produce electricity. On a technical basis, a so-called bullish “golden cross” was just triggered. 

“Make Coal Great Again,” former President Trump used to tell crowds a few years back at rallies in West Virginia. We’re sure it’s boom times in the Appalachia hills. 

Tyler Durden
Sat, 10/16/2021 – 20:00

via ZeroHedge News https://ift.tt/3aMtw78 Tyler Durden

US Coal “Roars Back” Under Biden Unlike Trump 

US Coal “Roars Back” Under Biden Unlike Trump 

One of the biggest ironies to start this decade is the transition from fossil fuel generation to green energy has created a global energy crisis that is forcing the U.S., among many other countries, to restart coal-fired power plants monumentally ahead of the winter season in the Northern Hemisphere to prevent electricity shortages.

The virtue-signaling assault by the green lobby spearheaded by hapless puppet Greta Thunberg must beside herself as U.S. power plants are on course to burn 23% more coal this year, the first increase since 2013, despite President Biden’s ambitious plan for a national grid to run on 100% clean energy by 2035. 

A global energy crunch is rippling through the world amid a huge rebound for power. Natural gas has soared to record highs as supplies remain tight, and countries are finding out that renewable energy sources aren’t as reliable as previously thought. This has created a massive worldwide scramble by power companies for fossil fuels, especially coal. 

U.S. utilities are transitioning to coal because soaring natural gas prices make it uneconomic to produce electricity. At the moment, 25% of all U.S. electricity produced is derived from coal-fired plants, up ten percentage points since the beginning of COVID. 

“The markets have spoken,” Rich Nolan, the National Mining Association chief executive officer, told Bloomberg. “We’re seeing the essential nature of coal come roaring back.” The Energy Information Administration forecasts U.S. utilities are estimated to burn 536.9 million short tons of thermal coal, up from 436.5 million in 2020. 

Ernie Thrasher, CEO of Xcoal Energy & Resources, the largest U.S. exporter of fuel, said demand for coal will remain robust well into 2022. Last week, he warned about domestic supply constraints and power companies already “discussing possible grid blackouts this winter.” 

He said, “They don’t see where the fuel is coming from to meet demand,” adding that 23% of utilities are switching away from gas this fall/winter to burn more coal. There are not enough coal miners to rapidly increase mining output. 

 Kevin Book, managing director of research firm ClearView Energy Partners, said the decarbonization communication from Western governments would undoubtedly be challenged due to the energy crisis it has sparked. 

“The goal of policy, if you listen to what’s being said in Western countries in the context of climate discussions, is not only to stop building new coal but to eliminate the existing capacity to burn coal,” Book said. “This is a moment in time when that idea is going to be challenged.”

One thing Greta and the wealthy elite that likely fund her campaign to reeducate younger generations into believing the green energy transition will be seamless is that it won’t and may take decades.

A pure-play coal company that is already benefiting from the demand surge and rising prices is Peabody Energy Corporation. As cooler weather fast approaches, the company may see increased demand for its thermal coal that utility companies use to produce electricity. On a technical basis, a so-called bullish “golden cross” was just triggered. 

“Make Coal Great Again,” former President Trump used to tell crowds a few years back at rallies in West Virginia. We’re sure it’s boom times in the Appalachia hills. 

Tyler Durden
Sat, 10/16/2021 – 20:00

via ZeroHedge News https://ift.tt/3aMtw78 Tyler Durden

Interior Secretary Haaland Says Wind Turbines May Soon Line US Coasts

Interior Secretary Haaland Says Wind Turbines May Soon Line US Coasts

Authored by Nathan Worcester via The Epoch Times (emphasis ours),

Speaking at a wind industry conference held by the American Clean Power Association, Secretary of the Interior Deb Haaland announced plans by the Bureau of Ocean Energy Management (BOEM) to arrange seven offshore lease sales along the U.S.’ coastlines by 2025, in line with the Biden administration’s executive order, “Tackling the Climate Crisis at Home and Abroad,” which directed the Secretary of the Interior to “[double] offshore wind by 2030.”

General view of the Walney Extension offshore wind farm operated by Orsted off the coast of Blackpool, Britain, on Sept. 5, 2018. (Phil Noble/File Photo/Reuters)

The proposed sites would include the coast of northern and central California, the coast of Oregon, the Gulf of Mexico, the Carolina Long Bay, the Central Atlantic, the New York Bight, and the Gulf of Maine.

The American Clean Power Conference at which Secretary Haaland spoke also featured remarks from Sen. Ed Markey (D.-Mass.) and various wind industry insiders, and was sponsored by GE Renewable Energy, Siemens Gamesa, Shell, Vineyard Wind, and other firms with a financial stake in wind power.

“The Interior Department is laying out an ambitious roadmap as we advance the Administration’s plans to confront climate change, create good-paying jobs, and accelerate the nation’s transition to a cleaner energy future,” Secretary Haaland said.

“Together, we will meet our clean energy goals while addressing the needs of other ocean users and potentially impacted communities.”

In their press release on the announcement, BOEM claimed it would use “the best available science as well as knowledge from ocean users and other stakeholders to minimize conflict with existing uses and marine life” while realizing the goal of adding another 30 gigawatts of offshore wind power by 2030.

Yet some people, including WindAction Group director Lisa Linowes, argue that BOEM and other government agencies have not done enough to address the potential environmental impacts of wind energy projects along the country’s coasts.

In an email exchange with The Epoch Times, Linowes highlighted a lawsuit against Vineyard Wind’s 800-megawatt wind energy project along Martha’s Vineyard.

The lawsuit alleges that BOEM and the National Oceanic and Atmospheric Administration/National Marine Fisheries (NOAA/Fisheries) have not done enough to protect the endangered North Atlantic Right Whale from being harmed by the project.

Offshore wind projects can also hinder commercial fishing, potentially violating the U.S. Outer Continental Shelf Lands Act of 1953.

While the Trump administration’s Interior Department released a memo in December 2020 asserting that the Act prevents offshore wind projects that unreasonably interfere with fishing, the Biden administration reversed that opinion in April 2021.

“The Secretary’s obligations to provide for the ‘protection of the environment,’ the ‘prevention of waste,’ the ‘protection of national security interests of the United States,’ and the ‘fair return to the United States’ may weigh in favor of Secretarial actions to maximize low-emission and renewable electrical generation from offshore wind facilities, but, in some circumstances, the siting and operation of those facilities may not optimally provide for other ‘reasonable uses’ of the exclusive economic zone,” writes Robert Anderson, principal deputy solicitor of the Department of the Interior, whose publications as a law professor include research aimed at “protecting offshore areas from oil and gas leasing.”

Linowes said, “The Biden [administration] is playing fast and loose with our laws in order to ram through an offshore wind industry. This is certain to produce more lawsuits and ultimately turn the public against these projects. The number of people living along the east coast that oppose these projects is growing rapidly.”

“The risks to birds and bats are real. Fifteen miles off shore is not very far,” Linowes added.

Asked what it will do to ensure its turbine capacity is not harmful to ocean life, bird populations, and fishermen, a DOI spokesperson told The Epoch Times via email that “BOEM continues to work with the fishing community, other federal agencies, Tribes, industry, conservation organizations, and other key ocean users and stakeholders to ensure that offshore energy development and the BOEM regulatory review process is informed by the data and information they provide, as well as the best available science and knowledge.”

But Linowes voiced skepticism about the agency and industry’s commitment to working with fishermen and other stakeholders, stating that those groups “failed to achieve agreement with Vineyard Wind and other projects off the coasts of NJ and NY.”

Asked about who would clean up old wind turbines and associated infrastructure, the DOI spokesperson responded that “lessees are responsible for the decommissioning of proposed projects at the end of their lease. This includes the removal or decommissioning of all facilities, projects, cables, and obstructions.”

On Twitter, Haaland’s remarks were met with enthusiasm by some.

“This has to be my favorite announcement to come out of #OffshoreWind21 so far! Many thanks to Secretary Deb Haaland for taking the trip. This has many implications for the #NewYork area, especially as regards #ports #infrastructure and electrical transmission,” said David Brezler, who describes himself on LinkedIn as a data analytics and project management professional currently working on offshore wind and other renewable energy projects.

Others responded to the announcement by pointing out wind energy’s reliability and cost issues.

While Biden’s Department of Energy has claimed that 30 gigawatts of additional wind power would “power 10 million homes,” intermittent power sources such as wind also require backup from natural gas or other reliable electricity sources when wind is not blowing, adding what are known as load balancing costs.

In Germany, where wind power has rapidly expanded, energy prices for household consumers have risen to the highest in the European Union (EU), and are expected to spike this winter, in line with projections for the United States.

Germany’s dependence on foreign energy sources, including Russia and other geopolitical rivals, is also high; in 2019, Germany relied on imports for 71 percent of its energy supply according to the Energy Information Administration, a slight decline from 2000, according to Deutsche Bank.

“Wind farms can’t ‘combat’ climate change. Only fraudsters claim, and idiots believe such nonsense. All wind farms do is rip off ratepayers with pointlessly expensive and unreliable electricity,” said Steve Milloy, proprietor of JunkScience.com, who served on President Trump’s Environmental Protection Agency (EPA) transition team.

Tyler Durden
Sat, 10/16/2021 – 19:30

via ZeroHedge News https://ift.tt/3FVYicj Tyler Durden

Ethereum’s Turn To Outshine Bitcoin Is Coming, UBS Says

Ethereum’s Turn To Outshine Bitcoin Is Coming, UBS Says

After a stellar start to the year, which saw its price soar to an all time high above $4,100, trouncing virtually all of its crypto peers, Ethereum has stagnated in recent weeks, with its place in the spotlight taken by bitcoin which whose impressive outperformance has been the result of now confirmed speculation that a bitcoin futures ETF is coming. It also meant that what has traditionally been a close correlation between the two larges cryptos has broken in favor of the larger peer; it would also suggest that ethereum is trading about $1000 cheap vs bitcoin.

It wasn’t just bitcoin’s long-overdue ETF success: ETH was also put in the shade by DeFi- and NFT-driven demand for faster and cheaper blockchains since the late summer, according to UBS strategist James Malcolm. But in the bank’s latest Crypto Compass publication, Malcolm writes that this could soon change thanks to the progress with one of Ethereum’s prior Layer 2 solutions, Optimism.

As UBS explains, “having been all but forgotten, it suddenly seems set to give leading competitor Arbitrum a run for its money. OVM 2.0 promises faster processing, cheaper gas prices and fewer code constraints, which should encourage smart contract deployment.” Furthermore, it has just been implemented on Ethereum’s testnet and is now scheduled to go mainnet-live in two weeks, on October 28.

Of course, all of this pales in comparison to the ETH uplift that will take place once Ethereum 2.0 is ready for rollout. Some have speculated that the event will quickly trigger a quick doubling in the cryptocurrency which Goldman dubbed the “Amazon for information” (and is why Goldman also sees ETH eventually overtaking BTC).

Data also show the recent rebound in active addresses on chain, offset by the small decline in total transfer volumes, which however can be attributed to the surge in whale trading in recent weeks (more below).

A curious divergence also emerges when looking at exchange balances between BTC and ETH.

But what appears most remarkable is the distribution of crypto strikes for bitcoin and ethereum, both of which are far above spot, suggesting that a major gamma squeeze may be on deck for both.

Incidentally, speaking of ETH level 2, Bitcoin’s Lightning Network for smaller transactions has also been growing in anticipation of next month’s Taproot upgrade: year-to-date, the number of LN nodes and channels has doubled, and capacity nearly tripled.

Incidentally, this does not mean that Bitcoin is set to drop, on the contrary.

As UBS also writes, Bitcoin – which is now on the right side of $60k – is within striking distance of its April all time highs. Its latest rally came in two steps: October 1, which was put down to a Powell comment about having no intention to follow China in banning crypto, and October 6 when nearly $1.6bn of buy orders were reportedly executed within five minutes. Both occurred against a backdrop of big-name presenters at digital summits, rising speculation about imminent US ETF approval (which we now know has taken place), and pushback from the Senate Banking Committee’s ranking Republican against the Biden administration and Fed’s crystallizing plans to impose bank-like regulation on stablecoins. Pat Toomey’s point was this is something for Congress to decide and enact clarifying legislation, which would take more time. They helped trigger liquidations of short futures positions but left no footprint on bid-ask spreads, which barely budged in contrast to what we saw a month earlier.

Not surprisingly, with Bitcoin steamrolling above $60K, bullish sentiment has become even more pronounced, attracting growing spot-futures basis arbitrage on the CME and pushing perpetual futures funding rates uniformly higher

On-chain activity has also seen a major revival as BTC entity-adjusted transaction volumes overshot their early-2021 highs.

What is most remarkable is that this is not at all small-time and retail investors setting the price: as the next chart from UBS shows, whales are in the driving seat to an almost unprecedented degree with the mean-to-median transaction size ratio is at its highest level since 2013.

And speaking of whales, the bitcoin supply held by whales is now at the highest it has ever been at around 8mm coins (out of a total 21mm), while both exchanges and OTC desks have seen their holdings decline. Also notable, the collapse in bitcoin supply that was last active less than 3 months ago as increasingly more are truly HODLing.

Tyler Durden
Sat, 10/16/2021 – 19:00

via ZeroHedge News https://ift.tt/3jbBf3c Tyler Durden

Morgan Freeman Spurns “Defunding Police”; Says “Most Of Them Are Guys That Are Doing Their Job”

Morgan Freeman Spurns “Defunding Police”; Says “Most Of Them Are Guys That Are Doing Their Job”

Authored by Louise Bevan via The Epoch Times,

Legendary American actor Morgan Freeman, while talking about his upcoming movie “The Killing Of Kenneth Chamberlain,” took the opportunity to express that he rejects the notion of “defunding the police.”

While talking to Black Enterprise magazine’s Selena Hill in early October, the 84-year-old actor clarified, “I’m not the least bit for defunding the police. Police work is, aside from all the negativity around it, it is very necessary for us to have them, and most of them are guys that are doing their job.

“They’re going about their day-to-day jobs,” he said.

“I know some policemen who would never even pull their guns, except on a range.”

Morgan Freeman speaks at the 26th Annual Critics Choice Awards on March 07, 2021. (Getty Images)

Freeman’s latest film, “The Killing Of Kenneth Chamberlain,” is about the real fatal police shooting of an elderly black Marine vet with bipolar disorder in his home in White Plains, New York.

Co-star Frankie Faison, playing Chamberlain, aligned with Freeman’s stance on police defunding while pointing out a discrepancy.

“We as entertainment, people in the arts, we’re treated a little differently by law enforcement than people who are just ordinary walks of life,” he told Hill.

“I would like for that to stop; I want us all to be treated equally.”

In an Instagram post, Hill stated her contrary position as an “avid supporter of defunding the police,” but concurred with the actors that violence against African-Americans at the hand of police should end.

While rejecting defunding, Freeman put his money where his mouth is to promote police reform, a movement he supports.

In June, alongside University of Mississippi criminal justice professor Linda Keena, the actor donated $1 million to the university’s School of Applied Sciences for a research and specialized training center: the Center for Evidence-Based Policing and Reform.

Freeman and Linda Keena attend the 2017 Breakthrough Prize at NASA Ames Research Center in Mountain View, California, on Dec. 4, 2016. (Kimberly White/Getty Images)

“Look at the past year in our country, that sums it up,” Freeman said.

“It’s time we are equipping police officers with training, and ensuring ‘law enforcement’ is not defined only as a gun and a stick.

“I often talk to police officers when I see them out and ask how they would do their work if they didn’t have guns,” he added. “Support of this center is about finding ways to help officers, and arrive at solutions.”

Keena agreed, “The goal should be to give officers as many tools as possible to do their jobs more effectively.”

Tyler Durden
Sat, 10/16/2021 – 18:30

via ZeroHedge News https://ift.tt/3n3VYHm Tyler Durden

Just How Big Is China’s Property Sector, And Two Key Questions On Policy And Tail Risks

Just How Big Is China’s Property Sector, And Two Key Questions On Policy And Tail Risks

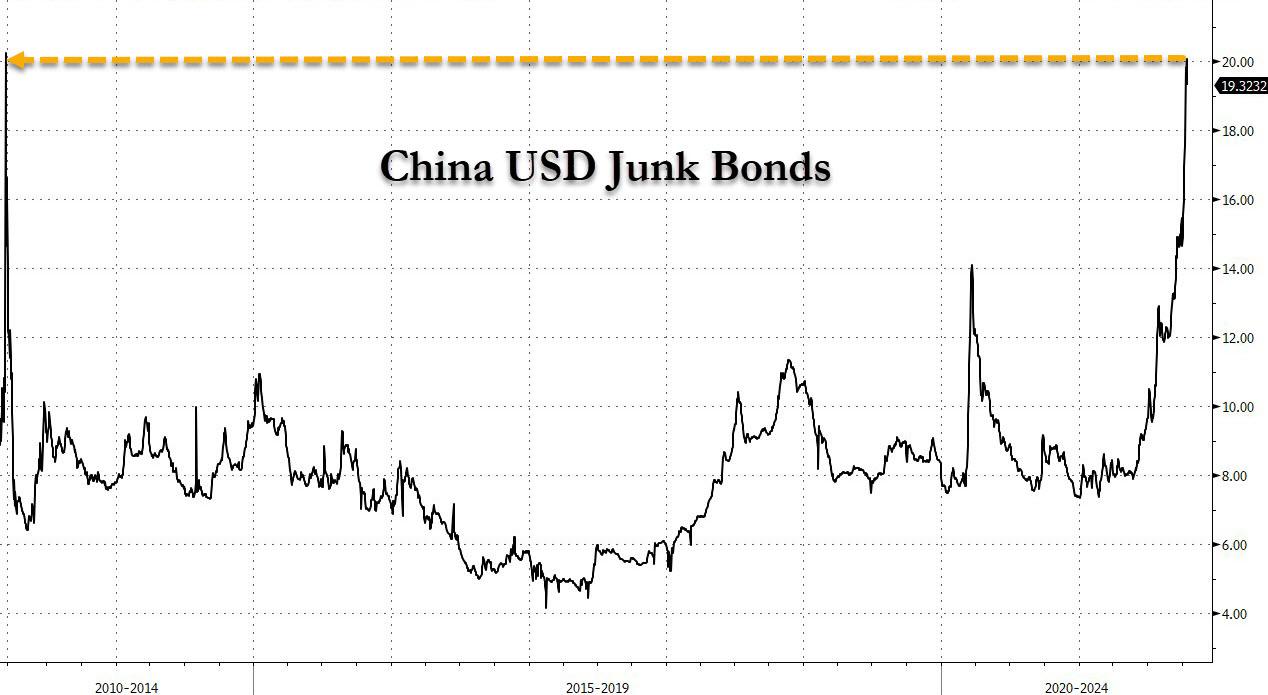
While the broader US stock market was giddily melting up in the past week, things in China were going from bad to worse with Evergrande set to officially be in default on Oct 23 when the grace period on its first nonpayment ends, and with contagion rocking the local property market – which as we explained last week just saw the most “catastrophic” property sales numbers since the global financial crisis – sending dollar-denominated Chinese junk bonds to all time high yields.

So even though it is now conventional wisdom that China’s property crisis is contained (just as its concurrent energy crisis is also somehow contained), we beg to differ, and suggest that the crisis hitting the world’s largest asset class is only just starting and is about to drag China into a “hard landing”, with the world set to follow.

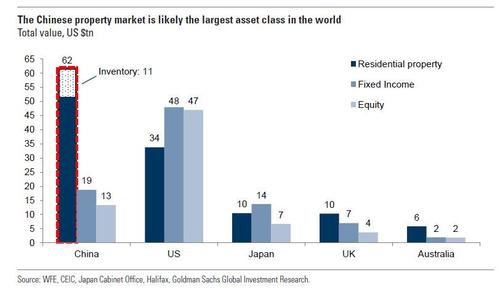
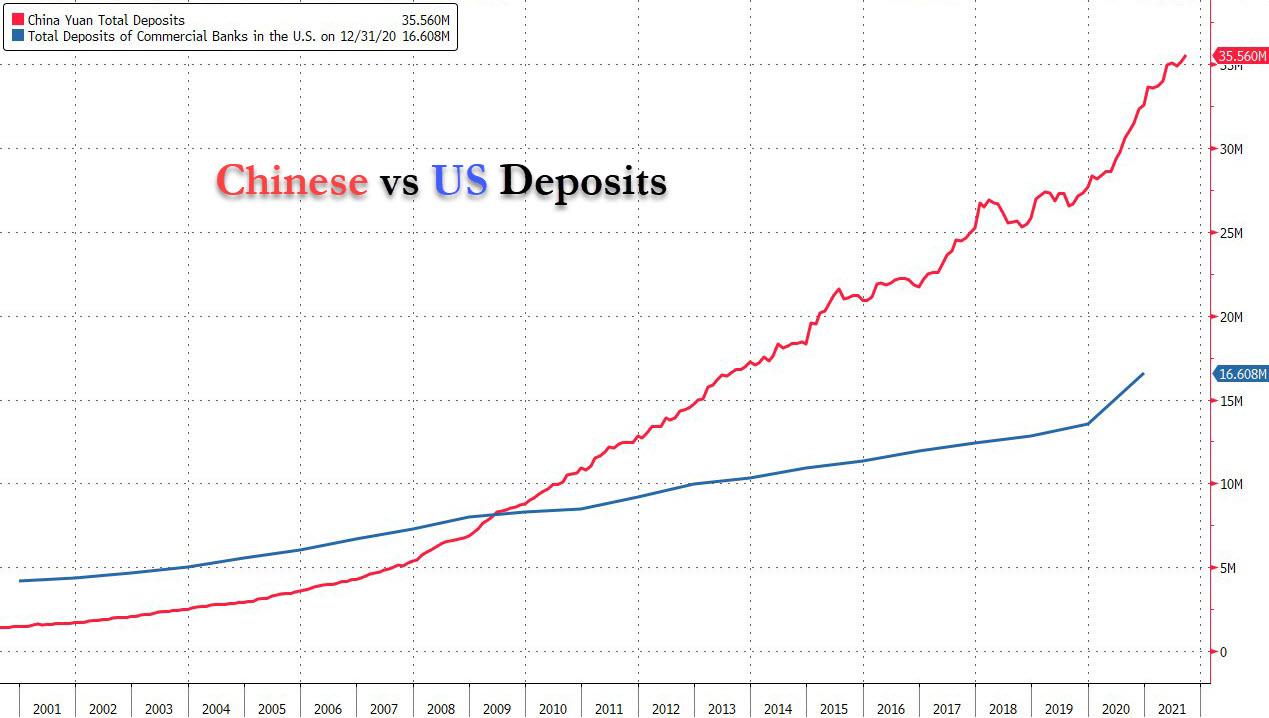
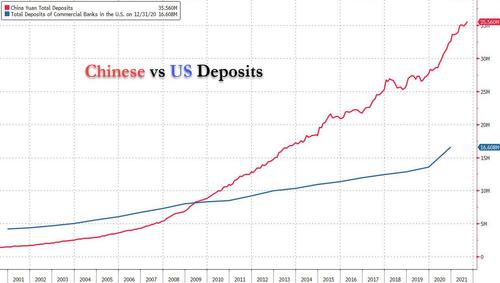
And yes, with a total asset value of $62 trillion representing 62% of household wealth, the Chinese real estate sector is not only 30 times bigger than the market cap of all cryptos and also bigger than both the US bond and stock market, but is the key “asset” that backstops China’s entire financial system whose deposits at last check were more than double those of the US. In other words, if China’s property sector wobbles, the world is facing a guaranteed depression.

So given the escalating weakness in China’s property sector, which has been in focus given intense regulatory pressure on developers’ leverage and banks’ mortgage exposure, and consequent contraction in sales and construction activity, it is natural to ask how significant a hit this could pose to both China’s and the global economy. To help people get a sense of scale, below we excerpts some of the key findings from a recent note from Goldman showing just how big China’s property sector is.

  1. A wide range of estimates for the scale of China’s property sector — up to about 30% of GDP — have been reported in the media and by other analysts. Different definitions of the scope of the sector largely account for the disparity.
  2. The most important distinctions are what types of building are included (residential, nonresidential, or all construction including infrastructure), what economic activity is included (only the construction itself, or all the value-added embedded in the finished residence e.g. domestically produced materials), and whether related real estate services are also included.
  3. A narrow definition of “residential construction activity as a share of GDP” could be as low as 3.6% of GDP. Expanding this to include all related domestic activities – e.g. materials like metals, wood, and stone produced domestically and used in housing construction, as well as services like financial activities and business services used directly or indirectly by the housing sector – would account for 12.4% of GDP. Adding nonresidential building construction and its associated activity would take it to 17.7%. Finally, including real estate services—which show a high correlation with broader property trends—would take the number to 23.3%. (All these numbers are based on detailed 2018 data, and exclude infrastructure spending not directly related to residential and nonresidential buildings.)
  4. The property sector’s share of the Chinese economy has grown fairly steadily over the past decade, after surging in the stimulus-fueled recovery just after the 2008 financial crisis.

Digging into the definition of the “property sector”, there are three main questions that need to be kept in mind:

1. What types of construction? One important difference is in what types of construction activities are included. Construction broadly consists of three categories: residential housing, nonresidential buildings, and infrastructure-related construction. In China, residential construction appears to be about half of total construction—the rest is either non-residential building construction or civil engineering works, plus a small amount of installation/decoration activity. Specifically, residential and nonresidential buildings represent around 70% of total construction, and residential floor space under construction is typically about 70% of total floor space under construction.

Note that this ~50% share for residential share of total construction is not unusual in international perspective. For example, the residential share is similar in the United States—though it reached into the 60-70% range during the peak years of the housing bubble—and has been about 40-50% in South Korea for some time.

2. What types of economic activity (only construction, or everything necessary to complete the finished building)? An even more important distinction is what types of activities one counts. Strictly speaking, the construction industry itself represents about 7% of China’s GDP. This represents wages, profits, and taxes from the construction sector (regardless of what type of construction or what end users). This is the value added of the construction sector itself, or the narrowly defined activity of building things.

However, the construction industry uses a lot of output from other sectors – both materials (cement, wood, steel, etc.) and services (transportation of materials, financial services) to create finished buildings. Put another way, there are a lot of “backward linkages” from the construction sector: a home purchase requires not just the value added from construction industry, but also the value added from the “upstream” industries that provided the materials and were otherwise involved in the completion of the finished product.

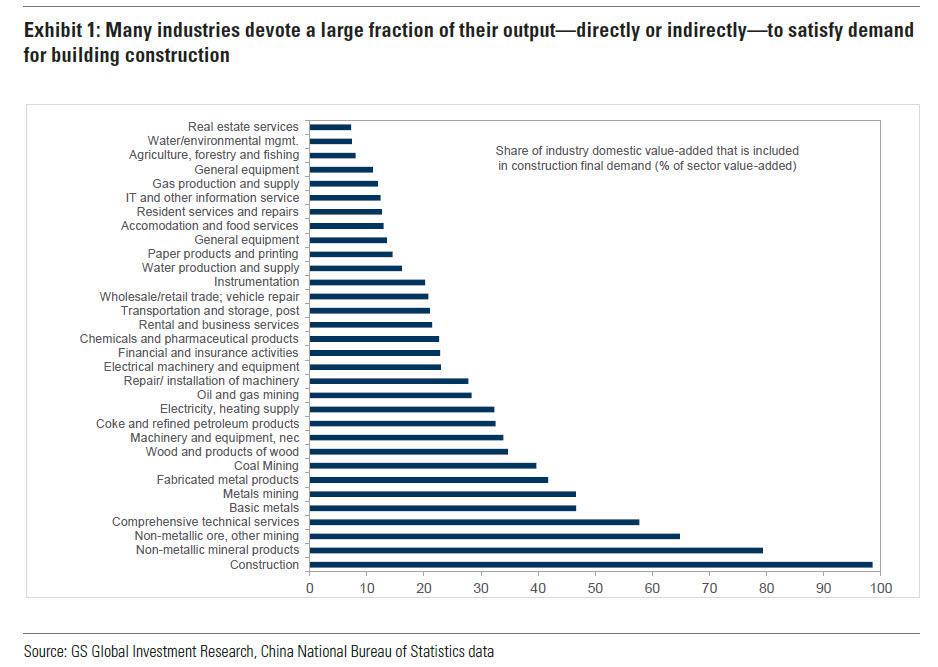
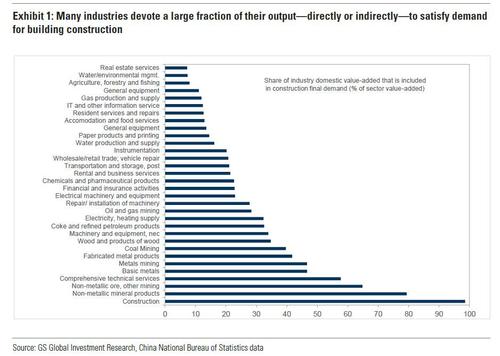
To gain some intuition for this, in the chart below, Goldman shows how much of each industry’s domestic value added ultimately goes into “final demand” of the construction industry (purchases of property by consumers or investment in property by businesses). For example, about one-third of value added in “wood products” goes into construction, about one-half of basic metals value added goes into construction, and essentially all of construction’s value added goes into construction final demand. (Note that this includes direct and indirect requirements—for example, basic metal output that is sold to firms in the metal fabrication industry that then sell to the construction sector would be counted as part of final demand for construction.)

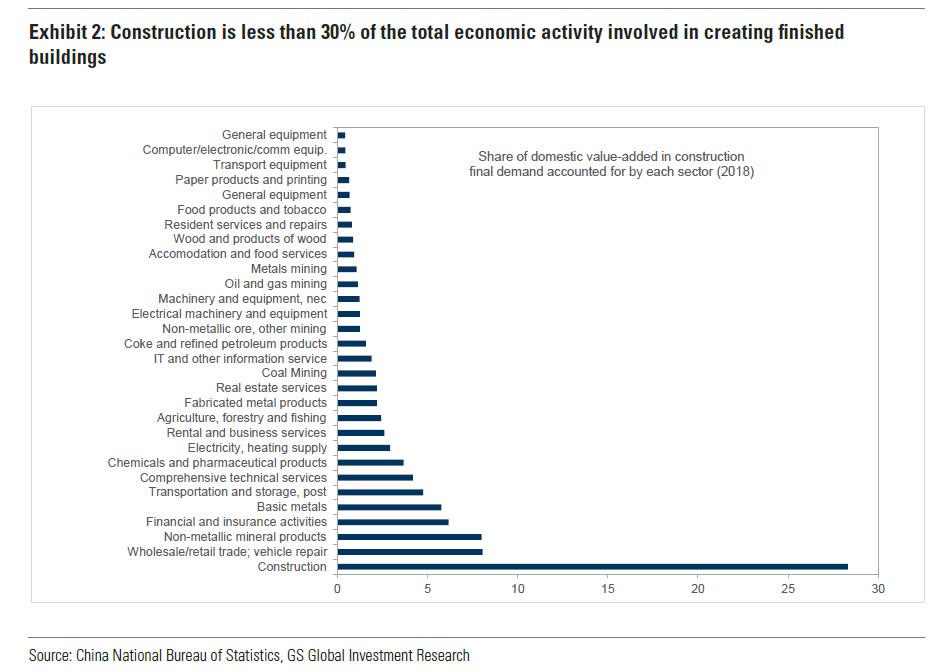
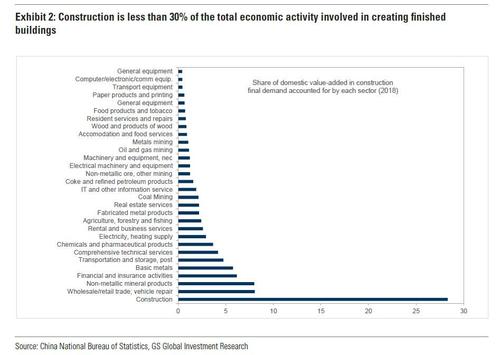
The next chart shows what fraction of the final demand for construction is provided by each sector. Roughly speaking, if we think about this as “the total domestic value added embedded in an apartment”, almost 30% of this is provided by construction activity, 8% from nonmetallic mineral products, etc.

From the perspective of total domestic value added from all industries embedded in the final demand of the construction industry, the overall construction industry’s final demand accounts for roughly one-quarter of China’s GDP. This estimate is based on China’s most recent (2018) “input-output” table—which indicates the final output of each industry, as well as how much input is used from every other.

3. Should real estate services be included. Some analysts focus on property construction only, while others add the “real estate services” sector e.g. the leasing and maintenance of buildings when estimating the impact of the housing sector of the economy. These activities contribute roughly 6-7% of GDP in China. In many countries, real estate services are somewhat less volatile than housing construction. The likely reason is that real estate services relate in part to the stock of existing buildings than the flow of new building construction. Even if there were a housing crash and building construction stopped, most real estate services could theoretically continue.  As evidence of this, in the US housing crash, construction sector GDP fell by ~30% peak to trough but real estate services never declined. That said, in China the “real estate services” sector has been significantly more volatile, almost as volatile as the construction sector itself.

Contributions by type of demand and activity

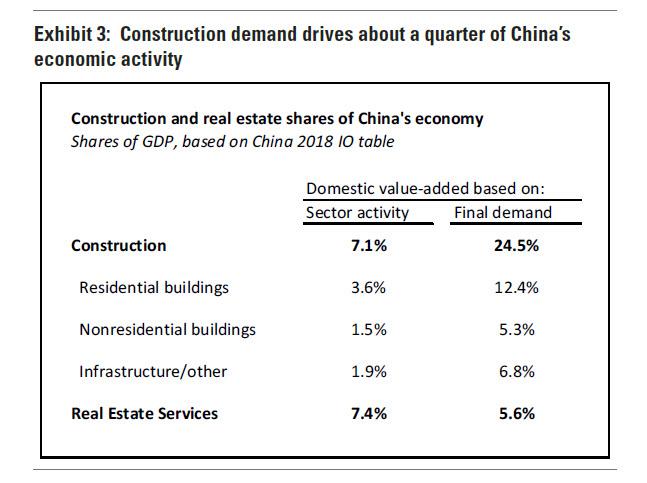
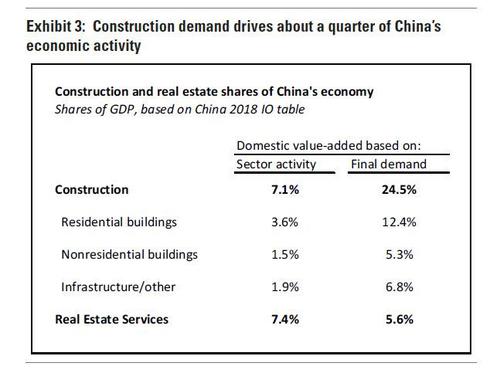
Taking these three factors into consideration, Goldman next shows estimated shares of China’s activity in the next chart, and breaks down construction into its main components while showing the share attributable to real estate services. The “sector activity” column shows the share of GDP accounted for directly by activities of that sector. In other words, companies and workers engaged in all types of construction activity accounted for 7.1% of China’s GDP in 2018. The “final demand” column shows the share of GDP accounted for by all the domestic economic activities embodied in final demand for that sector. In other words, the demand for buildings and other construction also generates demand for materials and other types of services — and adding the value added in construction and all of these “upstream” sectors together gives the numbers in the right column

Putting the above together, the size of China’s property sector therefore depends on the question we want to answer:

  • What share of Chinese economic activity do workers/companies involved in residential construction represent? Here, one should look at domestic value-added (the left column). This is 7.1% for overall construction and just 3.6% for residential construction only.
  • How much economic activity is driven by demand for residential property construction? Residential property demand drives 12.4% of GDP (right column, second row in table), because in addition to the construction activity it creates demand for all the materials and other services involved in building construction.
  • What about the impact of total demand for property construction? Including non-residental buildings as well as residential, and the total upstream requirements of both, we want to look at the “domestic value added in final demand” of construction of residential + nonresidential buildings. This is 17.7% of GDP (12.4%+5.3%).
  • How much of the economy is at risk from a property downturn? Here, we could potentially add end demand for real estate services to the above calculation. This would be another 5.6% of GDP, suggesting 23.3% of the economy—nearly a quarter—would be affected.

Finally, if one adds all construction and all real estate and all their associated activities, we get just over 30% of the economy (24.5%+5.6%), although it is worth caveating that this may be an overly broad definition for the property sector, as it includes infrastructure-related activity, which if anything is likely to be ramped up by policymakers in the event of severe property sector weakness.

* * *

Yet even a nice big, round 30% estimate for how much China’s property sector contributes to GDP, does not encompass all the potential spillovers from a construction sector downturn. There are at least three others:

  1. Second-round effects. A shock to construction (or any other sector) implies a drop in wages and company profits in that sector. This in turn implies lower income for the household and business sectors — and incrementally lower consumption and investment respectively. Such “second-round” or “multiplier” effects aren’t included in the estimates above.
  2. Fiscal spillovers. Land sales represent an important part of local government revenues in China (roughly 1/3 in gross revenue terms). Governments acquire land usage rights from rural occupants and sell them at a premium via auctions to developers. If land sales revenues fall because of a housing downturn (through some combination of fewer successful auctions and/or lower land prices), budgets will be squeezed, which could limit local governments’ spending and investment.
  3. Spillovers abroad via imports. As the world’s largest trading nation, China does not get all of its construction materials and other intermediate inputs domestically. In addition to the estimates above, which focus on domestic value-added, about 11% of the total value added embedded in China’s construction final demand is from foreign sources. (This is about 3% of China’s GDP, although it makes more sense to look at each trading partner’s exposure relative to the size of its own economy.) So, if we wanted to look at the total size of China’s construction sector in terms of driving economic activity, regardless of where that economic activity occurs (perhaps to compare China’s construction sector to other countries with different levels of import intensity) the figure in the top right cell in Exhibit 3 would be 3% larger.

Putting it all together, and China’s property sector emerges as the mother of all ticking financial time bombs.

* * *

Which brings us to what is Beijing’s latest policy action (if any) to prevent this potential financial nuke from going off, and what are any additional tail risks to be considered.

Well, as noted above, China’s property sector began the week with sharp price falls across the board, with China’s junk bonds cratering to near all time lows and with signs that the concerns are spilling over to the broader China credit market with spreads widening across the board. Some key updates:

  • Recent news suggest China property stresses are building up. A number of China property HY developers have made announcements over recent weeks regarding their upcoming bond maturities.
  • On 11 Oct, Modern Land launched a consent solicitation to extend the maturity on its USD 250mn bond due on 25 Oct by 3 months
  • Xinyuan Real Estate announced on 14 Oct that the majority of holders of its USD 229mn bond due on 15 Oct have agreed to an exchange offer. Note that Fitch considers both transactions to be distressed exchanges.
  • Furthermore, Sinic announced on 11 Oct that they are not expecting to make the principal and interest payments on its USD 250mn bond due on 18 Oct. These indicate that stresses amongst developers are building.

Meanwhile, the grace period on Evergrande’s missed coupon payments is ending soon. Evergrande missed coupon payments of USD 148MM on 11 Oct. This came after missing an earlier coupon payment on 23 Sep. The earlier missed coupon has a 30-day grace period, which ends on 23 Oct, and should that not be remedied in the coming week, the company will be in default on this bond. With Evergrande USD bonds priced at around 20, a potential default is unlikely to have large market impact, though if the company is able to remedy the earlier default, this could provide a positive surprise for the market.

Despite these mounting risks, the market staged a sharp rebound at the end of the week, with news emerging that policymakers are seeking to speed up mortgage approvals (if not followed by much more aggressive easing, this step will do nothing but delay the inevitable by a few days).

And while Goldman’s China credit strateigst Kenneth Ho writes overnight that valuation is cheap across the lower rated segments within China property HY, market direction hinges on whether they will be able to refinance and avoid defaults. In particular, he notes that with $6.2bn of China property HY bonds maturing in Jan 2022, policy direction in the coming two months will be key. And since Goldman remains in the dark as to what Beijing will do next, as it remains “difficult to foresee how policy developments will play out in the coming weeks”, Goldman prefers to wait for clearer signs of policy turn before shifting lower down the credit spectrum.

* * *

This brings us to what Goldman calls two key questions on China property – policy and tail risks, which will dictate the direction of the China property HY market.

As discussed in depth in recent days, Beijing’s tight regulatory stance is increasingly affecting a broader set of developers, as slowing activity levels are adding to worries across China property HY. For the period from early August to the first week of October, the volume of land transactions cratered by 42.5% compared with the same period last year, and for property transaction volume, this fell by 27.0%.

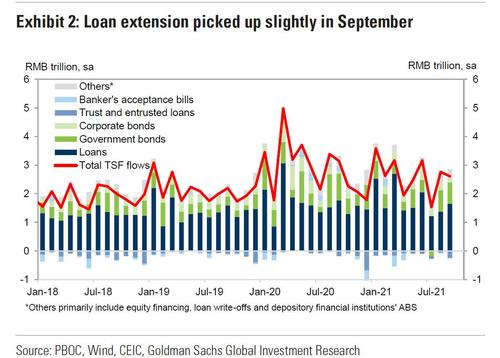
Difficult credit conditions and weak presales add pressure to developers’ cash flows, and these factors are what led to the pick up in defaults and stresses in China property HY. Therefore, unless there are clear signs of an easing in policy direction, Goldman warns that tail risks concerns are unlikely to subside, and these will dictate the direction of China property HY market. As noted by Goldman’s China economics team, credit supply holds the key to China’s housing outlook in the near term, emphasizing the need for policy adjustments in order to stabilize the housing market. Incidentally, the latest monthly Chinese credit creation numbers showed a modest miss to expectations, as total TSF flows came in at 2.928TN, just below the 3.050TN consensus, and up 10.1% Y/Y, lower than the 10.3% in August (the silver lining is that M2 rose 8.3%, up from 8.2% in August and above the 8.2% consensus).

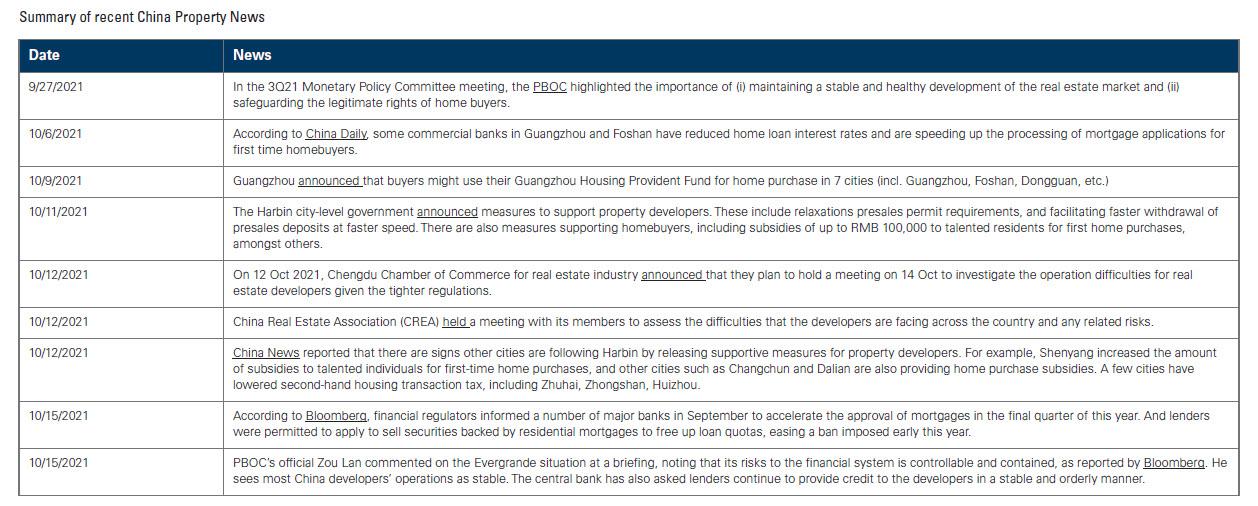
That said, given the sharp slowdown in residential property activity levels over the past two months, policy stance appears to have relaxed over the past two weeks if somewhat more slowly than most had expected. The table below summarizes a number of policy announcements and news reports that suggest some easing of policies are taking place.

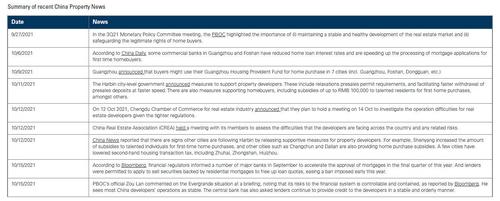
That said, the announcements and policymakers’ statements do not signal a large shift in overall policy direction yet. For example, the more concrete measures such as home buyer subsidies and the reduction in home loan interest rates are conducted at a city, and not national, level. And whilst Bloomberg reported that the financial regulators have informed a number of major banks to accelerate mortgage approvals, the precise details are lacking. The recent actions are therefore mostly in line with the overall policy stance. On one hand, policymakers remain focused on the medium term goal of deleveraging, and will want to avoid over-stimulating and reflating the property sector; on the other hand, policymakers have stated that they want a stable property market and to avoid systemic risks from emerging, suggesting that they would seek to avoid over-tightening. The problem is that they can’t have both, and one will eventually have to crack.

Goldman is somewhat more optimistic and writes that finding a balance will take time, adding that “given the need to balance the competing policy objectives, further measures could continue to emerge piecemeal, and visibility on the timing and the type of policy actions are limited.” Furthermore, there may need to be further downside risk towards the property sector before we see a more decisive change in direction in the policy stance. This means that tail risks concerns are unlikely to subside, despite signs that policy direction is gradually shifting.

* * *

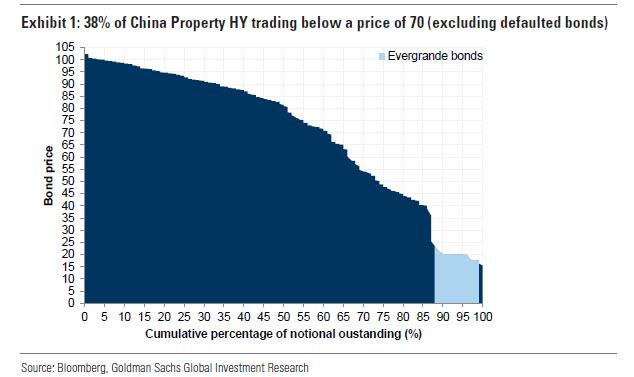
Assuming help does not come on time, the next key question is how fat is the tail as large amounts of bonds trading at stressed levels. Currently, the China property market is pricing in elevated levels of stress. Their price distribution is shown below indicating that 38% of bonds (by notional outstanding and excluding defaulted bonds) are trading at a price below 70, and 49% of bonds are below a price of 80.

Are market prices overly bearish on tail risk, or are they accurately reflecting the stresses amongst property developers? With policymakers likely to maintain their medium term goal to delever the property sector, it is unlikely that tail risk concerns for higher levered developers will not subside. However, how “fat” the tail is will depend on the policy stance over the next two months.

A big challenge going forward is that there are sizeable bond maturities in the next year, which will heavily influence tail risk. As noted above, a number of developers have conducted or are seeking to complete distressed buybacks, and defaults rates amongst China property HY companies are soaring. As such, the policy stance in the next two months will be critical.

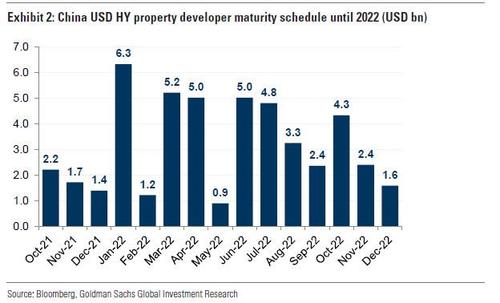
As shown in Exhibit 2, China property HY bond maturities are relatively light for the remainder of 2021, but pick up substantially in 2022, with USD 6.3bn of bonds maturing in January alone!

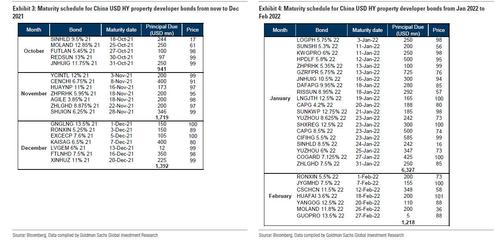
A full list of bond maturities from now to February 2022, is shown below.

It goes without saying, that should policy easing over the next two months be insufficient to ease the financial conditions amongst developers, there could potentially be a meaningful pick up in credit stresses at the start of 2022 just as the Fed launches its taper and just as a cold winter sends energy costs to unprecedented levels.

Finally, for any investors seeking some exposure to China’s HY market assuming that the worst is now over, Goldman agrees that while valuation is cheap across the lower rated segments within China property HY, the key determinant on market direction won’t be valuation, but rather hinges on whether developers will be able to refinance and avoid defaults – i.e., can the Ponzi scheme continue.

Tyler Durden
Sat, 10/16/2021 – 18:00

via ZeroHedge News https://ift.tt/2XkyUeP Tyler Durden

North American Crane Count Decrease Signals Growing Uncertainty

North American Crane Count Decrease Signals Growing Uncertainty

By Zachary Phillips of ConstructionDive

Summary:

  • Rider Levett Bucknall’s Crane Count decreased by 4.5% from Q1 to Q3 2021. The index measures the number of fixed cranes across cities in the U.S. and Canada, as a representation of the active construction workload in those cities.

  • Of the 14 cities measured, only three — Los Angeles, San Francisco and Toronto — saw an increase in the number of cranes in that period.

  • Five of the cities — Chicago, Denver, Las Vegas, Phoenix and Portland — saw what RLB called a “significant decrease” in the number of cranes; dropping by 30% or more.

The dip in Q3 comes after a spike in Q1 of 2021, which also followed a decrease in the crane count. Toronto has continued to tower over U.S. cities when it comes to the total number of cranes.

One thing connects all the cities, RLB’s report said: uncertainty, which remains significant to construction everywhere. Commercial cranes are down collectively 36% — or 20 cranes — across North American cities.

“We anticipate better times ahead with previously delayed projects being brought back online,” the report said. “However, this is conditional upon market conditions as the AEC industry continues to experience the effects of COVID-19.”

The most popular sectors for crane usage were mixed-use and residential. In Los Angeles, RLB counted 25 cranes for mixed-use and 12 for residential projects. In Toronto, those numbers were 47 and 133, respectively.

Other findings from the report include:

  • A 40% increase of cranes used in the education construction sector.
  • Los Angeles saw the highest percentage increase from Q1 to Q3, by 19%.
  • The number of cranes in Toronto increased by 81% when compared to Q3 2020.

Here are some of the highlights for U.S. cities:

Los Angeles: The second most populous city in the U.S. saw its second straight report with an increase in the number of cranes, jumping from 43 to 51. The growth can likely be attributed to an increase in major transportation projects in the city, RLB said. The number of cranes on commercial projects have declined, in addition to a dip in the hospitality sector, but there has been a spike in demand for residential construction.

San Francisco: The number of cranes in San Francisco grew by two from Q1 to Q3, but 10 new cranes have been erected within the last six months, RLB said, as some projects leave and others arrive. Most of the new cranes are for residential projects, which has seen an increase in demand, though others are for mixed-use and industrial projects. 

Chicago: In January of 2017, RLB counted 56 cranes in Chicago. A steady, though not constant, decline in those numbers led to only seven counted cranes in Q3 of 2021. This, however, is due to a large number of projects downtown topping off and now leasing to new renters. The number of cranes is not anticipated to increase in the near future, RLB reported.

Tyler Durden
Sat, 10/16/2021 – 17:30

via ZeroHedge News https://ift.tt/3lLECzv Tyler Durden

Trump Favored To Win 2024 Among Top UK Betting Houses

Trump Favored To Win 2024 Among Top UK Betting Houses

Former President Donald Trump is favored to win the 2024 US election, according to UK-based betting exchange Ladbrokes sportsbook, as well as London-based Smarkets.

As the Las Vegas Review-Journal notes, Trump surpassed Joe Biden last week – with Smarkets giving the former US president a 20% chance (4-1 odds) of winning in 2024 vs. Biden’s odds of winning at 19% and VP Kamala Harris’ odds at 13%.

“It’s a pretty staggering development to find a defeated one-term president taking over as favorite from the incumbent who beat him, but we know by now that Donald Trump is no ordinary politician,” said Smarkets head of political markets, Matthew Shaddick. “It’s early days, but the latest market signals suggest there is every chance we could be heading for a Biden vs. Trump rematch in 2024 with Trump currently having a very slight edge, according to the betting.”

At Ladbrokes, Trump is a +350 favorite over Biden (also 4-1 odds), and Harris 5-1.

Trump’s odds of becoming the 2024 GOP nominee stand at 45%, according to Smarkets.

“Trump’s odds have been improving all year and in particular since Biden’s poll ratings began declining this summer,” said Shaddick, adding “There is absolutely no sign of Republican voters deserting him, and he leads every primary poll by a distance.

“Many forecasters had predicted that health or legal issues might stop Trump from re-election, but the latest Smarkets prices imply that there is a two-in-three chance he’ll run for the White House again in three years’ time.”

At London’s Betfair, however, Biden is favored over Trump (4-1) while Harris stands at 5-1.

As the Review-Journal notes, wagering on the election isn’t permitted at US sportsbooks – however “At offshore books that operate illegally in the U.S., Trump is the +275 favorite over Biden (+325) and Harris (5-1) at BetOnline and the 3-1 favorite over Biden (+325) and Harris (5-1) at SportsBetting.ag.”

Tyler Durden
Sat, 10/16/2021 – 17:00

via ZeroHedge News https://ift.tt/3j8Vxuj Tyler Durden

Investors Rush To Buy Nearly 1 In 4 Homes

Investors Rush To Buy Nearly 1 In 4 Homes

Authored by Mike Shedlock via MishTalk.com,

Investors are buying huge percentages of existing home sales…

Corelogic reports Single-Family Investor Activity Surges in the Second Quarter.

Large investors (those who retain 100 or more properties) are largely responsible for this rise.

Of all investor purchases made in June 2021, 20% were made by large investors. This is much higher than 11% in 2020 or 14% in 2019.

Small investors (those who retain between 3 and 10 properties), have declined slightly and now account for less than half of investor purchases at 46% in June.

Mid-sized investors (those who retain 11-99 properties) have stayed constant, oscillating around 35% percent in the past 30 months.

The pandemic seemed to drive away large investors, but they are now making up their largest share of investor purchases seen in the past decade.

If you have been outbid on a home there’s nearly a 1 in 4 chance it was to an investor or group of investors.

*  *  *

Like these reports? If so, please Subscribe to MishTalk Email Alerts.


Tyler Durden
Sat, 10/16/2021 – 16:30

via ZeroHedge News https://ift.tt/3j4a3n9 Tyler Durden