It’s 2020 and the leadership of the Democratic Party still cannot get it together on marijuana legalization, which two-thirds of Americans support.
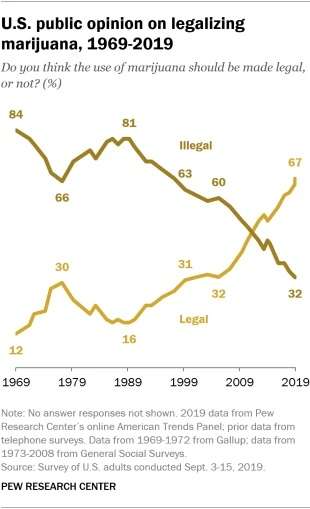
According to Pew polling data, support for full legalization crossed the 50 percent threshold back in 2010 and has been growing ever since. Much like support for gay marriage recognition, this seems to be a permanent cultural shift in attitudes.
But unlike the Democratic Party’s embrace of gay marriage, its leadership cannot seem to line up behind marijuana legalization, even as the Black Lives Matter and criminal justice reform movements highlight precisely how the drug war has led to the overpolicing and harassment of black communities.
Marijuana Moment reports that on Monday the Democratic National Committee rejected an amendment to put a plank supporting marijuana legalization into the party’s platform. The final vote against, 50-106, is almost a perfect inversion of the two-thirds of the public who want legalization.
Instead, Marijuana Moment reports, the platform will retain language that Democratic nominee and former Vice President Joe Biden hammered out with a criminal justice task force that included Sen. Bernie Sanders’ (I–Vt.) supporters. It stops short of marijuana legalization but does call for federal reforms:
“Democrats will decriminalize marijuana use and reschedule it through executive action on the federal level. We will support legalization of medical marijuana, and believe states should be able to make their own decisions about recreational use. The Justice Department should not launch federal prosecutions of conduct that is legal at the state level. All past criminal convictions for cannabis use should be automatically expunged.”
It’s nice that the Democrats say that the Justice Department “should not launch federal prosecutions,” but that’s fundamentally meaningless as a policy proposal. Remember all the screaming that President Donald Trump has too much influence over a Justice Department some believe should be operating independently? Shifting marijuana so that it’s in a less restrictive schedule in the Controlled Substances Act will still give the Justice Department plenty of reasons to go after marijuana users and dealers should they choose to.
And while the Justice Department isn’t a huge driver of marijuana arrests and prosecutions these days, it does still happen, particularly when people are caught trying to transport marijuana across state lines from states where it has been legalized to states where it has not been. Just in June, for example, the Drug Enforcement Administration filed federal charges against an attorney they caught allegedly conspiring to fly cannabis oil across the country from California in a private Learjet for sale elsewhere. The man now faces a mandatory minimum sentence of five years in prison if convicted.
On the state and local level, marijuana offenses still account for 40 percent of drug-related arrests. And the vast majority of those arrests (more than 90 percent) are for possession, not manufacture or sale.
These aren’t small numbers, but Biden, after all these years, is still resistant to full marijuana legalization. He brags about being a leader in publicly embracing gay marriage, reversing his old position against it and embracing it in 2012—even before President Barack Obama would publicly do so.
But with marijuana, Biden’s historical support of harsh criminal justice tactics has weakened but not faded. And it appears that the Democratic leadership is unwilling to force Biden to accept the reality that Americans would strongly prefer marijuana to be fully legalized, not just decriminalized. While decriminalization is an improvement, it leaves in place mechanisms for unequal enforcement, and research shows that black people are more likely to still be arrested or punished for marijuana possession than white people in states where marijuana has only been decriminalized. And overall, according to the American Civil Liberties Union, marijuana arrest rates in states where the drug has been decriminalized are about eight times higher than in states where it has been fully legalized.
The federalist component of the platform is laudable from a libertarian perspective,if for no reason other than continued state-level legalization shows that the world isn’t ending in states that have given the citizenry permission to toke up. Their successes should make other states less afraid to follow suit. It’s not unlike how state-level recognition of gay marriage showed that it was ultimately not a big deal and as the public saw more of these relationships and families, resistance largely crumbled away.
Nevertheless, it’s absurd for the Democratic Party to want to use the current activism for criminal justice and police reform as a contrast to Trump’s cheerleading for crackdowns, but they can’t even force Biden to accept the simplest and most popular of drug war reforms that will—in very profound and important ways—reduce overpolicing of black communities.
from Latest – Reason.com https://ift.tt/304ajt4
via IFTTT
[This is a serialization, with slight updates, of my 2012 article on the subject; for the Introduction (which also discusses my ambivalence about such laws), see this post.]
We’re finishing the discussion of state laws protecting employee speech with the narrowest ones, which are limited to signing petitions or contributing to campaigns. (All states also ban employer retaliation based on how a person voted.)
[A.] Signing Initiative, Referendum, Recall, or Candidate Petitions—Arizona, D.C., Georgia, Iowa, Minnesota, Missouri, Ohio, Oregon, Washington
These laws are narrow, but have become especially relevant given the recent debates about retaliation against people who signed anti-same-sex marriage initiative petitions. For an explanation of why the laws that ban threats and intimidation, without mentioning employment, likely apply to threats of dismissal for employment, see item 8 of this post.
Arizona: A person who … threatens any other person to the effect that the other person will or may be injured in his business, or discharged from employment, or that he will not be employed, to sign or subscribe, or to refrain from signing or subscribing, his name to an initiative or referendum petition [or recall] … is guilty of a … misdemeanor.
District of Columbia: Any person who … by threats or intimidation, interferes with, or attempts to interfere with, the right of any qualified registered elector to sign or not to sign any initiative, referendum, or recall petition, or to vote for or against, or to abstain from voting on any initiative, referendum, or recall measure … shall be [guilty of a misdemeanor].
Georgia: A person who, by menace or threat either directly or indirectly, induces or compels or attempts to induce or compel any other person to sign or subscribe or to refrain from signing or subscribing that person’s name to a recall application or petition … shall be guilty of a misdemeanor.
Iowa: A person commits the crime of election misconduct in the first degree if the person willfully … [i]ntimidates, threatens, or coerces, or attempts to intimidate, threaten, or coerce, a person … [t]o sign [or refrain from signing] a petition nominating a candidate for public office or a petition requesting an election for which a petition may legally be submitted.
Louisiana: No person shall knowingly, willfully, or intentionally … [i]ntimidate … directly or indirectly, any voter or prospective voter in matters concerning voting or nonvoting or voter registration or nonregistration, or the signing or not signing of a petition, including but not limited to any matter concerning the voluntary affiliation or nonaffiliation of a voter with any political party.
Minnesota: A person may not use threat, intimidation, coercion, or other corrupt means to interfere or attempt to interfere with the right of any eligible voter to sign or not to sign a recall petition of their own free will.
Missouri: [It shall be a misdemeanor o]n the part of any employer [to] mak[e], enforc[e], or attempt[] to enforce any order, rule, or regulation or adopt[] any other device or method to prevent an employee from … signing, or subscribing his name to any initiative, referendum, or recall petition, or any other petition circulated pursuant to law … .
Ohio: No person shall, directly or indirectly, by intimidation or threats, influence or seek to influence any person to sign or abstain from signing, or to solicit signatures to or abstain from soliciting signatures to an initiative or referendum petition.
Oregon: [No person may] directly or indirectly subject any person to undue influence [defined to include “loss of employment or other loss or the threat of it”] with the intent to induce any person to … [s]ign or refrain from signing a prospective petition or an initiative, referendum, recall or candidate nominating petition.
Washington: Every person is guilty of a gross misdemeanor who … [i]nterferes with or attempts to interfere with the right of any voter to sign or not to sign an initiative or referendum [or recall] petition or with the right to vote for or against an initiative or referendum measure [or recall] by threats, intimidation, or any other corrupt means or practice … .
These statutes are limited to discrimination based on making a contribution. (More states ban discrimination based on a refusal to make a contribution.)
Louisiana: No person based on an individual’s contribution, promise to make a contribution, or failure to make a contribution to influence the nomination or election of a person to [any political office] shall directly or indirectly affect an individual’s employment by means of [discrimination in favor or against the person in employment, or threat of such discrimination].
Massachusetts: No person shall, by threatening to [discriminate against or in favor of an employee] … attempt to influence a voter to give or to withhold his vote or political contribution. No person shall, because of the giving or withholding of a vote or a political contribution, [discriminate against or in favor of an employee].
Oregon: [No person may] directly or indirectly subject any person to undue influence [defined to include loss of employment or other loss or the threat of it] with the intent to induce any person to … [c]ontribute or refrain from contributing to any candidate, political party or political committee.
Louisiana also has a more general protection for political activity, discussed in an earlier post, which would likely include campaign contributions.
[C.] Exercising the “Elective Franchise” or “Suffrage,” Which Might Include Signing Referendum, Initiative, or Candidate Nominating or Recall Petitions—Hawaii, Idaho, Kentucky, Tennessee, West Virginia, Wyoming, and Guam
Some jurisdictions ban retaliation or threat of retaliation related to the “free exercise of the elective franchise” or to “suffrage.” This might just mean with regard to voting, a prohibition that would rarely be triggered because voting is now generally secret.
But it could also be read as extending to the signing of referendum or initiative petitions, and perhaps to other forms of political activity, such as signing candidate nominating or recall petitions. Thus, for instance, the Wyoming Supreme Court has described—albeit in a slightly different context—the signing of initiative and referendum petitions as “relat[ing] to the elective franchise.” Maryland’s highest court likewise concluded that “the right to have one’s signature counted on a nominating petition [for a candidate] is integral to that political party member’s right of suffrage[,]” which suggests that signing a referendum petition is also included within the right of suffrage. An Oregon Attorney General’s opinion took the same view as to the signing of recall petitions, as did an Ohio court decision (though with regard to the phrase “exercising [the] elective franchise”).
The Idaho Supreme Court concluded that “[t]he right of citizens to organize, and give expression and effect to their political aspirations through political parties is inherent in, and a part of, the right of suffrage.” The Nebraska Supreme Court held that “the right of persons to combine according to their political beliefs and to possess and freely use all the machinery for increasing the power of numbers by acting as a unit to effect a desired political end” is “[i]nherent[]” in the right to “exercise of the elective franchise.” And several cases have generally endorsed the proposition that “[t]he right of suffrage includes the right to form political parties.”
For an explanation of why the statutes that generally ban threats also likely apply to threats of loss of employment, see item 8 of this post.
Hawaii: Every person who, directly or indirectly, personally or through another, makes use of, or threatens to make use of, any force, violence, or restraint; or inflicts or threatens to inflict any injury, damage, or loss in any manner, or in any way practices intimidation upon or against any person in order to induce or compel the person to vote or refrain from voting, or to vote or refrain from voting for any particular person or party, at any election, or on account of the person having voted or refrained from voting, or voted or refrained from voting for any particular person or party; or who by abduction, distress, or any device or contrivance impedes, prevents, or otherwise interferes with the free exercise of the elective franchise [shall be deemed guilty of a crime].
Idaho: Every person who, by force, threats, menaces, bribery, or any corrupt means, either directly or indirectly attempts to influence any elector in giving his vote, or to deter him from giving the same, or attempts by any means whatever, to awe, restrain, hinder or disturb any elector in the free exercise of the right of suffrage … is guilty of a misdemeanor.
Kentucky: No person shall coerce or direct any employee to vote for any political party or candidate for nomination or election to any office in this state, or threaten to discharge any employee if he votes for any candidate, or discharge any employee on account of his exercise of suffrage … .
Pennsylvania: Any person or corporation who, directly or indirectly … by abduction, duress or coercion, or any forcible or fraudulent device or contrivance, whatever, impedes, prevents, or otherwise interferes with the free exercise of the elective franchise by any voter, or compels, induces, or prevails upon any voter to give or refrain from giving his vote for or against any particular person at any election … shall be guilty of a misdemeanor … .
Tennessee: It is unlawful to discharge any employee on account of such employee’s exercise or failure to exercise the suffrage, or to give out or circulate any statement or report calculated to intimidate or coerce any employee to vote or not to vote for any candidate or measure.
West Virginia: Any person who shall, directly or indirectly, by himself, or by any other person on his behalf, make use of, or threaten to make use of, any force, violence or restraint, or inflict, or threaten to inflict, any damage, harm or loss, upon or against any person, or by any other means attempt to intimidate or exert any undue influence, in order to induce such person to vote or refrain from voting, or on account of such person having voted or refrained from voting, at any election, or who shall, by abduction, duress or any fraudulent device or contrivance, impede or prevent the free exercise of the suffrage by any elector, or shall thereby compel, induce or prevail upon any elector either to vote or refrain from voting for or against any particular candidate or measure … [i]s guilty of a misdemeanor.
Wyoming: [Criminal intimidation] consists of [i]nducing, or attempting to induce, fear in an … elector by use of threats of force, violence, harm or loss, or any form of economic retaliation, for the purpose of impeding or preventing the free exercise of the elective franchise … .
Guam: Every person is guilty of a felony who, by force, threats, menace, bribery or any corrupt means, either directly or indirectly, attempts to influence any voter in giving his vote, or to deter him from giving it, or attempts by any means whatever to threaten, restrain, hinder, or disturb any voter in the exercise of the right of suffrage.
from Latest – Reason.com https://ift.tt/3hPxJIZ
via IFTTT
“Lies Spread Faster Than The Truth On Social Media” – Gates Slams COVID-19 Vaccine “Conspiracy Theories” Tyler Durden
Tue, 07/28/2020 – 12:28
Bill Gates insisted last week that ‘conspiracy theories’ involving the Gates Foundation and the Microsoft founder’s alleged hidden agenda to use vaccines as a cover for his nefarious micro-chipping project were utter nonsense. Apparently, Gates failed to grasp that this is exactly the kind of denial that a villainous billionaire might give.
Whether or not you take the Gates-related ‘conspiracy theories’ seriously, the Microsoft founder clearly sees them as enough of an annoyance that he felt compelled to address the trend again during a Tuesday morning appearance on CNBC.
Responding to a question from interviewer Andrew Ross Sorkin about social media’s role in spreading the conspiracies, Gates on Wednesday denied conspiracy theories that accuse the tech mogul and philanthropist of wanting to use coronavirus vaccines to implant tracking devices in people, and also said he hoped that the public’s understanding of “the truth” would improve as the world gets closer to a vaccine.
“Very incorrect things that are very titillating…can spread much faster than the truth on social media, and we’ve always seen that with vaccines….social media can make that even worse…these social media companies can see what is being said on their platform and take things that are absolutely wrong and remove those things from the platform.”
“How you divide that up, and draw that line…these are complex issues. It has been a spreader of lot of things…and how do you strike a balance?”
Would Gates take a harder line, the Sork asked, citing Mark Zuckerberg’s commitment to be “all over” this type of misinformation.
Gates responded that Facebook can’t intervene on Whatsapp since communications between users are encrypted. “Is that appropriate?” Gates said, expressing some skepticism about the risk of fostering criminal activity, though he said he doubted it would come up in tomorrow’s hearing.
Asked to weigh in on the anti-trust push targeting Silicon Valley, Gates offered a mealymouthed response that was tantamount to a soft-endorsement of the status quo as far as ‘Big Tech’ is concerned.
“I do think people underestimate that natural competitive forces do come into this space…as mobile phones came in that was very competitive…even without massive regulation, there will be a lot of innovation,” Gates said.
Is that really a surprise? After all, Gates and his wife may have donated nearly $2 billion to the vaccine research cause over the past few months. Gates insists that all he wants is to help defeat the coronavirus, and that may be true. But intelligent, capable people can still fall victim to their own biases. And whether a vaccine will ultimately bring about the end of the global pandemic still remains to be seen.
In February, the Bill and Melinda Gates Foundation said it was donating $100 million to vaccine research and treatment efforts for the coronavirus. It was announced as part of the WHO’s request for $675 million in contributions to fight the spread of the virus. In June, the foundation pledged an additional $1.6 billion to the Gavi vaccine alliance, an organization focused on efforts to immunize children amid the coronavirus pandemic.
But whatever Gates hoped to accomplish with these responses, adding his voice to the growing chorus of people calling for expanded censorship on social media certainly isn’t going to help dissuade his critics.
If anything, that just leads to unnecessary controversies like this:
via ZeroHedge News https://ift.tt/3fbYyVH Tyler Durden
Fortunes rise and fall fast in ocean shipping. Easy come, easy go. Case in point: Dry bulk spot rates were surging throughout June and the first week of July. Today, they’re on a steep slide.
“Levels for the big ships are spiraling downward,” brokerage Fearnleys wrote in its weekly report.
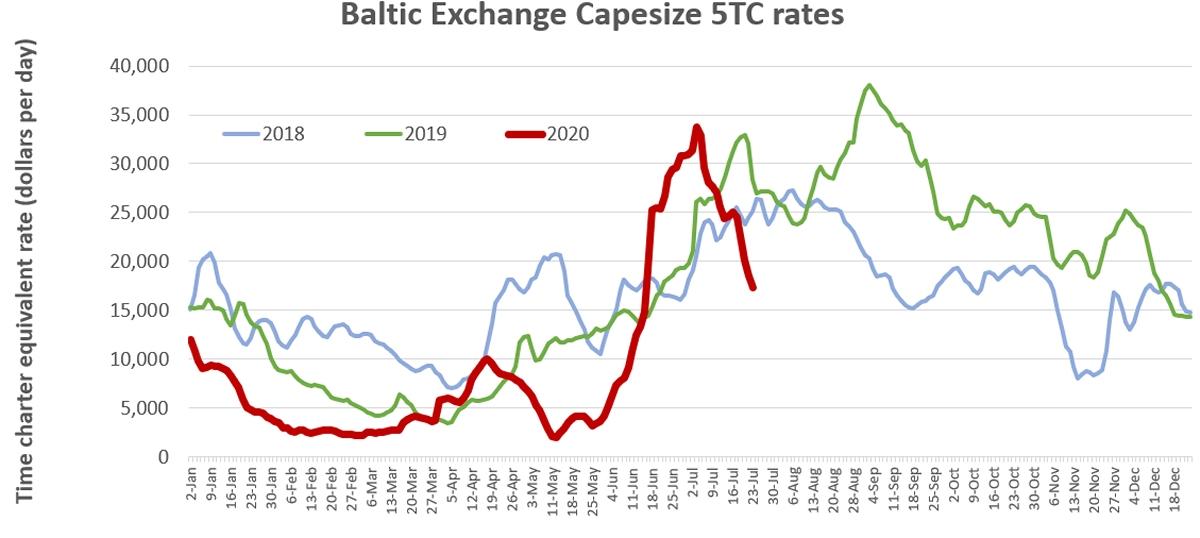
Rates for Capesize bulkers (ships with capacity for around 180,000 deadweight tons or DWT) were down to $17,300 per day on Friday, according to Clarksons Platou Securities. That’s about half the recent peak of $33,800 per day on July 6 and down 39% year-on-year. Listed owners of Capesizes include Star Bulk, Golden Ocean, Genco Shipping & Trading and Seanergy.
Rates for Panamaxes (65,000-90,000 DWT), the vessel type used to transport bulk U.S. farm exports, are down to $11,400 per day, 40% below where they were a year ago.
Bullish backdrop
Two trades largely drive Capesize rates: Australia-China and Brazil-China iron-ore transport. Rates hinge on how many Capes are in one basin versus the other, and how much iron-ore volume comes out of Australia versus Brazil.
The fall in dry bulk rates is happening amid seemingly bullish news. First, there’s a massive congestion pileup at Chinese ports. Congestion takes ships out of the spot market.
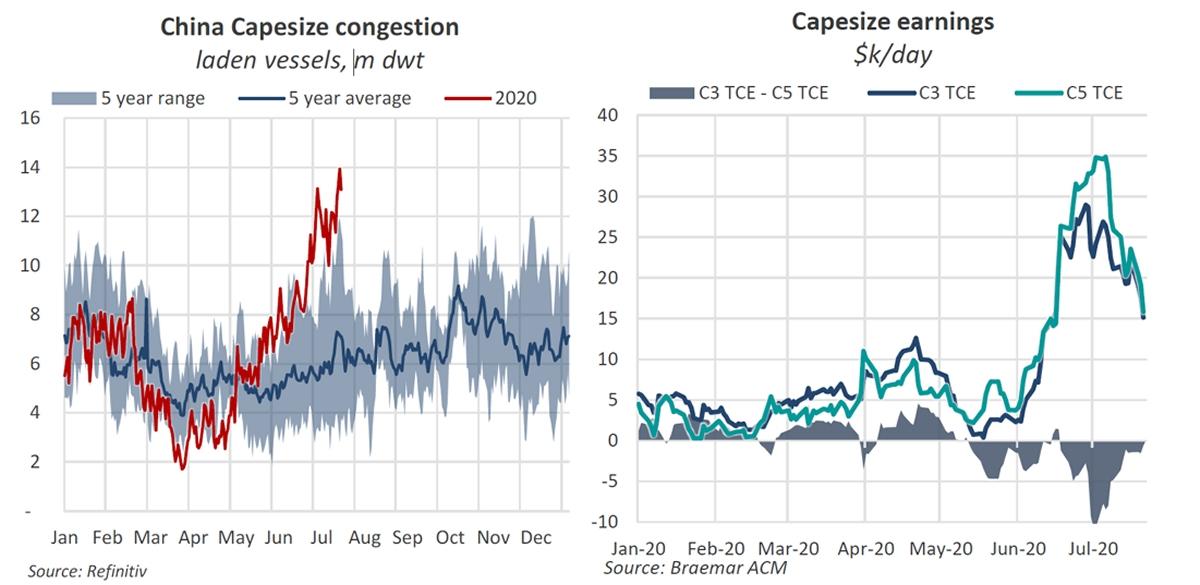
Braemar ACM Shipbroking, using vessel-position data from Refinitiv, calculated that laden Capesize tonnage waiting to discharge in China reached 13.9 million DWT at the beginning of this week. That is the highest level recorded since vessel-position data has been available and almost quadruple 2019 levels.
FreightWaves asked Nick Ristic, lead dry cargo analyst at Braemar ACM Shipbroking, why Cape rates have fallen despite all this. “I think it boils down to the fact that the Australian shippers were pumping out as much volume as possible at high prices in June, ahead of the end of the Aussie financial year — for most of them — and before scheduled maintenance in July,” he explained.
“The supply of Capes that could cover these dates thinned out pretty quickly, hence the hefty premium they commanded. The worries over supply of freshly crewed ships following the crewing regulation announcement [in Australia] also temporarily drove a premium for some vessels.”
On the rate drop that followed, he said: “The pace of Australian shipments dipped and there didn’t seem to be the scramble for tonnage that we saw in June.”
Concerns over crew-regulation delays in Australia “eased pretty quickly,” he added.
“China queues have increased, but so has the number of ships discharging, and then rejoining the Pacific market,” he continued.
The number of spot ships available in the Pacific was also boosted by what was going on in the Atlantic.
In early July, Capes on the Brazil-China route earned $10,000 per day less than those on the Australia-China run. Owners previously had little incentive to “ballast” (sail empty) all the way to the Atlantic Basin. This left more ships competing for cargo in the Pacific.
In recent weeks, rates in the Pacific Basin have been weighed by too much ship capacity. Rates have fallen in the Atlantic Basin for a different reason: too few cargoes.
S&P Global Platts told FreightWaves, “In the Atlantic, Capesize markets have seen scant activities … [and] most participants said freight rates were yet to find the floor.”
What’s next for rates?
According to Ristic, “Pacific charterers seem well supplied for now and voyage rates are no longer paying a premium to those on C3 [Brazil-to-China route].”
“What happens next depends on Australian volumes,” he opined. “We’re seeing an uptick in the number of ships heading to the Atlantic, which will likely weigh rates there. But if Chinese demand remains strong and Australian shippers decide to ramp up output again, we could see another squeeze on available Pacific ships.”
According to Breakwave Advisors, “Turnarounds in freight rates are impossible to predict or time well. Yet if one uses last year as a blueprint, one should expect the spot market to bottom over the next couple of weeks and turn back up as we enter the month of August.”
Chart data: Baltic Exchange
To scrub or not to scrub
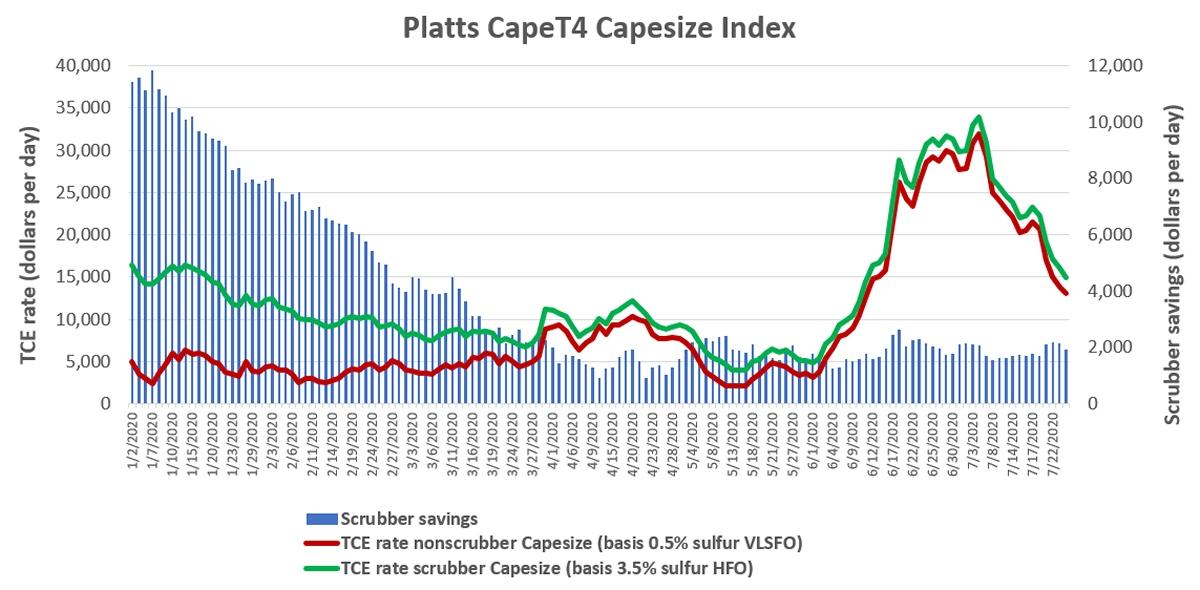
Meanwhile, daily rate assessments from the Platts CapeT4 Index show a curious new phenomenon. Rates on Friday for Capes with exhaust scrubbers were 9% below where they were on Jan. 2, whereas rates for nonscrubber Capes were up 164%.
Chart data: S&P Global Platts
The reason relates to how the time-charter equivalent rate is calculated. Shippers price spot cargoes in dollars per ton. To obtain the TCE, that price is converted to dollars per day, net of voyage costs including fuel. Thus, the more expensive fuel is, the lower the TCE.
Starting in January, the IMO 2020 rule required ships without scrubbers to burn more expensive 0.5% sulfur fuel called very low sulfur fuel oil (VLSFO). Scrubber ships could continue to burn cheaper 3.5% sulfur heavy fuel oil (HFO).
VLSFO was much more expensive than HFO in January, meaning that the TCE for nonscrubber ships was much lower than scrubber ships. According to Platts data, scrubber Cape TCEs in early January were as much as $11,800 per day above nonscrubber Cape TCEs.
The base rate earned by Capesizes has improved significantly since the seasonally weak period in early January. This explains why nonscrubber Capes are earning about $8,000 per day more than they were at the beginning of the year. But for scrubber Capes, the increase in the base rate has been more than offset by the decrease in the scrubber premium, explaining why their TCE rates are down about $1,400 per day since Jan. 2.
via ZeroHedge News https://ift.tt/3hKhjkQ Tyler Durden
Chicago Mayor Now Blames ‘Guns From Other States’ For Horrific Violence Tyler Durden
Tue, 07/28/2020 – 11:45
As Chicago continues to experience an explosion in crime, mayor Lori Lightfoot has found a new bogeyman to blame; guns from out of state (and not those firing them).
“Our gun problem is related to the fact that we have too many illegal guns in our streets — 60% of which come from states outside of Illinois,” Lightfoot said during a Sunday interview with CNN.
Chicago Mayor Lightfoot: “We are being inundated with guns from states that have virtually no gun control, no background checks, no ban on assault weapons — that is hurting cities like Chicago.” pic.twitter.com/vGLKClYHYW
And according to NBC Chicago, shootings in June were up 75% vs. 2019, while murders rose by 78% during the same period.
Lightfoot – who just admonished Chicago police for asking Trump to help ‘bring back civility’ to the Windy City – has received pushback from community leaders and experts – such as Cure Violence CEO Gary Slutkin, who told TIME that the police “might be able to reduce the flow [of illegal weapons] slightly or temporarily by collecting guns off the streets, but there is no demonstration of it being truly effective.”
So, the mayor of one of the country’s most violent cities is now blaming guns for said violence, and won’t allow federal officials into the city to keep the peace.
“We can’t just allow anyone to come into Chicago, play police in our streets, in our neighborhoods, when they don’t know the first thing about our city. That’s a recipe for disaster. And that’s what you’re seeing playing out in Portland on a nightly basis,” Lightfoot told CNN.
It’s always somebody else’s fault, and help is not wanted.
via ZeroHedge News https://ift.tt/3jM6KQ8 Tyler Durden
Among the criticisms of the deployment of Customs and Border Protection (CBP) officers to Portland is that CBP is one of the more problem-ridden federal law enforcement agencies.
CBP, the nation’s largest civilian law enforcement agency with roughly 60,000 employees, has higher termination rates than other federal law enforcement agencies, lower recruiting standards, longstanding corruption problems, and a well-documented toxic culture.
Here’s another small but notable data point:
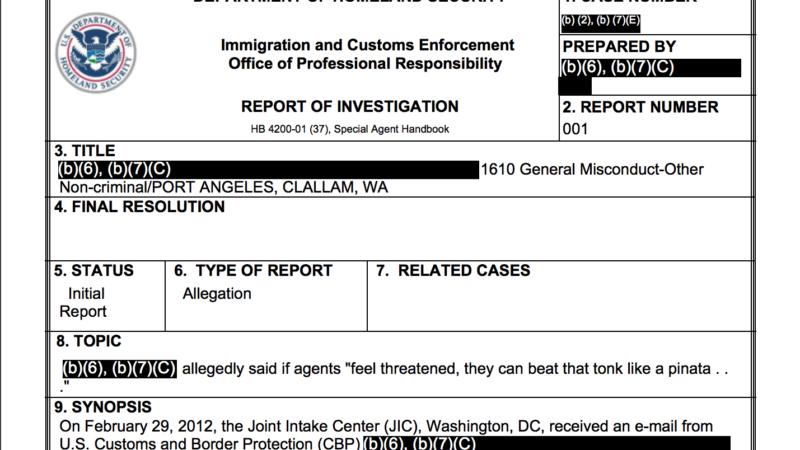
A CBP official was referred to internal affairs investigators for allegedly telling a room full of supervisors in 2012 that if Border Patrol agents feel threatened by a migrant, they should “beat that tonk like a piñata until candy comes out.”
A CBP use-of-force instructor emailed the Immigration and Customs Enforcement Office of Professional Responsibility (OPR), which handles internal affairs for CBP, on Feb. 29, 2012, to report the potential misconduct. The complaint generated an OPR investigation report, recently obtained by Reason through a Freedom of Information Act (FOIA) request.
The instructor wrote that at a supervisors meeting the official, whose name was redacted, said during a discussion on assaults against Border Patrol agents, “you tell all the guys that if they feel threatened, they can beat that tonk like a piñata until candy comes out.”
“Tonk” (sometimes spelled “tonc”) is a slang CBP term for a migrant. It allegedly refers to the sound of hitting someone on the head with a flashlight, although some Border Patrol defenders claim it is an acronym for “Territory of Origin Not Known.”
Last year, federal court records showed that a Border Patrol agent in Nogales, Texas, accused of hitting a Guatemalan migrant with his truck frequently used the word “tonk,” among other descriptors like “mindless murdering savages” and “disgusting subhuman shit unworthy of being kindling for a fire.” The agent, Matthew Bowen, was sentenced to probation for deprivation of rights under color of law.
Rolling Stone, in a story about the case against Bowen, described the history of the term:
A federal court case from 2004, which also centered on accusations of excessive force by the Border Patrol, includes an agent’s definition of “tonk” as “the sound heard when a ‘wetback’ is hit over the head with a flashlight.” Josiah Heyman is the chair of the anthropology department at the University of Texas, El Paso. In research on the border, he’s heard Border Patrol agents use the term “tonk” since the early 1990s. “That’s their position in the hierarchy,” he says of undocumented migrants in relation to Border Patrol agents. “They’re hittable people.”
The word also popped up in a secret Border Patrol Facebook group, unearthed by ProPublica, that was full of jokes about migrant deaths and vulgar, sexual memes about Rep. Alexandria Ocasio-Cortez (D–N.Y.). CBP announced earlier this month that four Border Patrol agents had been fired over their posts on the Facebook group.
A CBP spokesperson toldMother Jones last year that, “there is no clear answer on where the term originated or if it was once considered an acronym, but flatly, it is now considered a derogatory term and CBP does not condone its use.”
But the complaint against the CBP official wasn’t concerned with the word so much as his encouraging illegal and excessive force against migrants.
“I, being a use of force instructor, told him that I didn’t believe that that was within the use of force policy, and I cited the use of force continuum in an attempt to clarify the issue,” the instructor’s email to OPR said. “I told him that there are indicators that can help determine if someone will become assaultive, like the thousand yard stare, but that in itself does not meet the criteria for aggressive assaultive behavior. He told me that it did and, within the confines of the supervisor meeting taking place, I relented to keep the meeting moving.”
“I believe that his statement undermines the use of force policy,” the instructor continued, “and could lead our agents into possible litigation if it is his wish that we preach this philosophy to the agents.”
Reason filed the FOIA request to see if any CBP internal investigations had ever mentioned the term. (Silly me, I requested internal affairs records between 2012 and 2019, but CBP didn’t even have an internal affairs department until 2014—11 years after it was established.)
The OPR report does not say how the case was resolved, or whether the CBP official was disciplined. CBP’s public affairs office did not immediately respond to a request for comment.
from Latest – Reason.com https://ift.tt/39CpGfm
via IFTTT
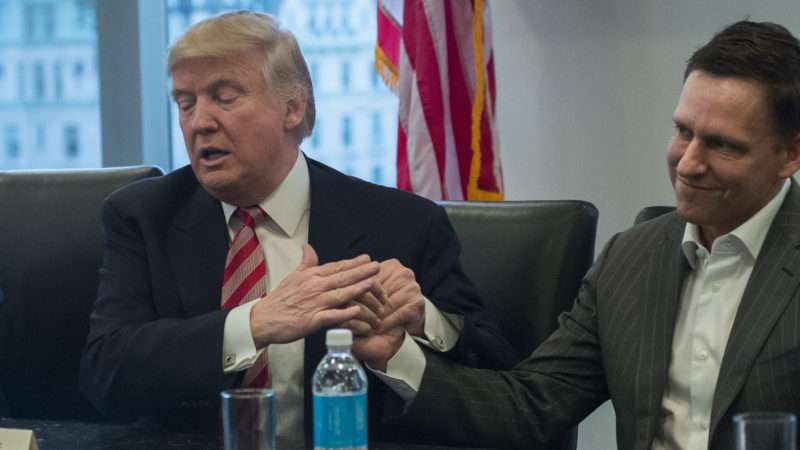
Kris Kobach, the former Kansas secretary of state, is seeking the GOP nomination to replace retiring Republican Pat Roberts in this year’s race for Roberts’ U.S. Senate seat. And he has to thank for his campaign’s viability an $850,000 investment from controversial tech billionaire Peter Thiel.
“I think the money that that super PAC is putting into the race—primarily through this one rich guy—is absolutely the lifeblood of the pro-Kobach campaign at this moment,” Patrick Miller, a political scientist at the University of Kansas, told Recode. “You take that money away and Kobach doesn’t have a lot of campaign left.”
That Thiel—often identified, including by himself, as a libertarian—is dedicating himself to a candidate whose primary obsession is immigration restriction is a further sign of the tumultuous swirl of hypernationalism pushed by and surrounding Thiel (and discussed at length in a story in the August/September issue of Reason, now available online to subscribers).
Unnamed friends of Thiel tell Recode that Thiel “has a really strong preference for people who stick their middle finger up to the status quo and conventional wisdom. There is nobody who I think was more obviously sticking his middle finger up at conventional wisdom quite like Kris Kobach.”
Thiel’s interest in Kobach is likely rooted in the same reasons he was enthusiastic about Trump. Kobach was one of the minds behind Trump’s Muslim registry and his unrepentant anti-immigration views mark him as perhaps Trumpier than Trump. (Kobach believes COVID-19 death numbers are being manipulated up to harm the president, for one.) Trump endorsed Kobach in his failed attempt to become governor of Kansas in 2018, and Thiel began funding Kobach during that race. Fellow disillusioned Trump superfan and immigration-hater Ann Coulter co-hosted a Kobach fundraiser in Thiel’s New York apartment.
Recode reports that Thiel has “cut at least three successive checks to [a pro-Kobach PAC called Free Forever], the most recent for a half-million dollars last month.” The PAC has “spent more than four times what Kobach’s campaign itself has spent on television and radio ads…The heavy amount of mailers sent by the PAC have run the gamut of attacking [Republican challenger Roger] Marshall as ‘anti-American’ for being insufficiently tough on immigration, alleging that he voted to fund ‘Rosie O’Donnell summer camp,’ ‘global warming musicals,’ and ‘transgender plays,’ and promising that Kobach will ‘stop the next Ruth Bader Ginsburg.'”
Thiel’s other candidate donations this year are going to another super immigration hawk, and advocate of sending in federal troops to quell protesters, Arkansas Sen. Tom Cotton.
Kobach is also one of the leading voices claiming American elections are rife with fraud and had his attempt to fight it when he was Kansas’ secretary of state overturned in 2018 by a federal judge who questioned the reality of the problem Kobach was allegedly solving.
Among the criticisms of the deployment of Customs and Border Protection (CBP) officers to Portland is that CBP is one of the more problem-ridden federal law enforcement agencies.
CBP, the nation’s largest civilian law enforcement agency with roughly 60,000 employees, has higher termination rates than other federal law enforcement agencies, lower recruiting standards, longstanding corruption problems, and a well-documented toxic culture.
Here’s another small but notable data point:
A CBP official was referred to internal affairs investigators for allegedly telling a room full of supervisors in 2012 that if Border Patrol agents feel threatened by a migrant, they should “beat that tonk like a piñata until candy comes out.”
A CBP use-of-force instructor emailed the Immigration and Customs Enforcement Office of Professional Responsibility (OPR), which handles internal affairs for CBP, on Feb. 29, 2012, to report the potential misconduct. The complaint generated an OPR investigation report, recently obtained by Reason through a Freedom of Information Act (FOIA) request.
The instructor wrote that at a supervisors meeting the official, whose name was redacted, said during a discussion on assaults against Border Patrol agents, “you tell all the guys that if they feel threatened, they can beat that tonk like a piñata until candy comes out.”
“Tonk” (sometimes spelled “tonc”) is a slang CBP term for a migrant. It allegedly refers to the sound of hitting someone on the head with a flashlight, although some Border Patrol defenders claim it is an acronym for “Territory of Origin Not Known.”
Last year, federal court records showed that a Border Patrol agent in Nogales, Texas, accused of hitting a Guatemalan migrant with his truck frequently used the word “tonk,” among other descriptors like “mindless murdering savages” and “disgusting subhuman shit unworthy of being kindling for a fire.” The agent, Matthew Bowen, was sentenced to probation for deprivation of rights under color of law.
Rolling Stone, in a story about the case against Bowen, described the history of the term:
A federal court case from 2004, which also centered on accusations of excessive force by the Border Patrol, includes an agent’s definition of “tonk” as “the sound heard when a ‘wetback’ is hit over the head with a flashlight.” Josiah Heyman is the chair of the anthropology department at the University of Texas, El Paso. In research on the border, he’s heard Border Patrol agents use the term “tonk” since the early 1990s. “That’s their position in the hierarchy,” he says of undocumented migrants in relation to Border Patrol agents. “They’re hittable people.”
The word also popped up in a secret Border Patrol Facebook group, unearthed by ProPublica, that was full of jokes about migrant deaths and vulgar, sexual memes about Rep. Alexandria Ocasio-Cortez (D–N.Y.). CBP announced earlier this month that four Border Patrol agents had been fired over their posts on the Facebook group.
A CBP spokesperson toldMother Jones last year that, “there is no clear answer on where the term originated or if it was once considered an acronym, but flatly, it is now considered a derogatory term and CBP does not condone its use.”
But the complaint against the CBP official wasn’t concerned with the word so much as his encouraging illegal and excessive force against migrants.
“I, being a use of force instructor, told him that I didn’t believe that that was within the use of force policy, and I cited the use of force continuum in an attempt to clarify the issue,” the instructor’s email to OPR said. “I told him that there are indicators that can help determine if someone will become assaultive, like the thousand yard stare, but that in itself does not meet the criteria for aggressive assaultive behavior. He told me that it did and, within the confines of the supervisor meeting taking place, I relented to keep the meeting moving.”
“I believe that his statement undermines the use of force policy,” the instructor continued, “and could lead our agents into possible litigation if it is his wish that we preach this philosophy to the agents.”
Reason filed the FOIA request to see if any CBP internal investigations had ever mentioned the term. (Silly me, I requested internal affairs records between 2012 and 2019, but CBP didn’t even have an internal affairs department until 2014—11 years after it was established.)
The OPR report does not say how the case was resolved, or whether the CBP official was disciplined. CBP’s public affairs office did not immediately respond to a request for comment.
from Latest – Reason.com https://ift.tt/39CpGfm
via IFTTT
Kris Kobach, the former Kansas secretary of state, is seeking the GOP nomination to replace retiring Republican Pat Roberts in this year’s race for Roberts’ U.S. Senate seat. And he has to thank for his campaign’s viability an $850,000 investment from controversial tech billionaire Peter Thiel.
“I think the money that that super PAC is putting into the race—primarily through this one rich guy—is absolutely the lifeblood of the pro-Kobach campaign at this moment,” Patrick Miller, a political scientist at the University of Kansas, told Recode. “You take that money away and Kobach doesn’t have a lot of campaign left.”
That Thiel—often identified, including by himself, as a libertarian—is dedicating himself to a candidate whose primary obsession is immigration restriction is a further sign of the tumultuous swirl of hypernationalism pushed by and surrounding Thiel (and discussed at length in a story in the August/September issue of Reason, now available online to subscribers).
Unnamed friends of Thiel tell Recode that Thiel “has a really strong preference for people who stick their middle finger up to the status quo and conventional wisdom. There is nobody who I think was more obviously sticking his middle finger up at conventional wisdom quite like Kris Kobach.”
Thiel’s interest in Kobach is likely rooted in the same reasons he was enthusiastic about Trump. Kobach was one of the minds behind Trump’s Muslim registry and his unrepentant anti-immigration views mark him as perhaps Trumpier than Trump. (Kobach believes COVID-19 death numbers are being manipulated up to harm the president, for one.) Trump endorsed Kobach in his failed attempt to become governor of Kansas in 2018, and Thiel began funding Kobach during that race. Fellow disillusioned Trump superfan and immigration-hater Ann Coulter co-hosted a Kobach fundraiser in Thiel’s New York apartment.
Recode reports that Thiel has “cut at least three successive checks to [a pro-Kobach PAC called Free Forever], the most recent for a half-million dollars last month.” The PAC has “spent more than four times what Kobach’s campaign itself has spent on television and radio ads…The heavy amount of mailers sent by the PAC have run the gamut of attacking [Republican challenger Roger] Marshall as ‘anti-American’ for being insufficiently tough on immigration, alleging that he voted to fund ‘Rosie O’Donnell summer camp,’ ‘global warming musicals,’ and ‘transgender plays,’ and promising that Kobach will ‘stop the next Ruth Bader Ginsburg.'”
Thiel’s other candidate donations this year are going to another super immigration hawk, and advocate of sending in federal troops to quell protesters, Arkansas Sen. Tom Cotton.
Kobach is also one of the leading voices claiming American elections are rife with fraud and had his attempt to fight it when he was Kansas’ secretary of state overturned in 2018 by a federal judge who questioned the reality of the problem Kobach was allegedly solving.
Goldman Warns “Real Concerns Are Emerging” About The Dollar As Reserve Currency; Goes “All In” Gold Tyler Durden
Tue, 07/28/2020 – 11:28
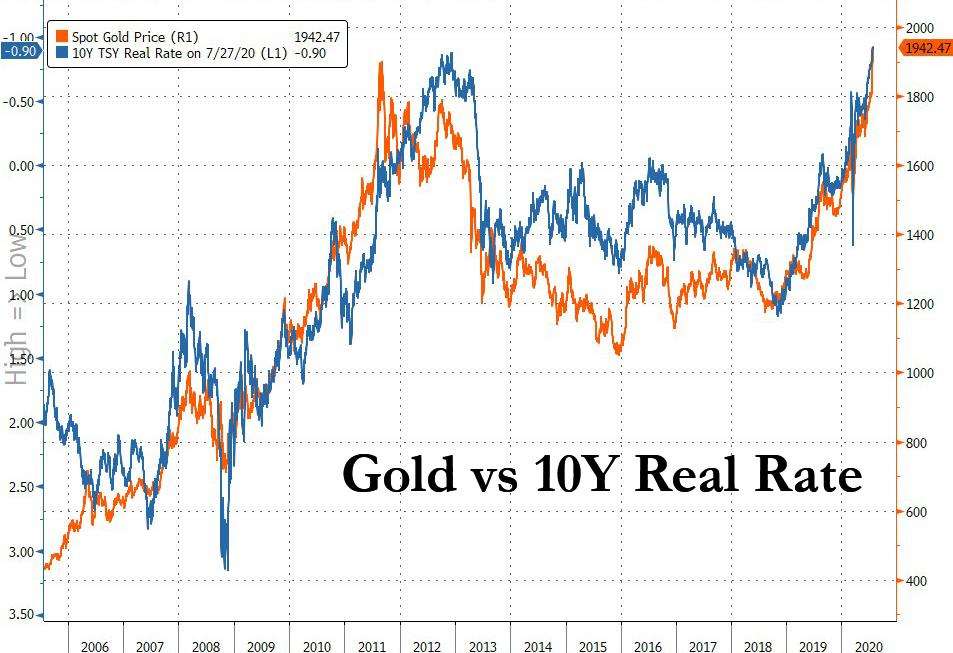
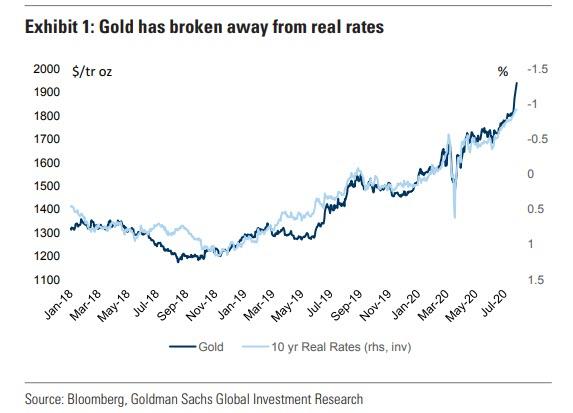
In his morning critique of goldbugs’ resurgent optimism about the future of gold, which has exploded alongside the price of precious metals, which in turn have been tracking the real 10Y rate tick for tick…
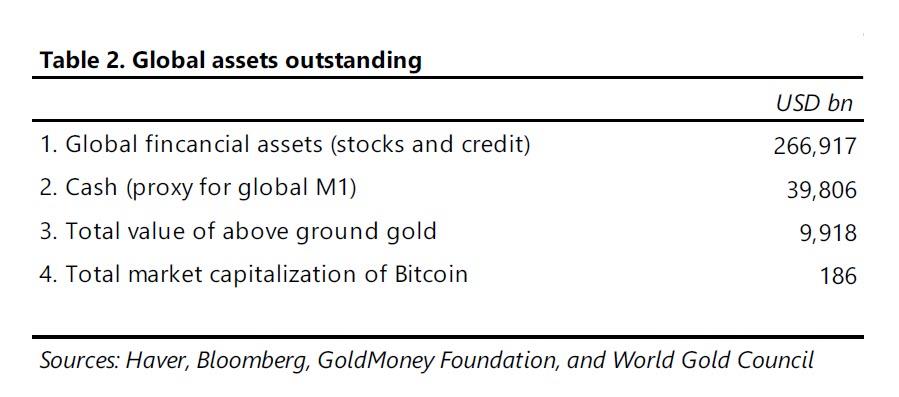
… Rabobank’s Michael Every argued from the familiar position of one who views the modern monetary system as immutable, and bounded by the “Venn Diagram” confines of the dollar as a reserve currency and financial assets as a bedrock of modern household wealth, of which as Paul Tudor Jones recently calculated, there is just over $300 trillion worth, compared to just $10 trillion in total gold value.
Indeed, according to Every, the surge in gold is meaningless because “if you buy gold, technically that is going to make you money. And yet that money is still going to be priced in US DOLLARS – and that gives the whole game away.”
Like fans of the England football team, gold fans can dream of the distant past when gold was the centre of the global monetary system; but they can keep dreaming if they think those days are ever going to return. Gold may be an appreciating asset, but all the evidence suggests that it won’t be one that is of any direct relevance to day-to-day life, finance, and business. Your currency won’t be tied to it. You won’t get paid in it. You won’t spend in it or save in it (other than to the switch back to US Dollars). You won’t be doing deals in it or importing in it.”
Yes but… what if your currency ends up getting tied to it? What if you do get paid in gold? What if you save in gold without any intention of switching back to dollars?
In short, what if the dollar is no longer the world’s reserve currency?
Impossible you say… well, we would disagree. After all, in a world where there is over $100 trillion in dollar-denominated debt which can not be defaulted on and thus must be inflated away, the “exorbitant privilege” of the dollar has become a handicap. But don’t take our word: here is Jared Bernstein, Obama’s former chief economist warning all the way back in 2014 in a NYT op-ed that the US Dollar must lose its reserve status:
There are few truisms about the world economy, but for decades, one has been the role of the United States dollar as the world’s reserve currency. It’s a core principle of American economic policy. After all, who wouldn’t want their currency to be the one that foreign banks and governments want to hold in reserve?
But new research reveals that what was once a privilege is now a burden, undermining job growth, pumping up budget and trade deficits and inflating financial bubbles. To get the American economy on track, the government needs to drop its commitment to maintaining the dollar’s reserve-currency status.
Agree or disagree with Bernstein’s ideology, never has his assessment about the state of the American economy been more accurate than it is now.
To be sure, since then there have been a handful of other “serious” economists suggesting that the only way the US economy can “reboot” itself and reset its economic engine is for the dollar to lose its currency status, but it is only in the past few days – when the dollar plunged and gold soared to new all time highs – that we have seen a barrage of Wall Street reports contemplating what until recently was viewed as impossible: a world where the dollar is not the reserve currency.
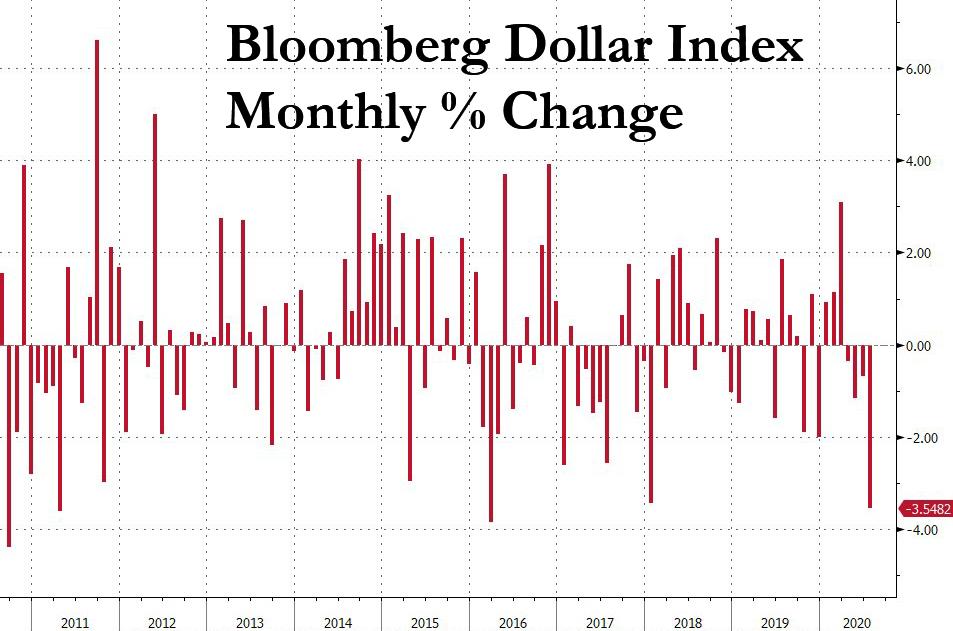
Meanwhile, after its explosive burst higher in March and April, the Bloomberg Dollar Spot Index is on course for its worst July in a decade. The drop comes amid renewed calls for the dollar’s demise following a game-changing rescue package from the European Union deal, which spurred the euro and will lead to jointly-issued debt.
Which brings us to this morning, when none other than the world’s most influential investment bank Goldman Sachs, by way of its chief commodity strategist Jeffrey Currie, wrote that “real concerns around the longevity of the US dollar as a reserve currency have started to emerge.”
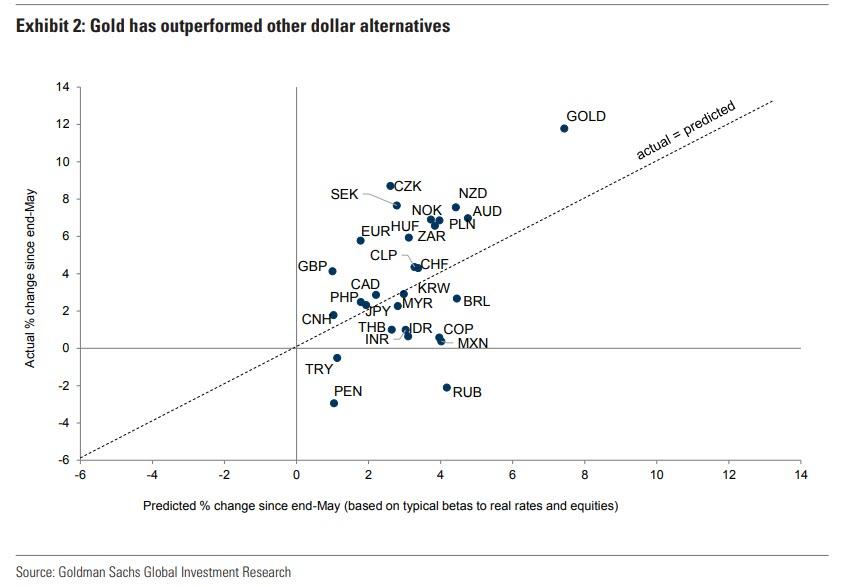
Specifically, Goldman looks at the recent surge in gold prices to new all-time highs which has “substantially outpaced both the rise in real rates…
… and other US dollar alternatives, like the Euro, Yen and Swiss Franc”…
… with Currie writing that he believes this disconnect “is being driven by a potential shift in the US Fed towards an inflationary bias against a backdrop of rising geopolitical tensions, elevated US domestic political and social uncertainty, and a growing second wave of covid-19 related infections.”
This, combined with the record level of debt accumulation by the US government, means that “real concerns around the longevity of the US dollar as a reserve currency have started to emerge.”
Then, Currie reminds his clients that he has “long maintained gold is the currency of last resort, particularly in an environment like the current one where governments are debasing their fiat currencies and pushing real interest rates to all-time lows, with the US 10-year TIPs at -92bp is 5bp below the 2012 lows,” and we indeed noted Currie’s reco to buy gold one day after the Fed went all-in on March 24.
Four months later, the urgency is even greater, and Currie writes that “with more downside expected in US real interest rates we are once again reiterating our long gold recommendation from March and are raising our 12-month gold and silver price forecasts to $2300/toz and $30/toz respectively from $2000/toz and $22/toz.”
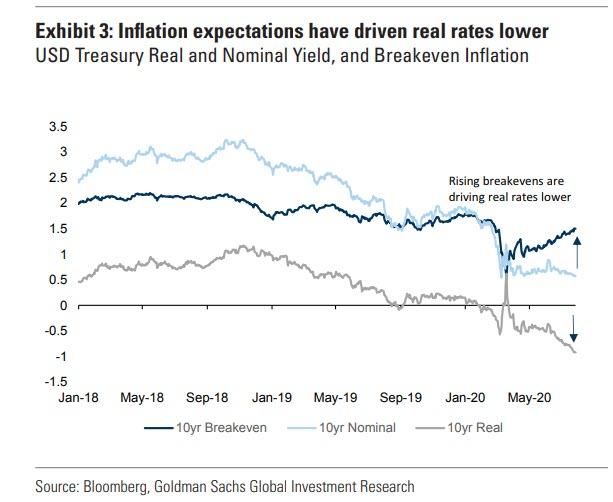
There are other reasons why Goldman believes that Gold’s surge is only just starting: “This relentless decline in real interest rates against nominal rates bounded by the US Fed has caused inflation breakevens to rise (see Exhibit 3) in an environment that would ordinarily be viewed as deflationary, i.e. a weakening US labor market as the country re-enters lockdown.”
This is bad, and is usually described by what may be the most loathed word in the banker lexicon: “stagflation.”
Which also explains the “irony” of the response: the greater the deflationary concerns that policymakers must fight today, the greater the debt build up and the higher the inflationary risks are in the future according to Currie, who expands further on this critical topic:
The deflationary shock caused by the pandemic drives the need to expand balance sheets to support demand today, as seen in the latest US $1.0 trillion Phase 4 stimulus and the €750 billion pan-EU recovery fund. The resulting expanded balance sheets and vast money creation spurs debasement fears which, in turn, create a greater likelihood that at some time in the future, after economic activity has normalized, there will be incentives for central banks and governments to allow inflation to drift higher to reduce the accumulated debt burden.
Indeed, this has already been seen in recent FOMC minutes, as discussions of explicit outcome-based forward guidance raises the prospect for Fed-sanctioned overheating of the economy.
And despite the longer-term nature of these risks, Goldman argues that “asset managers have real concerns today about persistent unanticipated shifts in inflation that can create large discrepancies between current expected real returns and actual realized returns” and this is manifesting itself in the continued faith in the dollar.
What about the gold price? Here is Currie’s explanation why gold will continue to surge:
The key point from a hedging perspective is that asset managers care about the level of inflation, not the changes in inflation, and from a level perspective, inflation hedges like commodities and equities are likely far cheaper today than in the future when inflation could arrive. When discussing the drivers of investment demand for gold and commodities, it is important to distinguish between debasement and inflation. The key is that the current debasement and debt accumulation sows the seeds for future inflationary risks despite inflationary risks remaining low today. While debasement in many cases leads to inflation, it is not always the case as witnessed over the past decade. Equally, the best debasement hedge (gold) is not always the best hedge against inflation (oil). Indeed, the word debasement comes from adding base metals like tin or copper to the precious metals that acted as hard currency; therefore, owning the pure precious metal is then the best hedge against debasement.
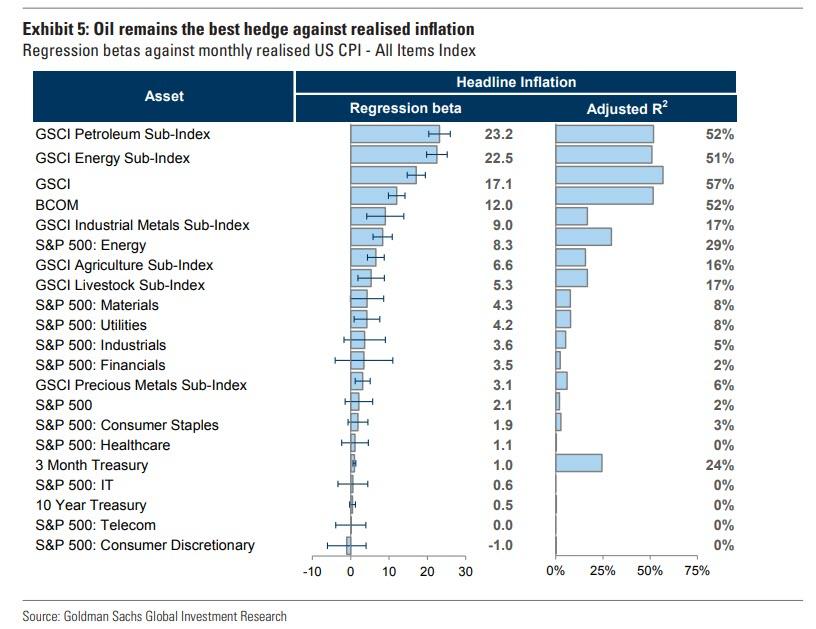
However, this does not mean gold is the best hedge against inflation — a common misconception of many investors. Gold doesn’t appear significantly in any CPI anywhere in the world. As a result, oil and other commodities that drive the items actually found in different CPIs are the best hedges against inflation. But
Next, Currie goes on to explain why oil may be the best pure play commodity hedge to inflation, “today the risk is from debasement of fiat currencies that sows the risk for inflation and gold is the best hedge against debasement. Further out as inflation risks rise, oil and equities hedge unexpected and expected inflation respectively better than gold (see Exhibit 5), and given the size of the bond portfolios built over the past decade that will need to be hedged against inflation risks, the sheer size of investment demand for commodities is likely to be massive, underscoring the need to act today. “
Hence, gold at $2,000 and soon… $3,000, $5,000 and much more. Indeed, even at $10,000/oz, the total value of gold would be just around $50 trillion, which is still orders of magnitude below the value of global financial assets that need to be hedged (and which according to Paul Tudor Jones is around $270 trillion).
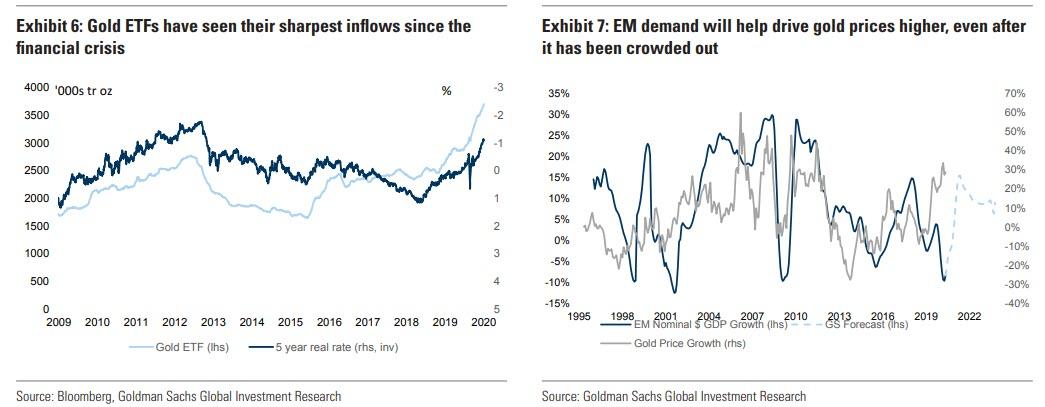
As Currie then notes, the result of this growing debasement risk is that “DM investment demand strength has continued with ETF additions in both Europe and US running high (see Exhibit 6). We see this trend persisting for some time as investment allocations into gold increase inline with allocations to inflation protected assets, similar to what happened after the financial crisis. Following the GFC, inflation fears peaked only at the end of 2011 as the bounce back in inflation ran out of steam, bringing the gold bull market to a halt. Similarly, we see inflationary concerns continuing to rise well into the economic recovery, sustaining hedging inflows into gold ETFs alongside the structural weakening of the dollar, we see gold being used as a dollar hedge by fund managers. Indeed, decomposing our gold forecast, with returns of 18% over the next 12 months, we estimate 9% of the growth is driven by 5yr real rates going to -2% over the next 12 month, (an est. elasticity of 0.1), while the second 9% comes from the 15% increase in the EM dollar GDP (an est. elasticity of 0.5) (see Exhibit 7).”
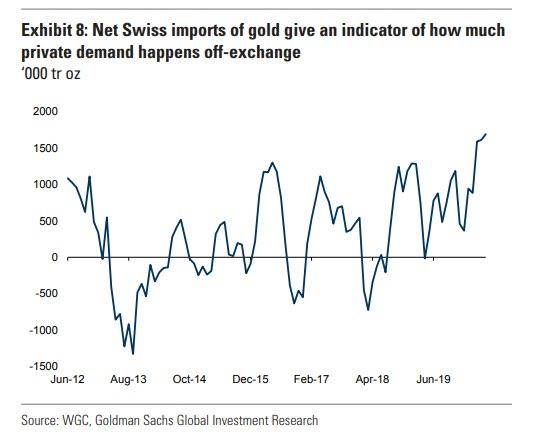
On top of these known flows, a large share of physical investment demand in gold is non-visible according to Goldman, in particular vaulted bar purchases by high net worth individuals. Looking at net Swiss imports one can see that gold stocks in Switzerland, where most of these private vaults are located, have been building at close to a record pace.
And in case that wasn’t enough, “the stretched valuations in equities, low real rates and high level of economic and political uncertainty all point toward continued inflows by high net worth individuals,” in Goldman’s view.
But wait there’s more, with Goldman singling out the potential of a fresh EM demand surge: Indian gold imports are still down 80% yoy in June and the Chinese gold premium is beginning to turn negative again (see Exhibit 9). More recently, however, the weakness in EM demand has been driven more by gold’s high price, as consumers cannot afford to buy gold products at those levels. However, EM currencies are no longer under pressure and India has begun to see the rupee strengthen over the past month. EM growth is also beginning to recover with EM activity entering positive YoY territory in June for the first time since January and our economists seeing the worst of
the EM outlook behind us (see Exhibit 10). EM retail investment demand is also boosted by easier monetary policy together with continued inflation driving EM real rates down. In India, policy rates fell below the YoY inflation rate for the first time since 2013.”
Taken together, and in light of the declining faith in the dollar as a reserve currency, Goldman believes that these factors create a perfect setup for a rebound in EM demand for gold similar to 2010-11:
We will likely see this demand materialize when price stabilizes somewhat and DM investment purchases slow down, creating more room for EM consumers. We feel that for now, investors should not be concerned by weak EM demand prints.
As a final point, Goldman also spared some love for silverbugs, raising its silver forecast to $30/toz on a 3/6/12 month horizon, “pulled upward by higher gold prices and better prospects for silver industrial demand, particularly in solar energy (c.15% of silver demand). Both the European Green Deal and Biden’s war on climate change plans imply a doubling every year of solar panel capacity installations in both the US and Europe. At the same time, silver demand in consumer electronics is benefiting from the transition to working from home as it is heavily used in consumer items such laptops, mobile phones and televisions. Even housing demand, where silver is used in light switches, looks to be better than expected with property sales in both US and China rebounding strongly. Silver has rallied almost 30% over the past few weeks but its ratio with gold is only back to its level at the beginning of this year of 80.”
Currie’s final point on silver:
Historically there has been a tight relationship between silver industrial demand and the gold-silver price ratio. If silver industrial demand next year is 5% higher versus its 2019 level, the gold-to-silver ratio would fall further to 77. Assuming this ratio, our $2300/toz gold target would imply a $30/toz silver price.
That sounds awfully familiar: oh yes, here’s why:
Average historical gold/silver ratio is 60. Means silver has to rise to $31 just to catch up to where it has been in the past. pic.twitter.com/3Lf5EQxFKy
 According to Pew polling data, support for full legalization crossed the 50 percent threshold back in 2010 and has been growing ever since. Much like support for gay marriage recognition, this seems to be a permanent cultural shift in attitudes.
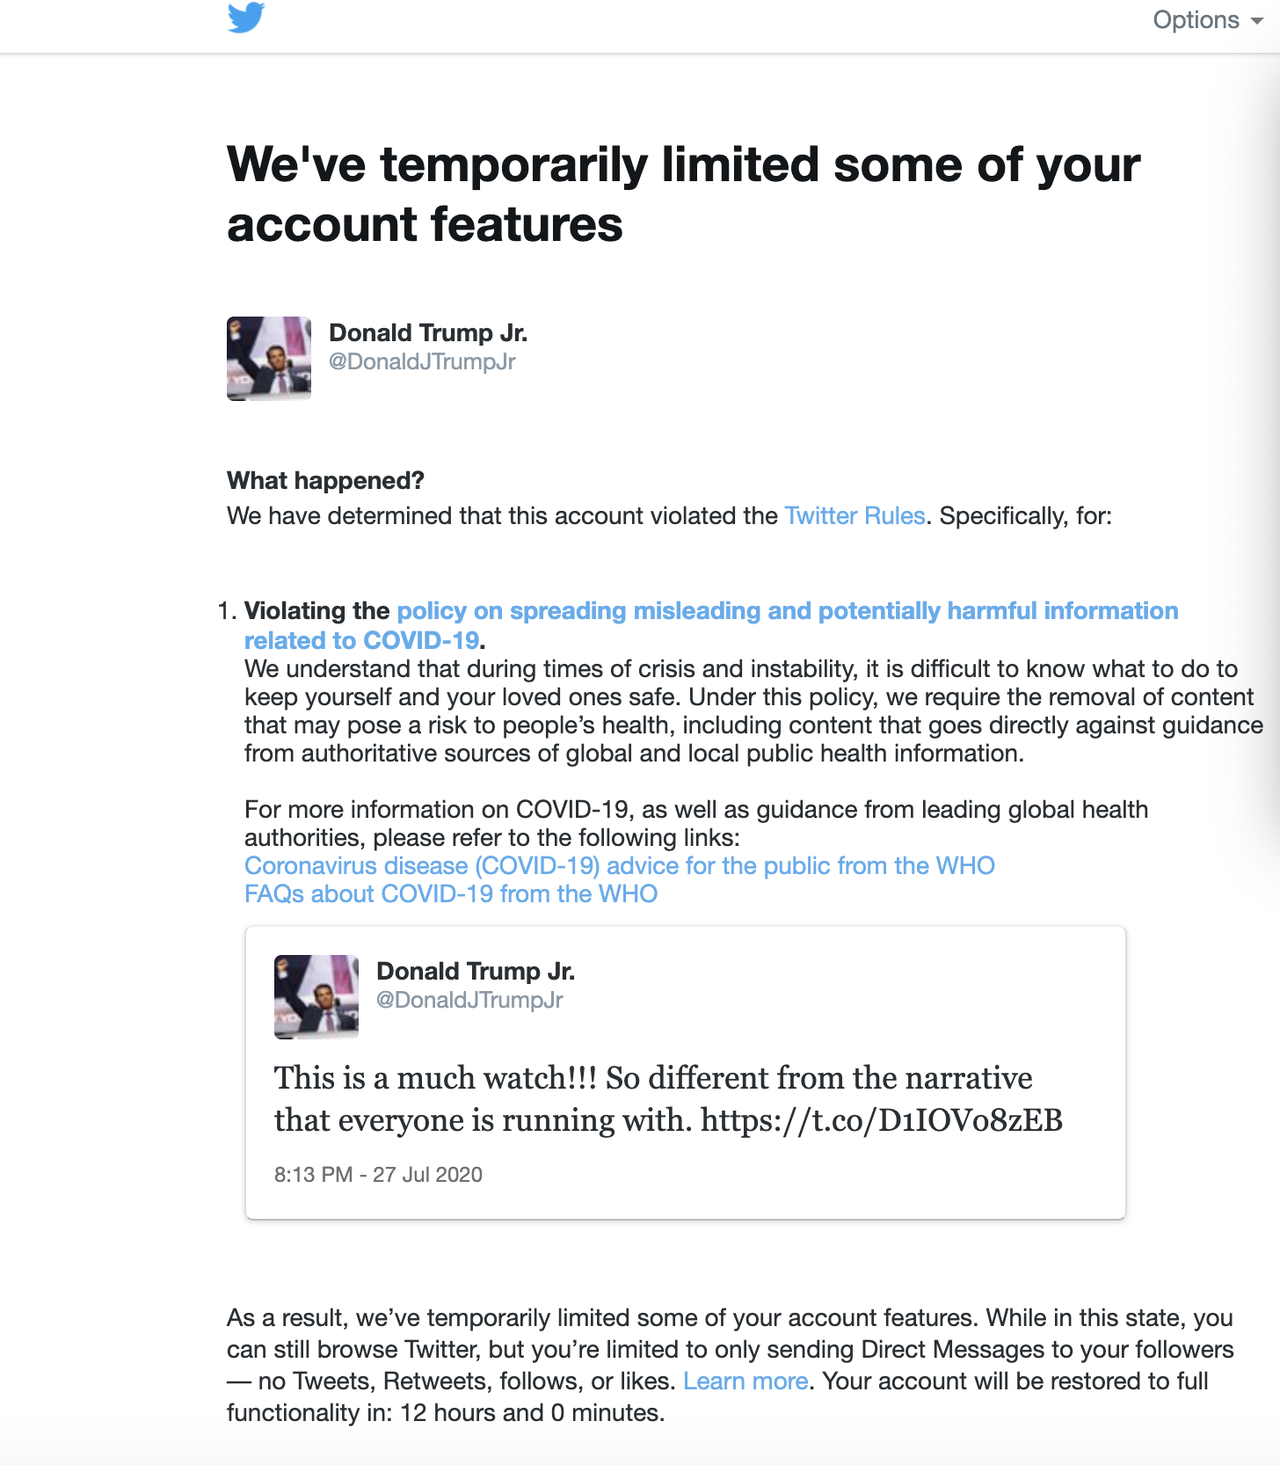


