Chinese Gold Imports: Better Data, Lower Inflows, Unanswered Questions

Submitted by Ronan Manly, BullionStar.com

In mid-August Reuters published a story titled ”China curbs gold imports as trade war heats up”, claiming that the Chinese authorities had been ”severely restricting gold imports since May” by reducing the monthly gold import quotas that are handed out to a group of Chinese and foreign banks by China’s central bank, the People’s bank of China (PBoC).

Speaking on Condition of Anonymity

Reuters said it had verified its claims by talking to seven unidentified ”sources in the bullion industry in London, Hong Kong, Singapore and China”, who in summary had said that ”quotas have been curtailed or not granted at all for several months”. According to the Reuters sources quoted, “there are virtually no import quotas now issued in China” and “next to nothing was imported by banks in June and July”. Quite dramatic if true.

These sources also speculated that the motive for the claimed gold import quota restrictions was to help limit the amount of money leaving the country amid a plunge in the value of the yuan”.

A week later on 22 August, Reuters published a follow-up article titled ”China eases restrictions on gold imports: sources”, claiming that its bullion industry sources, which by then consisted of ‘three people with direct knowledge of the matter in London and Asia”, were now saying that the PBoC  had ”began to  issue quotas again last week” but that these quotas were ”less than usual”. According to one of the sources some [gold import] quotas have been given”. According to another source, there had been a ”partial lift” of the quota restrictions.

Coincidentally, or even bizarrely as regards timing, the Reuters stories suggest that in the very week that Reuters claims the Chinese authorities were restricting gold import quotas, i.e. the week of 12 – 16 August, the very same Chinese authorities then decided to lift said gold import quota restrictions. Be that as it may, but there is a troubling feature of mainstream financial media articles such as these Reuters articles, and that is that it is impossible to verify the claims within the articles, for the very fact that the sources they use are not identified.

The use of unidentified sources, as Reuters seems so fond of using, begs the question, why? The answer, according to Reuters, is that these sources were ”speaking on condition of anonymity because they are not authorized to speak to the media”. So that’s ten sources in the bullion industry that Reuters used for its two articles, none of which are authorized to speak to the media, but all ten of which chose to breach their internal compliance rules and proceeded to speak to the media. Quite a record.

The 14 August Reuters story also contained the following quote about comparative Chinese gold import figures for various periods during 2019 and equivalent periods during 2018:

”Chinese customs figures show it imported 575 tonnes of gold in the first half of the year, down from 883 tonnes in the same period of 2018.

In May, China imported 71 tonnes, down from 157 tonnes in May 2018. In June, the last month for which data is available, the decline was even sharper, with 57 tonnes shipped compared with 199 tonnes in June last year.”

Running the Numbers

While we can’t verify the anonymous sources used by Reuters for obvious reasons, i.e. they are anonymous, we can however verify the import figures that Reuters quotes, using recently published Chinese gold import data. This is because in late 2018, Chinese customs authorities in quite an interesting move, began publishing granular monthly data of both China’s non-monetary gold imports and non-monetary gold exports. Non-monetary gold refers to any gold that is not central bank gold. Central bank gold (monetary gold) across the world gets an exemption from cross-border trade reporting. This is for the simple reason that central bankers do not want market transparency as it would, not surprisingly, reveal their real influence of the gold market. But that’s another story.

Back to non-monetary gold. The General Administration of Customs of the People’s Republic of China (GACC) now publishes gold import and export data on its website in a series of interactive tables in English, which can be found here. This covers gold imported into mainland China.

The gold that we are interested in here is covered by traded products code HS7108, which is ”gold unwrought or in semi-manufactured forms, or in powder form”. HS71081200, gold in unwrought form, is the main category imported into China. HS71081300, gold in other semi-manufactured form, is also relevant here, as its material in the total quantity of gold imported into China. HS71081100 is gold powder and is not really relevant to the analysis since its imported in very small quantities.

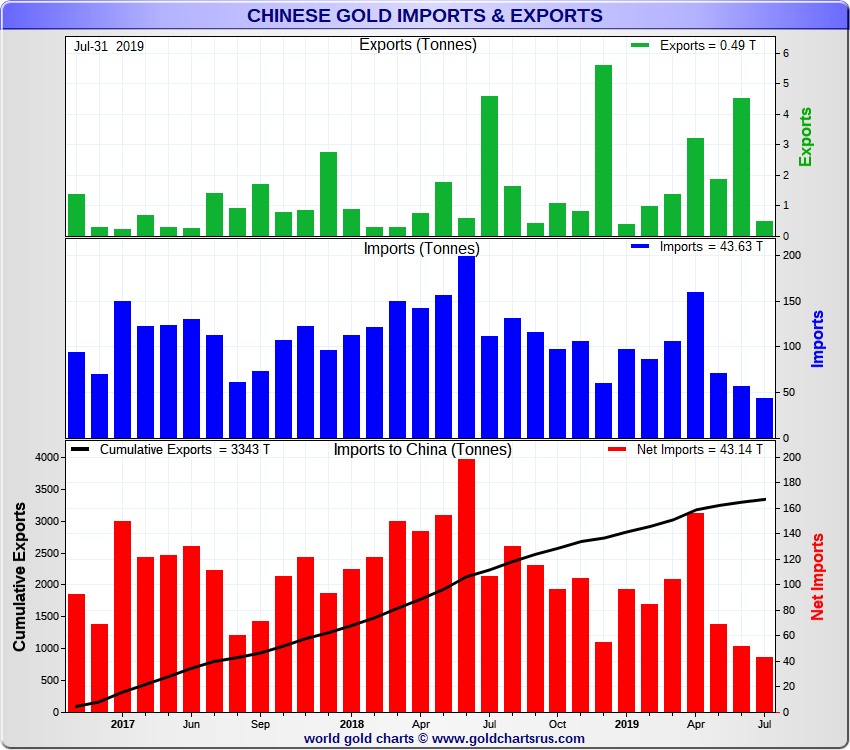
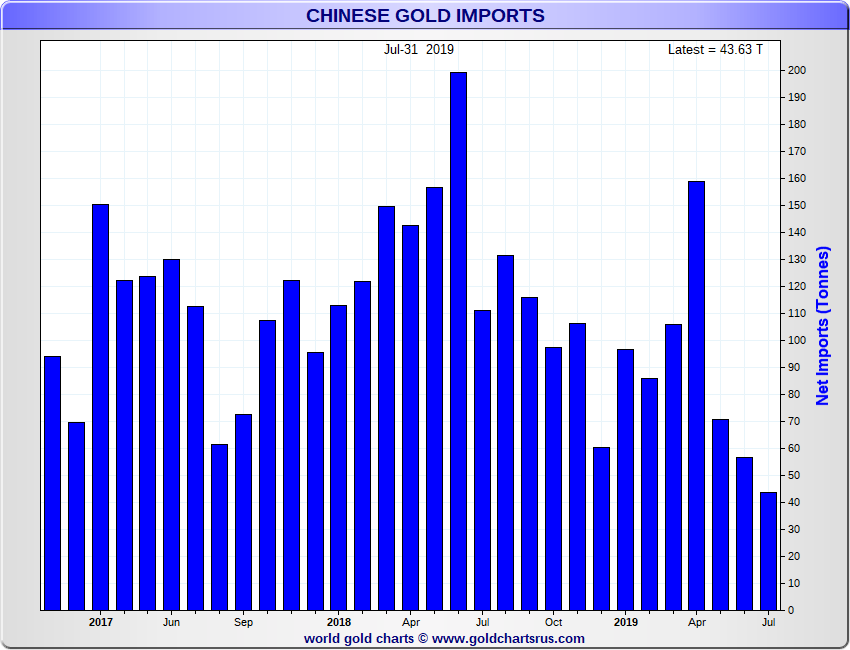
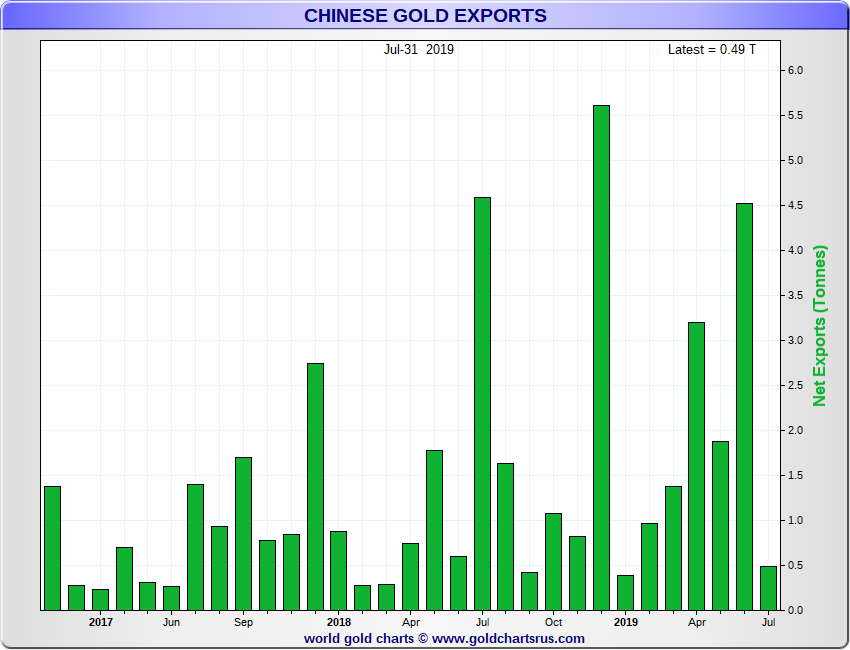
When Chinese customs began publishing monthly gold import in late 2018, it also retrospectively published all the monthly gold import figures for 2017 and 2018, so there are now, at the time of writing, 31 months of Chinese non-monetary gold import data available, i.e. from January 2017 to July 2019, data which is useful for month-to-month and year-to-year comparisons, and which allows the construction of the interesting charts featured here, created by Nick Laird of the unique GoldChartsRUs.com website.

Prior to this official Chinese gold import data being published, the quantity of gold being imported into China had to be estimated. At times this was done very accurately by the likes of Matt Turner of Maquarie Bank, who used various methods, including adding up the gold export figures of other countries to China – at least for those countries that published their gold export figures.

Monthly Chinese gold import and export data, January 2017 – July 2019. Source: www.goldchartsrus.com

2018 – A Bumper Year for Gold Imports

Turner, in his commentary for the LBMA magazine earlier this year, was probably the first person to draw attention to this new official Chinese gold import data, but unfortunately he didn’t provide a link to the actual trade  database. What he did find though was that:

”in 2017, according to the official data, China imported 1,270 tonnes of gold. In 2018, that rose to a huge 1,506 tonnes of gold. Almost all of this comes under the subcategory HS710812, which is unwrought gold, but there is a small amount of HS 710813 or semi-manufactured gold.

Doing a quick spot check of Matt’s figures,and running some queries in the Chinese trade and customs database, my results say that 1262 tonnes of gold were imported into China during 2017. This is when you include HS codes 71081200 and 71081300. Matt Turner got 1270 tonnes for the same two HS codes. I am not sure why the 8 tonne difference, perhaps some data has been subsequently adjusted, but in the overall picture, it’s not material.

Turning to 2018, and using same two HS codes above, my query results say that 1505.7 tonnes of gold were imported during 2018. Matt Turner said 1506 tonnes, so that’s identical. Therefore, we can say that the data in this Chinese trade data database is that same as that used by Turner since it produces the same results over independent queries.

So how do the Reuters stories above stand up to the results from the newly revealed database? Recall again that the Reuters 14 August article, China curbs gold imports as trade war heats up, states that:

”Chinese customs figures show it imported 575 tonnes of gold in the first half of the year, down from 883 tonnes in the same period of 2018.

In May, China imported 71 tonnes, down from 157 tonnes in May 2018. In June, the last month for which data is available, the decline was even sharper, with 57 tonnes shipped compared with 199 tonnes in June last year.”

Did Reuters get its data from the same customs and trade database? We can check. For the 6 months from January to June 2019, my query results of the trade database say that China imported 575 tonnes of gold. This tallies exactly with the Reuters figure of 575 tonnes for H1 2019. The H1 2018 Reuters figure of 883 tonnes also aligns perfectly since I get 883.17 tonnes when querying for the two relevant HS codes.

The May 2019 number from Reuters of 71 tonnes also checks out OK. I get 70.8 tonnes. As does the Reuters figure of 157 tonnes from May 2018. I get 156.8 tonnes. Similarly for June 2019, Reuters says 57 tonnes. I get 56.8 tonnes. For June 2018, Reuters says 199 tonnes, I get 199.3 tonnes. 

Therefore, we can say that Reuters is quoting its gold import figures from the same database that can be found here -> http://43.248.49.97/indexEn

Monthly non-monetary gold imports into mainland China, January 2017 – July 2019 inclusive. Source: www.goldchartsrus.com

Down but not Out

Now that the July 2019 data is in, we can see that 619 tonnes of non-monetary gold have been imported into China over the seven months of 2019 from January to July inclusive. Over the similar period in 2018, a total of 994 tonnes of gold were imported, and for the seven month period in 2017 the total was 802 tonnes.

Therefore, total gold imports over January – July 2019 are 37% lower than during January – July 2018, and 23% lower than during January – July 2017. But when breaking the seven month period down further into two periods from January to April and from May to July (the period in which the lower import quotas are said to have put into effect), that the drop is more startling.

Over January to April 2019, China imported 448 tonnes of gold. This was actually higher than the 436 tonnes of gold imported into China over January – April 2017, and not too far off the 527 tonnes of gold imported into the country over January – April 2018. But looking at the May – July period, China imported 366 tonnes over May -July 2017, 467 tonnes between May and July 2018, but only 171 tonnes over May -July 2019. In percentage terms, the 2019 May – July gold imports are 114% lower than the same period in 2017, and a whopping 173% lower than in the same period in 2018. So there is substance to what Reuters is reporting about lower gold imports into China since May.

However, the dramatic claims by some of Reuters anonymous sources that “there are virtually no import quotas now issued in China” and “next to nothing was imported by banks in June and July” are far off the mark, because there has still been 171 tonnes of gold imported over those three months, which any way you measure it is still a very sizable amount.

Official Chinese gold exports are extremely low – but this does not include the buoyant smuggled gold export trade out of China. January 2017 – July 2019, Source: www.goldchartsrus.com

Reuters has a partial explanation for the continual gold import flow, which is that according to “4 of it sources” …”[gold] imports have not fallen to zero because some banks may still be receiving some quotas, and other import channels, such as refineries receiving semi-pure mined gold, remain open”.

But still, all we can say from these figures is that non-monetary gold imports dropped between May – July 2019. The figures do not explain why. Interestingly, but not surprising, the Chinese central bank declined to comment for the Reuters stories.

Reuters sources say that the Chinese authorities want to reduce capital outflows to steam yuan weakness, and so have reduced import quotas to stem capital outflows in US dollars. But is this really the reason?

Reducing gold imports by 100 tonnes would be worth about US$ 4 billion at at average gold price of $1300 per troy ounce, and about US$ 4.5 billion at an average gold price of US$ 1400 per troy ounce, a range of prices which were prevalent in June and July. So if the Chinese authorities shrunk gold imports by between 200 and 300 tonnes from May to July (and into mid-August) they might have succeeded in holding back between US$ 8 billion and US$ 13 billion to tweak the Chinese balance of payments. But this is not a whole lot in terms of China’s huge monthly trade flows. For example, China’s total imports for July were $175.5 billion.

There are a number of other reasons why the PBoC might want to restrict gold imports. These include:

1. to reduce gold supply because local Chinese gold demand is weak

2. to provide cover for channeling gold imports into monetary gold holdings

It is therefore worth looking at the reaction of the local market to possible import gold restrictions and the motivations for why the Chinese authorities might want to limit gold imports into the world´s biggest gold market. Let’s look briefly at 1 and 2 above and then conclude.

Supply, Demand, and SGE Premiums

Over the period November – December 2016 and again in March 2017, Reuters (surprise, surprise) also reported here and here that there were gold import restrictions into China. The motivations for these quota restrictions were, according to Reuters, to “curb gold imports in a bid to limit yuan outflow” and “to control the capital outflows”.

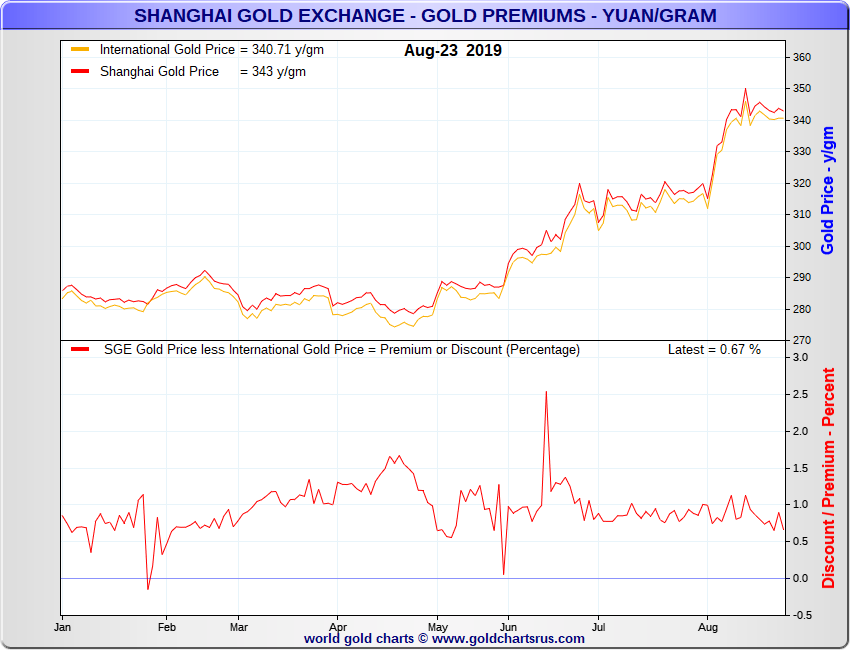
During those times in Nov – Dec 2016 and March 2017, Shanghai Gold Exchange (SGE) price premiums spiked. This suggested a correlation with gold supply constraints in an environment of consistent demand. Commenting on this phenomenon in 2017, I wrote:

“In theory, an expansion in the SGE price premium could have been caused by a combination of limited supply or higher demand, or both. The below chart for 2016 (lower panel) illustrates the emergence of this premium in early November, with the premium rising rapidly from less than 0.5% at that time to nearly 3.5% at one point in December, but still ending the year in the 2% range.”

“In the case of March, it appears that premiums rose again for the very same reason that was attributed to the sharp rise in late 2016, i.e. the re-emergence of supply constraints brought on by more stringent gold import restrictions.”

However, in the last few months, and specifically during the May – August  2019 period, SGE premiums have not spiked. They have remained relatively flat, mostly below the 1% level, and the premiums have been for the most part lower than those recorded in March and April.

Shanghai Gold Exchange (SGE) gold price premium (lower frame), January – August 2019. Source: www.goldchartsrus.com

So if SGE premiums did not spike in the presence of reduced gold imports, what does this mean? Well firstly it would suggest that there is not a supply constraint, and that the gold supply needed by the Chinese domestic market is being supplied by local supply plus the lower levels of gold imports. Said a different way, it could mean that local gold demand has not been high enough for take all actual supply, and not high enough to generate a spike in premiums.

But we could go even further. What if local gold demand has been so weak that in the absence of lower gold imports, it would have caused a drop in SGE premiums? What if the Chinese authorities want to keep SGE premiums at a certain level, such as fluctuating around the 1% level. They could do so by meddling with gold import quotas to maintain these premiums, delibrately shrinking supply to meet the lower demand. In background discussions, this was suggested as a possibility by Bron Suchecki and may be worth considering.

Why would the Chinese authorities try to maintain a certain range of SGE premiums such as 1%? Well, possibly to give a free lunch to favoured gold importing banks who do the importing and onward selling, or alternatively to make the Chinese gold market look stronger that it really is for image reasons. Shrinking the import quotes and dampening gold imports would keep the premiums levitating, premiums which might otherwise collapse if demand is not keeping them up.

Official Chinese Gold Reserves held by the Chinese central bank, latest month July 2019. Source: www.goldchartsrus.com

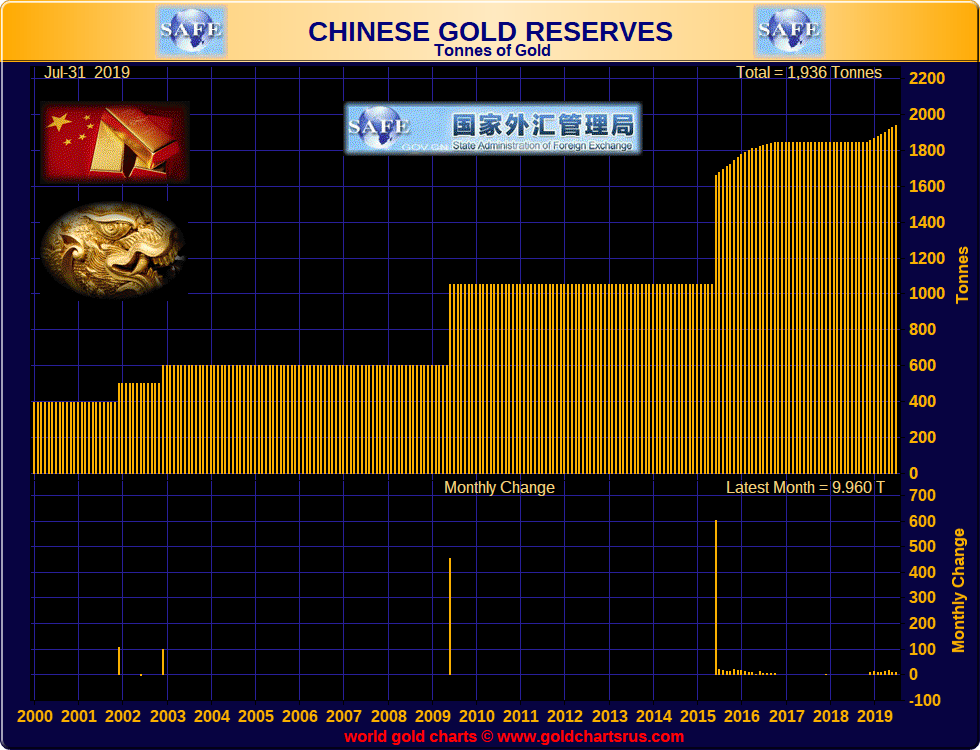
PBoC Gold Reserves – Central Bank Chanelling

Another possibility to explain the recent lower Chinese gold imports, and which is admittedly just speculation, is that the same volume of imported gold is still coming into China, with the difference not as non-monetary gold, but as monetary gold. In that case it would not show up in the customs and trade statistics. What if the Chinese central bank and the Chinese state have been diverting some of the country’s recent gold imports to China’s strategic gold reserve stash?

For example, if 994 tonnes of gold was imported into China from January – July 2019 (the same amount that was actually imported during January – July 2018), and all of this was non-monetary gold, then 994 tonnes would show up in the cross-border trade data.  But if the 2019 trade statistics are only showing 619 tonnes (as the database is showing), then there could still have been 994 tonnes imported, but with 375 tonnes imported as monetary gold – gold which is exempt from trade reporting.

By adjusting the gold import quotas lower, gold imports could be channeled to the the vault of the central bank, while providing the necessary cover to create the illusion that lower quotas are the culprit for the decline. Given that nobody much believes the official low-ball figures for China’s official gold reserves, stranger things have happened than the Chinese state temporarily diverting some of the country’s gold imports for the coffers of its gold vaults in Beijing.

To conclude, for those interested, you can play around with the gold import data here, including seeing data as granular as source countries of China’s gold (e.g. Switzerland) and the Chinese locations where the gold is imported to (e.g. Beijing) -> http://43.248.49.97/indexEn

This article was originally published on the BullionStar.com website under the same title “Chinese Gold Imports – better data, lower flows, unanswered questions”.

via ZeroHedge News https://ift.tt/34hcwBL Tyler Durden

Trade Wars Have No Winners

From the shop floors of Wisconsin to the factories of Asia, no one is winning President Donald Trump’s trade war.

The trade war escalated again over the weekend, with a new round of 15 percent tariffs targeting Chinese goods imported into America. Trump has now imposed tariffs on nearly all imports from China—the remaining tariff-free imports will be subject to tariffs on December 15, after the holiday shipping rush, the administration says. Combined with other tariffs on steel, aluminum, and washing machines, the Trump trade war has raised taxes by more than $32 billion on Americans.

More than year into the trade war, it’s become apparent that there are other costs too. Some are the direct result of the tariffs themselves, like the fact that business investment is slowing. That is, American companies are reallocating resources to blunt the effects of the tariffs or to reconfigure global supply chains, rather than expanding or hiring. They are trying to avoid losses, instead of looking to grow.

“It’s busy. The economy is booming, but there is great uncertainty. A lot of it has to do with trade policy,” Torben Christensen, president of Wiscon Products, Inc., told The Wall Street Journal. The 75-year-old company that makes precision machine parts recently lost a $2 billion order that would have been exported to China because of trade tensions. The company is putting more resources towards marketing in an attempt to replace lost revenue, but that means putting off buying new equipment, as the Journal reported.

A Journal-sponsored survey of more than 600 small business owners shows growing worries about the trade war and its effects on the economy. Economic confidence has fallen to its lowest levels since 2012, and 40 percent of respondents say they expect the economy to worsen in the next year—up from just 29 percent who felt that way in July.

Meanwhile, the trade war is also being blamed for a general slow-down in manufacturing across much of the world. Global manufacturing output and trade flow dropped across Europe, South Korea, and Japan during the first six months of the year. A report on American manufacturing released Tuesday by the Institute for Supply Management, a logistics industry association, showed that American factories have contracted in the past month—for the first time since 2016.

“Trade remains the most significant issue, indicated by the strong contraction in new export orders,” said Timothy R. Fiore, chairman of the Institute for Supply Management’s manufacturing business survey committee, in a statement. “Respondents continued to note supply chain adjustments as a result of moving manufacturing from China. Overall, sentiment this month declined and reached its lowest level in 2019.”

By some measures, U.S. manufacturing is already in a recession. Bloomberg has noted that American output has declined in two consecutive quarters, while “global factory activity has contracted for four straight months.”

Indeed, there are no winners in the trade war. A prolonged slowdown in manufacturing could trigger layoffs and may raise the risk of a recession. Even if China ends up taking a bigger hit than America does, it’s obvious now that there is plenty of pain to go around. And, for now, there is no indication that the U.S. and China are close to making a deal that could put an end to the tariffs and the uncertainty they have created.

Trump could end up as a loser too, since much of his trade policy has been built on the idea that he was going to revitalize U.S. manufacturing. Clearly, that’s not happening.

from Latest – Reason.com https://ift.tt/30TKgD2
via IFTTT

US Military Surrounding Venezuela With New Deployment In Guyana

The US military has effectively surrounded Venezuela, ahead of a possible military intervention. 

We’ve reported in the past that the Pentagon is jointly working with Colombia, Brazil and other regional partners on how to crush Venezuela’s economy so that President Nicolás Maduro would step down. 

Now there’s a new report that the US military has been deployed to the impoverished South American nation of Guyana, the first time in a decade. The country is located on South America’s North Atlantic coast and borders Venezuela to the West. 

The four-month-long deployment, led by the US Air Force, is called New Horizons humanitarian outreach – is intended to serve as “a stepping-stone toward a prolonged relationship” with the Guyana military forces, reported Military.com.

The Air Force hopes relationships with the country can firmly develop amid the increasing influence of Russia and China in the region. 

Guyana is going to become a larger player in this region, both economically and politically in the future, so it’s important that we are closely tied with them,” said 12th Air Force Commander Maj. Gen. Andrew Croft in an interview.

“What we leave is an enduring, physical presence in addition to the partnerships that we build,” Croft boasted, citing medical facilities and schools built in 1997 that are still being used today.

The latest deployment is about 600 US military service members. Their purpose, as per Military.com, will be to construct community centers and a women’s shelter. 

“Guyana sits is in a strategic location on the north edge of South America and on the Caribbean,” the US commander further highlighted. “That’s what makes it important. Also, as political change happens in the nation and they become more aligned with us, it’s important for us to make those personal relationships not only through the embassy, but also through the military and the Guyana defense force, which is currently about 3,000 strong with the intent to nearly double it in the upcoming years.”

Croft said the deployment, carefully planned under US Southern Command, can act as an “insurance policy” if regional conflicts break out in the region. 

“It builds a foundation for the future so that we’re not stuck in a situation that we’re in the Middle East, where we’re actually doing full-up combat operations,” he added. “The more we can help them build rule of law, education and services functions, the more we can then help them build the foundation of a workforce.”

Croft warned about the growing presence of China and Russia in South America, noting that Guyana communication networks use Huawei. 

He also said local bauxite mines, mostly mining for aluminum, could be under new control as both Russia and China have heavily invested into these operations within the country.

With Guyana secured, the US military has effectively surrounded Venezuela with personnel building up in Colombia and Brazil; both countries border Venezuela. The groundwork for a military intervention is being set; it’s only a matter of time before an invasion could be seen. 

via ZeroHedge News https://ift.tt/2PBZhbk Tyler Durden

Trade Wars Have No Winners

From the shop floors of Wisconsin to the factories of Asia, no one is winning President Donald Trump’s trade war.

The trade war escalated again over the weekend, with a new round of 15 percent tariffs targeting Chinese goods imported into America. Trump has now imposed tariffs on nearly all imports from China—the remaining tariff-free imports will be subject to tariffs on December 15, after the holiday shipping rush, the administration says. Combined with other tariffs on steel, aluminum, and washing machines, the Trump trade war has raised taxes by more than $32 billion on Americans.

More than year into the trade war, it’s become apparent that there are other costs too. Some are the direct result of the tariffs themselves, like the fact that business investment is slowing. That is, American companies are reallocating resources to blunt the effects of the tariffs or to reconfigure global supply chains, rather than expanding or hiring. They are trying to avoid losses, instead of looking to grow.

“It’s busy. The economy is booming, but there is great uncertainty. A lot of it has to do with trade policy,” Torben Christensen, president of Wiscon Products, Inc., told The Wall Street Journal. The 75-year-old company that makes precision machine parts recently lost a $2 billion order that would have been exported to China because of trade tensions. The company is putting more resources towards marketing in an attempt to replace lost revenue, but that means putting off buying new equipment, as the Journal reported.

A Journal-sponsored survey of more than 600 small business owners shows growing worries about the trade war and its effects on the economy. Economic confidence has fallen to its lowest levels since 2012, and 40 percent of respondents say they expect the economy to worsen in the next year—up from just 29 percent who felt that way in July.

Meanwhile, the trade war is also being blamed for a general slow-down in manufacturing across much of the world. Global manufacturing output and trade flow dropped across Europe, South Korea, and Japan during the first six months of the year. A report on American manufacturing released Tuesday by the Institute for Supply Management, a logistics industry association, showed that American factories have contracted in the past month—for the first time since 2016.

“Trade remains the most significant issue, indicated by the strong contraction in new export orders,” said Timothy R. Fiore, chairman of the Institute for Supply Management’s manufacturing business survey committee, in a statement. “Respondents continued to note supply chain adjustments as a result of moving manufacturing from China. Overall, sentiment this month declined and reached its lowest level in 2019.”

By some measures, U.S. manufacturing is already in a recession. Bloomberg has noted that American output has declined in two consecutive quarters, while “global factory activity has contracted for four straight months.”

Indeed, there are no winners in the trade war. A prolonged slowdown in manufacturing could trigger layoffs and may raise the risk of a recession. Even if China ends up taking a bigger hit than America does, it’s obvious now that there is plenty of pain to go around. And, for now, there is no indication that the U.S. and China are close to making a deal that could put an end to the tariffs and the uncertainty they have created.

Trump could end up as a loser too, since much of his trade policy has been built on the idea that he was going to revitalize U.S. manufacturing. Clearly, that’s not happening.

from Latest – Reason.com https://ift.tt/30TKgD2
via IFTTT

Debt, Deflation, & The Dangers Of The Fed’s “Superman” Complex

Authored by Chris Whalen via TheInstitutionalRiskAnalyst.com,

The conversations over the Labor Day weekend at Leen’s Lodge ranged from negative interest rates to the efficacy of a bubble gum colored wacky worm vs live bait in late season bass fishing. We’ve mostly decided that a large mouth bass raised in Maine tastes about as good as small mouth bass when flash fried over an open fire.

Confirming that quality trumps quantity, we proved empirically that a single issue of Grant’s Interest Rate Observer, supplemented with a few pine cones, is a superior fire starting accelerant than a whole section of The Financial Timesor The Wall Street Journal.

One major point of consensus view is that the global investment community needs to stop asking central banks to address issues for which they are neither suited professionally or politically. The spectacle of former New York Fed President William Dudley exhorting his former colleagues on the Federal Open Market Committee to resist President Trump was pathetic and sad, yet another faux pas for the Fed of New York this year.

The Dudley rant illustrates the collective madness that has consumed many observers over the past decade. In truth, the crisis of 2008 still has not been resolved.  Dudley wrote:

“There’s even an argument that the election itself falls within the Fed’s purview. After all, Trump’s reelection arguably presents a threat to the U.S. and global economy, to the Fed’s independence and its ability to achieve its employment and inflation objectives.”

Really?  Dudley displays the dangerous “I am Superman” complex we wrote about in 2010, a virus that has infected the Federal Reserve System over the past two decades.  Mission creep does not begin to describe the pathology of the madness that makes Fed officials think themselves omniscient.  We challenge Dudley to point to a section of the Federal Reserve Act than authorizes the political activity he suggests.

These ill-considered comments hurt the Fed and Dudley both, pulling them into the political mosh pit that prudent central bankers rightly avoid. And Dudley’s transparent publicity stunt detracts from the more important question, namely how the US can manage its financial markets in a world caught in a deflationary spiral.

On the question of US markets and negative interest rates, we see the possibility that government bonds and agency securities could trade down to the zero bound, but the private bond and asset backed securities markets in the US are unlikely to follow. Notice in the chart below from FRED that even as the 10-year Treasury note has fallen in yield, the rate on the 30-year mortgage has leveled off.

Europe and Asia are largely bank-centric economies, thus it is relatively easy for the European Central Bank or Bank of Japan to impose negative rates by fiat.  In the US, on the other hand, the size and diversity of the non-bank securities markets will defy such bureaucratic direction.  No rational private investor will fund a US residential mortgage at a negative yield.  Managers of whatever stripe are not paid to lose money. 

For US banks, the prospect of zero or negative yields on government and agency securities represents a dire threat and illustrates the idiocy of negative interest rates as a deliberate public policy.  Banks, pensions and other private institutional reservoirs of savings die in a low or no interest rate environment.  How is this helpful to promoting growth?

We note that the Germans are in the process of mounting a legal challenge to the ECB’s negative rate policy. And significantly, with the ECB’s deposit rate hovering at negative 0.4%, incoming ECB chief Christine Legarde says that negative rates have helped Europe more than they’ve hurt and that more may be necessary. Legarde wrote last week:

“On the one hand, banks may decide to pass the negative deposit rate on to depositors, lowering the interest rates the latter get on their savings.  On the other hand, the same depositors are also consumers, workers, and borrowers. As such they benefit from stronger economic momentum, lower unemployment and lower borrowing costs. All things considered, in the absence of the unconventional monetary policy adopted by the ECB – including the introduction of negative interest rates – euro area citizens would be, overall, worse off.”

We’ve always liked Legarde as a relative hawk on bank solvency in Europe, but she is badly mistaken on negative rates. Lagarde is the paragon of the status quo and reflects conventional economic thinking.  Like her counterparts in the US, Legarde repeats the nonsense that negative rates actually encourage credit creation and consumption, when if fact most of the historical correlations between interest rates and consumption have long ago broken down.

Witness the fact that the US mortgage market has not grown during a decade of low interest rates.  As we wrote in National Mortgage News in July (“Affordability, the FOMC, and the broken link between rates and housing credit“): “As with the once trusted connection between employment and inflation, the tie between interest rates and housing credit seems broken.”  If anything, negative rates seem to feed caution by consumers and a flight to quality among global investors even as global stock indices hit new astounding highs.

As head of the International Monetary Fund, Legarde had the temerity to call for the recapitalization of European banks at Jackson Hole in 2011.  But most of her work at the IMF, most notably with Argentina and Greece, involved window dressing two bad situations that require debt restructuring. Now as she joins the ECB, Legarde must address both bank solvency in the EU generally and eventual debt restructuring in Italy post-Brexit. As the FT notes, watching Argentina head towards its tenth debt default after the largest bailout in IMF history is unlikely to enhance Lagarde’s credibility as ECB chief.

Another point of conversation at Leen’s was the future direction of interest rates in the US. The narrative coming from the financial media says that rates are sinking to zero and beyond, but we reminded the collected pundits that these same analysts were calling for three rate cuts by the FOMC this year.  We reminded our colleagues that the Treasury’s General Refunding will be huge in the second half of 2019.  The Treasury announced on July 29th:

“During the July – September 2019 quarter, Treasury expects to borrow $433 billion in privately-held net marketable debt, assuming an end-of-September cash balance of $350 billion.  The borrowing estimate is $274 billion higher than announced in April 2019.  The increase in borrowing is primarily driven by changes in cash balance assumptions.”

Of note, during the April – June 2019 quarter, Treasury borrowed only $40 billion in privately-held net marketable debt.  In July, however, total issuance rose to $350 billion in that month alone.  But despite this new issuance, Treasury yields continue to fall even as mortgage interest rates stabilize around 4%.

For the moment, yields are falling and corporate bond spreads are tightening, but on flat to down volume in terms of new issuance.  New asset backed issuance has been down for almost a year and corporate issuance is flat. Note that mortgage related securities issuance has spiked upward since May, driving monthly underwriting volumes to levels not seen in ten years.  Of note, the SIFMA data for April-June for mortgage issuance has been revised upward, suggesting that the industry will have a good year after several years of misery.

Recall that back before last Thanksgiving, banks and investors were tweaking their strategies to become more asset sensitive on the assumption that yields on bonds and loans were headed higher.  Now the opposite is the case, at least if you base your view on the conventional wisdom. We’ll be addressing this issue in greater detail in the next edition of The IRA Bank Book. 

With the FOMC solving the liquidity squeeze on the short end of the yield curve by ending the shrinkage of the Fed’s balance sheet, the focus is now on 2s-10s.  There is a case to be made that Treasury and agency markets are over-bought, suggesting the possibility of a correction between now and Turkey Day 2019.  Hang tough out there in credit land. The volatility roller coaster may not nearly be done.

via ZeroHedge News https://ift.tt/2NOHjQy Tyler Durden

“Status Quo Is Unacceptable” – Walmart Stops Selling Some Ammo After Store Shootings

“It’s clear to us that the status quo is unacceptable,” Walmart Chief Executive Officer Doug McMillon said in a statement, this morning, after announcing that the massive retailer will cease selling some types of ammunition and ask customers to not openly carry firearms in its aisles in the wake of two deadly shootings in its stores.

“In a complex situation lacking a simple solution, we are trying to take constructive steps to reduce the risk that events like these will happen again.”

As Bloomberg reports, the company will discontinue sales of short-barrel rifle ammunition such as .223 caliber and 5.56 caliber once it has sold through its current inventory commitments, it said in a statement to employees Tuesday.

It will also stop offering handgun ammunition after it has sold through existing inventory.

In addition, Walmart will end handgun sales in Alaska, the only state where it still sells them, and is “respectfully requesting” that shoppers not open-carry guns in states where it’s permitted.

McMillon went on to note that:

“We know these decisions will inconvenience some of our customers, and we hope they will understand,” adding that,

“we have a long heritage as a company of serving responsible hunters and sportsmen and women, and we’re going to continue doing so,”

Last month Walmart disclosed that it accounts for about 2% of the U.S. firearms market, which would place it outside the top three sellers; and today’s moves, which Walmart said will reduce its market share of ammunition to between 6% and 9%, down from about 20% currently, represent the retailer’s first big steps since attacks in stores in Texas and Mississippi left 24 people dead.

Finally, we do note one comment from a very experienced gun owner, that “no one buys [Walmart’s] overpriced ammo anyway.”

Still, virtue signaled, so all is well.

Gunmaker stocks stumbled on the news…

But was quickly bid back.

via ZeroHedge News https://ift.tt/2MS0d9w Tyler Durden

California’s Political Leaders Strike Deal on Rent Control

California’s governor and legislative leaders have come to an agreement on changes to a rent control bill that will likely see the Golden State become the second state in the union to adopt statewide regulation of rental prices.

AB 1482, first introduced in February by Assemblyman David Chiu (D–San Francisco), will be amended to cap rent increases at 5 percent plus inflation per year until 2030, Gov. Gavin Newsom’s office told the Los Angeles Times on Friday.

“The high cost of housing and rising rents are preventing California families from getting ahead,” said Newsom in a joint statement with Chiu, Senate Leader Toni Atkins (D–San Diego), and Assembly Speaker Anthony Rendon (D–Lakewood). “We are pleased to announce we have come to an agreement on a series of amendments to AB 1482 that would create strong renter protections.”

These new amendments to the bill would essentially renege on concessions that were made in late May to get AB 1482 through the Assembly. Those included a 7 percent rent cap and having the bill expire in 2023.

The announced changes have shifted the state’s Realtors Association from neutral to opposed, reports the Times. However, strengthening the bill has failed to appease critics on the left who want stricter limits on rent hikes, and who say they will continue with their efforts to put a rent control initiative on the 2020 state ballot.

The amended version of AB 1482 still needs to be approved by both chambers within the next two weeks—a tight but doable deadline.

Its passage would mark a major win for the country’s ascendant rent control movement.

In February, Oregon passed the country’s first statewide rent control measure, limiting price hikes to 7 percent per year plus inflation on buildings older than 15 years. In June, New York’s legislature passed a bill strengthening existing rent control regulations in New York City and lifting a prohibition on other cities imposing their own rent control policies.

California has a similar prohibition on local rent control ordinances known as the Costa-Hawkins Act. Passed in 1994, the bill bans localities from imposing rent control on units built after 1995 and on single-family homes and condos.

That bill also grandfathered in rent control laws passed by cities like Los Angeles and San Francisco, meaning that major portions of both cities’ rental housing stock are already subject to price regulations.

In 2017, local governments were also explicitly given the power to require developers to include rent-restricted units in new buildings.

Tenant advocates argue that rent control helps keep renters in their homes and protects them from opportunistic price hikes. Economists generally oppose rent control, arguing that it does little to help poor tenants and that it comes with a host of bad incentives.

Landlords of rent-controlled units are incentivized to not maintain their properties, they say. Others might redevelop their properties into condominiums that they can sell at market rates, while developers, looking at reduced returns from construction, can be dissuaded from building more units.

Empirical studies suggest both sides are right—to a degree.

A study of an expansion of rent control in San Francisco published in American Economic Review this month found that “while rent control prevents displacement of incumbent renters in the short run, the lost rental housing supply likely drove up market rents in the long run, ultimately undermining the goals of the law.”

Another study from researchers at the Massachusetts Institute of Technology found that the elimination of rent control in Cambridge, Massachusetts resulted in higher rents and more tenant turnover but also a more-than-double increase in housing investment.

There’s a growing consensus that California’s high housing costs are the product of too little supply. Supply is in turn constrained by onerous zoning laws and lengthy permitting processes for new housing.

Ultimately, rent control is a poor way of dealing with the high rents that result from these limits on new housing development. Far from fixing the state’s affordability problems, it could well make them worse.

from Latest – Reason.com https://ift.tt/2PHCL0O
via IFTTT

NYC Mayor De Blasio Logged Just 7 Hours At Work For Entire Month

New York City Mayor Bill de Blasop spent just seven hours at City Hall during the month of May – when he was ‘hard at work’ launching his bid for the White House, according to records reviewed by the New York Post

The Mayor showed up just six times in May in order to attend two meetings, four events and hold five phone calls – including his weekly appearance on WNYC radio, according to his official calendar. 

The 11 appointments amounted to a meager one-fifth of the 50 meetings, calls and other events at City Hall on de Blasio’s calendar for May 2018. He had a total 152 city events scheduled for the month. –New York Post

“If he’s trying to show New Yorkers that he’s over doing the job, he’s doing a good job of it,” one ex-aide told the Post, while another ‘de Blasio insider’ called the Mayor’s attendance “real bad,” adding “At this point, you’ve got to wonder how much of his heart is really in it.” 

De Blasio launched his 2020 bid for the White House with 16 appearances on ABC’s “Good Morning America,” which the Post says drew “raucous protests from groups as diverse as the Police Benevolent Association and Black Lives Matter.”

The mayor also held 66 calls or meetings while “en route,” or traveling somewhere, according to the records.

Spokeswoman Freddi Goldstein tried to downplay the report, telling the Post “Whether at City Hall, Gracie Mansion or on the road, the mayor consistently delivers for 8.6 million New Yorkers.”

via ZeroHedge News https://ift.tt/2PDa9pu Tyler Durden

Just How Long Will Markets Keep “Buying” It?

Authored by Lance Roberts via RealInvestmentAdvice.com,

In this past weekend’s newsletter, I broke down the bull/bear argument dissecting the issues of cash on the sidelines, extreme bearishness, equity outflows. However, even though the economic and fundamental environment is not supportive of asset prices at current levels, the primary argument supporting asset prices at current levels is “optimism.” 

“The biggest reason for last week’s torrid stock market rally was rekindled “optimism” that the escalating trade war between the US and China may be on the verge of another ceasefire following phone conversations, fake as they may have been, between the US and Chinese side. This translated into speculation that a new round of tariffs increases slated for this weekend may not take place or be delayed.” – MarketWatch

This, of course, has been the thesis of every rally in the market over the past year. Sven Heinrick summed this up well in a recent tweet.

However, the “ceasefire” did not happen, and at 12:00 am on Sunday, the Trump administration slapped tariffs on $112 billion in Chinese imports. Then, one-minute later, at 12:01 am EDT, China retaliated with higher tariffs being rolled out in stages on a total of about $75 billion of U.S. goods. The target list strikes at the heart of Trump’s political support – factories and farms across the Midwest and South at a time when the U.S. economy is showing signs of slowing down.

Importantly, the additional tariffs by the White House target consumers directly:

“The 15% U.S. duty hit consumer goods ranging from footwear and apparel to home textiles and certain technology products like the Apple Watch. A separate batch of about $160 billion in Chinese goods – including laptops and cellphones – will be hit with 15% tariffs on Dec. 15.  China, meanwhile, began applying tariffs of 5 to 10% on U.S. goods ranging from frozen sweet corn and pork liver to bicycle tires on Sunday.

The slated 15% U.S. tariffs on approximately $112 billion in Chinese goods may affect consumer prices for products ranging from shoes to sporting goods, the AP noted, and may mark a turning point in how the ongoing trade war directly affects consumers. Nearly 90% of clothing and textiles the U.S. buys from China will also be subjected to tariffs.” – ZeroHedge

This is only phase one. On December 15th, the U.S. will hike tariffs on another $160bn consumer goods and Beijing has vowed retaliatory tariffs that, combined with the Sunday increases, would cover $75 billion in American products once the December tariffs take effect. 

These tariffs, of course, are striking directly at the heart of economic growth. The trade was has ground the global economy to a halt, sent Germany into a recession, and is likely slowing the U.S. economy more than headline data currently suggests.

Yet, “optimism” that “a trade deal is imminent” is keeping stocks afloat. For now.

As we discussed previously, the President has now trained the markets to respond to his “tweets.” 

“Ring the bell. Investors salivate with anticipation.”  

However, despite the rally last week, the markets are still well confined in a very tight consolidation range.

As I noted recently:

  • The “bulls” are hoping for a break to the upside which would logically lead to a retest of old highs.
  • The “bears” are concerned about a downside break which would likely lead to a retest of last December’s lows.
  • Which way will it break? Nobody really knows.

The biggest risk, is what happens when the market quits “buying the rumor” and starts “selling the news?”

Fed To The Rescue

There is another level of “optimism” supporting asset prices. 

The Fed.

It is widely believed the Fed will “not allow” the markets to decline substantially. This is a lot of faith to place into a small group of men and women who have a long history of creating booms and busts in markets. 

And, as JP Morgan noted over the weekend:

“Positive technical indicators and monetary easing will likely outweigh the uncertainty of the U.S.-China trade war and the “wild card” of developments in tariff negotiations. We now advise to add risk back again, tactical indicators have improved. Admittedly, the next trade move is the wild card to all of this, but we think that the hurdle rate for any positive development is quite low now.”

Currently, there is a 100% expectation of the Fed cutting rates at the September meeting.

The belief currently, is that lower interest rates will result in higher asset prices as investors will once “chase equities” to obtain a “higher yield” than what they can get in other “safe” assets. 

After all, this is indeed what happened as the Federal Reserve kept interest rates suppressed after the financial crisis. However, the difference between now, and then, is that individuals are currently fully invested in the financial markets. 

“Cash is low, meaning households are fairly fully invested.” – Ned Davis

In other words, the “pent up” demand for equities is no longer available to the magnitude that existed following the financial crisis which supported the 300% rise in asset prices. 

More importantly, when the Fed has previously engaged in a “rate cutting” cycle when the “yield curve”was inverted, which signals something is wrong economically, the outcomes for investors have not been good.

This last point is an issue for investors specifically. Investing is ultimately about buying assets at a discounted price and selling them for a premium. However, so far in 2019, while asset prices have soared higher on “optimism,” earnings and profits have deteriorated markedly. This is show in the attribution chart below for the S&P 500.

In 2019, the bulk of the increase in asset prices is directly attributable to investors “paying more” for earnings, even though they are “getting less” in return.

The discrepancy is even larger in small capitalization stocks which don’t benefit from things like “share repurchases” and “repatriation.” 

Just remember, at the end of the day, valuations do matter.

September Seasonality Increases Risk

“The month of September has a reputation for being a bad month for the stock market. After the October 1987 Crash, the month of October carried a bad rep for years, but more recently we are told that it’s really September we have to watch out for.” – Carl Swenlin

The month of September has closed higher fifty-percent of the time, but the average change was a -1.1% decline, making September the worst performing month in the 20-year period. More importantly, September tends to be weaker when it follows a negative August, which we just had.

However, these are all averages of what has happened in the past and things can, and do, turn out differently more often than we expect. This is why I prefer to just rely on the charts to suggest what may happen next. 

I discussed previously that money is crowding into large-capitalization stocks for safety and liquidity. Carl Swenlin showed this same analysis in his chart below.

Investors should be very aware about the deviation in performances across asset markets. Historically, this is more of a sign of a late-stage market topping process rather than a “pause that refreshes the bull run.” 

This is particularly the case when this crowding of investments is occurring simultaneously with an inverted yield curve. 

On a purely technical basis, when looking at combined monthly signals, we see a picture of a market in what has previously been more important turning points for investors. 

Sure, this time could turn out to be different. 

Since I manage portfolios for individuals who are either close to, or in retirement, the risk of betting on “possibilities,” versus “probabilities,” is a risk neither of us are willing to take. 

Let me restate from last week:

“Given that markets still hovering within striking distance of all-time highs, there is no need to immediately take action. However, the continuing erosion of underlying fundamental and technical strength keeps the risk/reward ratio out of favor. As such, we suggest continuing to take actions to rebalance risk.

  1. Tighten up stop-loss levels to current support levels for each position.

  2. Hedge portfolios against major market declines.

  3. Take profits in positions that have been big winners

  4. Sell laggards and losers

  5. Raise cash and rebalance portfolios to target weightings.

We are closer to the end of this cycle than not, and the reversion process back to value has historically been a painful one.”

Remember, it is always far easier to regain a lost opportunity. It is a much more difficult prospect to regain lost capital. 

via ZeroHedge News https://ift.tt/2LhAOUv Tyler Durden