Submitted by Jim Quinn of The Burning Platform blog,
In the 1st installment of this article – May the Odds Ever Be in Your Favor – The Reaping, I addressed how wealth inequality created by men rigging the system and utilizing media propaganda ultimately leads to rebellion. In Part 2, I will show how hope and defiance can ignite the flame of liberty in the minds of men. Edward Snowden has ignited that flame.
A Lot of Hope is Dangerous

President Snow: Seneca… why do you think we have a winner?
Seneca Crane: [frowns] What do you mean?
President Snow: I mean, why do we have a winner? I mean, if we just wanted to intimidate the districts, why not round up twenty-four at random and execute them all at once? It would be a lot faster. [Seneca just stares, confused]
President Snow: Hope.
Seneca Crane: Hope?
President Snow: Hope. It is the only thing stronger than fear. A little hope is effective. A lot of hope is dangerous. Spark is fine, as long as it’s contained.
Seneca Crane: So…?
President Snow: So, contain it.
President Snow and his chief propagandist, Seneca Crane, have a discussion that could be taking place between president Obama and chairman Bernanke today. Hope is a funny thing. If the ruling class removes all hope, then the masses begin to feel they have nothing to lose and revolution becomes a foregone conclusion. For the elites of Panem, hope is used as a method of control. President Snow understood the danger of allowing the downtrodden multitudes too much hope. The Hunger Games allows one child to survive out of 24. The districts are forced to remember the iron grip of the Capitol every year, while rooting for an unlikely hollow victory of one child surviving.
The parents of children in the districts hope their children aren’t chosen. They hope they’ll scrounge up enough food to survive another day. They hope they don’t get killed in a mine explosion. They hope the peacekeepers don’t break down their doors and imprison them for illegal hunting. They hope they can endure another week. Snow knows that as long as they have only a faint hope to maintain their subsistence level lifestyle, they are unlikely to rebel. Seeing a sixteen year old girl openly defying the Capitol and awakening a spirit of humanity and courage in the subjugated masses is a huge threat to the ruling class.
Katniss Everdeen ignited the flash of hope in the districts when she befriended a young girl from District 11 named Rue. The contestants are supposed to kill each other, but Katniss protects the young girl. When Rue is killed, Katniss decorates her body with flowers as a means of memorializing Rue, which the television audience in the districts views as defying the Capitol. As she walks away from Rue’s memorial and back into the fight, she turns to the cameras and gives a three finger salute. The three fingered salute of District 12, a gesture rarely used, means thanks, admiration, and good-bye to a loved one. Her message to the people watching is they have a common enemy. They don’t have to fight each other because a tyrannical government commands them to do so. Once the beaten down and subjugated masses began to understand the other districts were not the true enemy, the flame of liberty was kindled.

Katniss had experienced an act of kindness and mercy earlier in the novel when she had reached the end of her rope and had failed to scavenge any food for her helpless mother and sister after her father’s death in a mine explosion. Her thoughts were dark and dire.
“I couldn’t go home. Because at home was my mother with her dead eyes and my little sister, with her hollow cheeks and cracked lips. I couldn’t walk into that room with the smoky fire from the damp branches I had scavenged at the edge of the woods after the coal had run out, my hands empty of any hope.”
In the world of District 12 bread signifies hope. Food symbolizes hope as freedom from hunger. When Peeta sees Katniss and her anguish, he shows compassion for her. He purposely burns some bread from his parents’ bakery and throws the bread to Katniss, who is huddled outside in the rain. Later on, as Katniss thinks about the meaning of this interaction with Peeta, she says,
“To this day, I can never shake the connection between this boy, Peeta Mellark, and the bread that gave me hope.”
One of the key undercurrents of the Hunger Game trilogy is what happens in a world where all hope seems to be lost. Through small acts of kindness, like providing a few loaves of bread or honoring a departed contestant, hope can be sparked, and a spark can turn into a flame, a “girl on fire.” In this way, Katniss comes to embody the hope of a better future, a liberated and free Panem. When an authoritarian regime can no longer keep the populace sedated with bread and circuses, they turn to oppression and force.
With 47 million people wallowing in poverty and real median household income lower than it was in 1999 a pallor of hopelessness has descended upon our land. Banking and corporate interests have captured the economic, financial and political systems to such an extent the people no longer have any say in how this country is governed. The people are given a choice of flavors in what passes for elections by the corporate interests that choose the candidates. Once a politician attains office and does what they are instructed by the financial interests that fund their campaigns, they become rich and powerful. This is why 90% of incumbents are re-elected despite Congress having a 12% approval rating in polls.
The last 13 years has confirmed the country is run by one party, as the Republican figurehead rolled out new trillion dollar entitlement programs, fought undeclared wars, created an Orwellian organization to spy on Americans, and drove deficits to staggering levels. Now the current Democrat figurehead has rolled out a disastrous new trillion dollar entitlement program, continues to fight undeclared wars, drones innocent people in foreign countries, secretly collects data on every American, and has driven deficits to epic heights.
The Crisis began in 2008 with the Wall Street created worldwide financial implosion, spurred by the greatest control fraud in history. The bankers and politicians have implemented “solutions” that have further enriched the kleptocratic parasite class, while impoverishing savers, seniors, and the working middle class who played by the rules. The temperament of the country has continued to darken and societal trust is imploding, just as Strauss & Howe predicted in 2007.
“As the Crisis catalyzes, these fears will rush to the surface, jagged and exposed. Distrustful of some things, individuals will feel that their survival requires them to distrust more things. This behavior could cascade into a sudden downward spiral, an implosion of societal trust.” – The Fourth Turning
When a tyrannical privileged class has taken their greed and avarice too far, reaped the remaining spoils of a declining empire and the exploited hordes begin to grow restless, the oligarchs will always utilize their mercenaries to retain control and keep the multitudes cowering and fearful. Even though the financial elite have been harvesting the riches of our bountiful land for decades, it only started to become apparent to a few aware critical thinkers in the late 1990’s. It is no coincidence the War on Terror has been used as an excuse to pass the Patriot Act, unleash the NSA to gather every piece of electronic data generated by all American citizens, militarize local law enforcement agencies, conduct military “training exercises” in major cities, roll out drones to monitor the activities of the people, subject citizens to degrading body searches in airports and train stations, install surveillance cameras throughout the land to monitor our every move, use Bernaysian propaganda techniques and create fake terrorist plots to keep the masses trembling and terrified.
The ruling class leeches lost their blood sucking grip on the financial markets in 2000 and again in 2008. As the common people have lost their trust in the financial and political leaders and their propaganda techniques wear thin, truncheons, guns and a vast treasure trove of weapons and surveillance equipment are being prepared for use against the people.
The Party put forth an unknown hope and change teleprompter flim-flam man in 2008 in a last ditch attempt to sooth the masses and allow the fat cats to continue feasting, with the periodic purging in the vomitorium when their gullets were stuffed. The proof of a single ruling party has never been clearer, as a supposedly liberal populist democrat has fallen into line and followed the orders of the Financial Industrial Complex, Military Industrial Complex, and Sickcare Industrial Complex by not prosecuting one criminal banker, letting Wall Street write the 800 page Dodd Frank bill, ramping up our wars in the Middle East while spending more on Defense than Bush, and gladly allowing the insurance and drug industry to write the 1,000 page Obamacare abortion of a law. At the same time he has taken the Orwellian surveillance state to levels that would have been considered criminal and impeachable in 1990. The two heads of the ruling party play their parts to keep the masses distracted, believing voting actually matters, while fighting the wrong enemy.
The parallels between the Hunger Games novels and our current situation are innumerable. But the dehumanization of a society is the most significant analogy between the dystopian culture of Panem and the greed and materialism of our late stage declining empire. It will not be war, plague or famine that sets the stage for our collapse. A moral sickness has engulfed the soul of our civilization, spread by the dark forces of wickedness occupying the throne of power on Wall Street, Washington DC, and in the boardrooms of mega-corporations across the land.
“It neither kills outright nor inflicts apparent physical harm, yet the extent of its destructive toll is already greater than that of any war, plague, famine, or natural calamity on record — and its potential damage to the quality of human life and the fabric of civilized society is beyond calculation. For that reason this sickness of the soul might well be called the ‘Fifth Horseman of the Apocalypse’. Its more conventional name, of course, is dehumanization.” – Ashley Montagu
The financial elite have used the power of mass media propaganda and jurisdiction over the public educational system to turn accountable thinking citizens into irresponsible irrational consumers. The ultra-rich men, constituting the invisible government described by Edward Bernanys, have used their control of the currency and monetary system to create a plantation society of enslaved debtors who have been trained like monkeys to consume when they are not facebooking, twittering or twerking. This dehumanization is in full display on Thanksgiving/Black Friday as the corporate fascists stir the masses into a frenzied materialistic orgy of pandemonium for cheap electronics produced by slaves in China, doing jobs formerly performed by Americans. Corporate profits have reached all-time record highs as the Ivy League MBA CEOs have used global wage arbitrage to de-Americanize their work force, convinced the lowly wilfully ignorant American serfs to spend money they no longer have on crap they certainly don’t need, and paid themselves billions in bonuses for successfully destroying the former middle class by the book.
The Party has utilized the cudgel of Federal Reserve created inflation to fleece the math challenged masses for the last 100 years. The modern day financial mad scientists use inflation, consumerism, debt, and media propaganda to keep the rats in their grand experiment running faster and faster around the maze, seeking an ever dwindling hunk of cheese. The rats are trapped in this experiment and have not the time, energy, resolve or enough cheese to escape. The rats will never breakout and their progeny are born into the maze, also with no hope of getting out alive. The mad scientists periodically reorient the maze, adjust the stimuli to elicit new behavior, and increase or decrease the rewards as they deem appropriate. Through their control of the financial, political and media centers, the ruling class not only manipulates society, they convince the rats they are really free and not confined in a maze, with no possibility of escape. The ruling class has succeeded in capturing the system to such an extent that they are syphoning off the income of the nation at a rate only seen prior to the Great Depression.
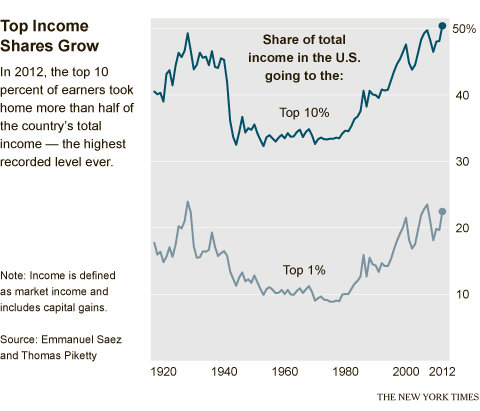
The real median household income of the bottom 90% is lower than it was in 1968, as inflation has destroyed the purchasing power of the proletariat. While wages have stagnated due to mega-corporations off-shoring American jobs for the sake of quarterly profits and stock price performance, the price of middle class essentials like food, energy, shelter, tuition and medical care have skyrocketed. The demented American nobility have disregarded centuries of history with regards to inequality borne of corruption and unfettered greed. When mild deflation reigns, as it did for most of the 19th century, goods and trade are plentiful, prosperity is ample and broadly spread to the working classes. When banker created inflation causes prices to rise, trade plummets, living standards deteriorate, and extreme wealth inequality accelerates. Once poverty reaches a tipping point, unrest and discontent lead to revolution and rebellion.
It is not a coincidence the rebellion in the Hunger Games begins in the two poorest districts. District 12 is inhabited by mostly white people in the Appalachia region of the former United States. District 11 is inhabited by mostly black people in the Southern region of the former United States. The symbolism of black people picking crops and being publicly whipped if they steal any of the food for their own survival is re
flective of the plantation economy we have today. Miners getting killed in mine explosions due to unsafe conditions are reflective of the corporate greed that permeates our culture. The masters of this human tragedy attempt to keep the plebs in one district angry and mistrustful of the plebs in the other districts so they don’t focus on the real enemy. It has worked for decades, but as the workers see their lots in life descend to bare subsistence levels they have nothing to lose by resisting and rebelling. The privileged ruling plutocrats have the power to lessen the burden on the slaves, diminishing the chances of revolution, but in their sociopathic gluttonous hunger for ever more riches and supremacy they seal their fate of ultimate destruction, as John Kenneth Galbraith aptly described.
“People of privilege will always risk their complete destruction rather than surrender any material part of their advantage.”
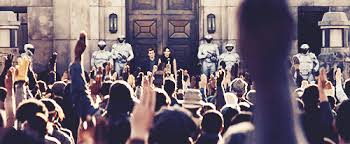
A simple act of human kindness by a young girl is what ignited a rebellion in Panem. The power of hope and courage, once unleashed, can overwhelm the wickedness of evil men. But, those men will not be defeated without an epic struggle requiring much sacrifice, suffering, death and destruction. Katniss did not realize the impact she had until on her victory tour when during her speech an old man gives her the three finger salute, leading the crowd to follow his lead and defy the peacekeepers. She had inspired the oppressed to resist their bondage.
In the most disturbing scene of the movie, the old man is grabbed by the police thugs, dragged to the podium and shot in the head, while the other thugs beat and pummel the crowd into submission. Shades of the OWS beatings by the NYPD are clear.
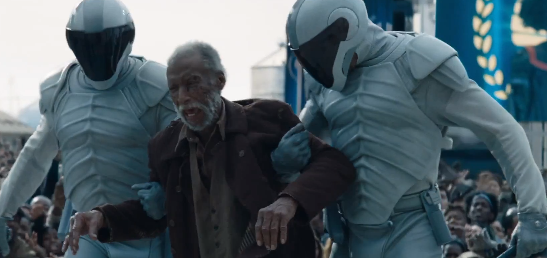
This is how an Orwellian surveillance state reacts to the discontent caused by the appalling treatment of their subjects. Every district is kept under the thumb of the ironically named peacekeepers. They enforce the dictatorial mandates of the Capitol at the point of a gun and threats of imprisonment, or public beatings. The technologically advanced Capitol uses surveillance cameras and spy aircraft to monitor the districts and enforce their dictates. Since the passage of the paradoxically named Patriot Act, the American surveillance state has been perfected to a level that would impress Orwell.
With the NSA gathering every piece of electronic data generated by every citizen, surveillance cameras monitoring our every movement in major cities, spy drones patrolling the skies, fascists attempting to disarm the public, and police state thugs roaming the countryside enforcing the dictates of the oligarchy, we’ve descended into authoritarian rule. The Constitution is no longer a valid document. The President is free to send boys to their death in foreign countries without the approval of Congress. He is free to ignore laws and use executive orders to implement his agenda. Any doubt regarding whether we are still free was obliterated by the police state crushing of the OWS protests and more recently the door to door illegal searches conducted by heavily armed American “peacekeeper” thugs in Watertown, Massachusetts searching for a wounded 17 year old kid.


The courageous actions of Katniss in the Hunger Games ignited a rebellion and the ultimate demise of President Snow and his evil empire. Edward Snowden’s audaciously brilliant take down of the NSA and Obama’s growing surveillance empire has awakened a slumbering public and hopefully kindled the flame of freedom in enough patriots to instigate the revolution which will drive the next stage of this Fourth Turning.
“The risk of catastrophe will be very high. The nation could erupt into insurrection or civil violence, crack up geographically, or succumb to authoritarian rule. If there is a war, it is likely to be one of maximum risk and effort – in other words, a total war. Every Fourth Turning has registered an upward ratchet in the technology of destruction, and in mankind’s willingness to use it.” – Strauss & Howe –The Fourth Turning
Defiance – Catching Fire
“At some point, you have to stop running and turn around and face whoever wants you dead. The hard thing is finding the courage to do it.” – Katniss Everdeen – Catching Fire


“The great fear that I have regarding the outcome for America of these disclosures is that nothing will change. [People] won’t be willing to take the risks necessary to stand up and fight to change things… And in the months ahead, the years ahead, it’s only going to get worse. [The NSA will] say that… because of the crisis, the dangers that we face in the world, some new and unpredicted threat, we need more authority, we need more power, and there will be nothing the people can do at that point to oppose it. And it will be turnkey tyranny.” – Edward Snowden
Now we get to the most important theme of the Hunger Games trilogy and a theme that will drive the regeneracy stage of this Fourth Turning – Defiance. There can be no change unless someone has the courage to make a stand. Generational archetypes will need to play their assigned roles, just as they did in the Hunger Games novels. The Boomers should be seeking a new vision of a better future; Gen-X should be seeking realism and implementable solutions; and the Millennials should be seeking the power to change the course of a terribly misguided country.
It will not take a majority to prevail during this Fourth Turning, just an inspired courageous minority willing to sacrifice themselves for the greater good. Suzanne Collins may
not have meant to place her characters into their proper generational roles, but they played their parts as would be expected during a Crisis. Plutarch Heavensbee, a 50 something Prophet Generation visionary, is the leader of the rebellion who exploits the power and courage of Katniss Everdeen, from the Hero Generation, to inspire and lead the rebellion. Haymitch Abernathy, the 40 year old drunk from the Nomad Generation, is the brains behind the plan to spur rebellion and defeat the Capitol. He made it his purpose in life to protect and support the young heroes who were required to do the heavy lifting during the Crisis.
The theme of defiance and its ability to undermine an evil, yet fragile, authoritarian regime is portrayed through the symbol of the mockingjay in the novels. The mockingjay is a surveillance state blunder, accidently fashioned by the hubristic Capitol. After the first rebellion, the Capitol left the jabberjays, a bird they created to spy on the districts and relay whole conversations to the Capitol, in the wilderness to die off. Instead, the jabberjays mated with mockingbirds and a species called the mockingjay was born. The mockingjay was a signal of weakness in the armor of the Capitol.Mockingjays had the talent of being able to relay any song or tune they hear to any species. Katniss’ father used to love to sing songs in the woods while hunting and loved to hear the mockingjays repeat his tune back to him. Katniss and Rue used the mockingjays to communicate during the Games. Mockingjays were a hardy resilient species that could survive in the harshest of environments.
The mockingjay becomes a symbol of defiance, rebellion and hope among the districts. Before the Games, a friend of Katniss’ from school gave her a gold mockingjay pin as a token from home. The television audience sees the pin on Katniss’ clothes during the Games. After the Games, the symbolism of the mockingjay becomes a rallying point for the subjugated masses in the districts. As the rebellion gathers steam, the rebelling districts use the mockingjay symbol as a primary method of communication. The rebels bake the bird symbol into breads, crackers, and other things that could easily be eaten or hidden quickly. The mockingjay becomes sign of resistance, a sign of uprising, and a sign of hope. The brush fires of rebellion are glimpsed by Katniss during the victory tour and celebration before the 75th anniversary Games. Plutarch Heavensbee, supposedly a high level Capitol apparatchik, attempted to win Katniss’ trust by showing her his watch, which viewed in the right position you could see the symbol of the rebellion – the mockingjay.
The defiance of a young girl versus the façade of an all-powerful state, through her humanity, the mockingjay symbol, and the willingness to eat poison berries as the ultimate act of rebellion against the rulers of the game, is the defining motif of our time.
“The bird, the pin, the song, the berries, the watch, the cracker, the dress that burst into flames. I am the mockingjay. The one that survived despite the Capitol’s plans. The symbol of the rebellion.” – Katniss Everdeen – Catching Fire
What is not immediately apparent to the vassals of a totalitarian regime is the internal rot, infighting among the lieutenants, and superficial level of support among the citizenry. A government racked by corruption, dependent upon financial gimmickry and massive levels of debt to give the appearance of solvency, only able to preserve domination through brutal police state thug tactics, monitoring its subjects with intrusive surveillance machines, and led by sociopathic paranoid egomaniacal men, is sickly and rotting on the inside. President Snow spitting up blood throughout the novels is symbolic of this disease. Like a gigantic 224 year old oak tree that appears imposing, robust and indestructible, but has been decaying within, a strategically placed lightning strike or sudden gust of wind is capable of toppling the once mighty tree.

Sometimes all it takes is for one person of good conscience, with the courage to accept the consequences of revealing the truth, to strike down the mighty oak and ignite brush fires of freedom in the minds of men. Edward Snowden is that person.
“I can’t in good conscience allow the US government to destroy privacy, internet freedom and basic liberties for people around the world with this massive surveillance machine they’re secretly building. I do not want to live in a world where everything I do and say is recorded. That is not something I am willing to support or live under. Everyone everywhere now understands how bad things have gotten — and they’re talking about it. They have the power to decide for themselves whether they are willing to sacrifice their privacy to the surveillance state.” – Edward Snowden
In the Hunger Games trilogy Katniss Everdeen created a problem for President Snow when she pulled out the poisonous berries and foiled the game being orchestrated by the cruel sovereigns of Panem. She refused to be a pawn in their game. She had the courageousness of spirit to illustrate to the suppressed citizens in the locked down prison-like districts that she was not owned and enslaved by the state. She was a human being who deserved to be treated with respect, not like an animal or a specimen in their malicious man made game.
“I want to do something, right here, right now, to shame them, to make them accountable, to show the Capitol that whatever they do or force us to do there is a part of every tribute they can’t own. That Rue was more than a piece in their Games. And so am I.” – Katniss Everdeen – The Hunger Games
Edward Snowden has created a problem for President Obama, his surveillance state apparatus, and the banking cabal that pull the strings in this empire of consumerism, by revealing the dirty secrets of a paranoid tyrannical ruling party. We are late in the game and pleading ignorance regarding how technology is being used by evil men for evil purposes is inexcusable. Snowden refused to remain a pawn in the NSA game and decided his fellow citizens needed to be warned about the dangers of an omniscient, secretive, malevolent state whose powers were unchecked and whose motives were geared towards oppression and coercion. He was a brilliant young cog within the government machinery, making good money, with a bright future if he conformed and obeyed, but he chose to be free. A free man can’t be bought, controlled or conquered. Edward Snowden decided someone needed to make a stand and that someone was him.
“Secrecy is the keystone to all tyranny. Not force, but secrecy and censorship. When any government or church for that matter, undertakes to say to its subjects, “This you may not read, this you must not know,” the end result is tyranny and oppression, no matter how holy the moti
ves. Mighty little force is needed to control a man who has been hoodwinked in this fashion; contrariwise, no amount of force can control a free man, whose mind is free. No, not the rack nor the atomic bomb, not anything. You can’t conquer a free man; the most you can do is kill him.”– Robert Heinlein
The explosive disclosures of government criminality, mass spying, cover-ups, lying to Congress by government apparatchiks, and conclusive evidence of a surveillance state completely out of control confirmed another truth for those not captured by the red/blue party propaganda. Snowden was declared a traitor by Obama, Romney, Schumer, McCain, Pelosi, Boehner, Reid, McConnell, Feinstein, Rove, and of course, the blood thirsty, hate spewing, dark-lord of the neo-cons – Dick Cheney. The immediate and united venomous response from the slimy politician snakes should have removed all doubt there is really one ruling party and the rest of us are nothing but pawns in their game. We live in a corporate fascist warfare/welfare surveillance state run by ultra-wealthy unelected men with evil intentions.
“We’ve slipped away from a true republic. Now we’re slipping into a fascist system where it’s a combination of government, big business and authoritarian rule, and the suppression of the individual rights of each and every American citizen. When it comes to any significant differences on foreign policy, economic intervention, the Federal Reserve, a strong executive branch, a welfarism mixed with corporatism, both parties are very much alike. The major arguments in hotly contested presidential races are mostly for public consumption to convince the people they actually have a choice.” – Ron Paul
Snowden’s response to the murdering thug Cheney calling him a traitor makes me proud to call him a hero and a patriot, on par with George Washington, Samuel Adams, and Thomas Paine.
“Being called a traitor by Dick Cheney is the highest honor you can give to an American.” – Edward Snowden
Obama and the Party are continuously being made fools of by a 30 year old Millennial, as he periodically releases information damaging to the government’s surveillance efforts on the American people and foreign leaders. Each revelation further erodes the trust people and countries once had in the moral leadership of the United States. Snowden is our mockingjay, a creature the NSA never intended to create. The predator drone happy Obama would like nothing better than to have Snowden eliminated, but he is faced with the same dilemma as President Snow in the fictional world of Panem, captured in this dialogue:
President Snow: I have a problem, Miss Everdeen. A problem that began the moment you pulled out those poisonous berries in the arena. If a girl from District Twelve of all places can defy the Capitol and walk away unharmed, what is to stop them from doing the same?
Katniss Everdeen: It must be very fragile, if a handful of berries can bring it down.
If the mighty American empire can be embarrassed by a sole young patriot, proving to the world they are in decline financially, morally, and militarily, it must be very fragile. Snowden’s revelations did not immediately spark rebellion, but an attitude of defiance is gaining traction, as the mood in the country darkens like the sky before a blizzard whose full fury will strike with a vengeance lasting for several years. Since our entry into this Fourth Turning in 2008 there have been sparks of rebellion (OWS & the original Tea Party movement) but they were immediately subverted, discredited and crushed by the Party and their propaganda media machines. The attitude of defiance can be seen in the rise of Bitcoin, citizens buying physical gold and silver despite the Federal Reserve/Wall Street efforts to discredit it, the efforts of hackers like Anonymous to disrupt the corporate fascist state, the tireless efforts of websites like Zero Hedge, Washington’s Blog, Charles Hugh Smith, and Mike Krieger to uncover the truth, and the relentless pursuit of liberty and freedom by Ron Paul and his army of patriots. It is time for more leaders and heroes to step up and act.
“I had been looking for leaders, but I realized that leadership is about being the first to act. I understand that I will be made to suffer for my actions, and that the return of this information to the public marks my end.” – Edward Snowden
Despite the monetary manipulations of the Federal Reserve arm of the Party, supported by the propaganda efforts of the corporate media arm of the Party, the extreme level of criminally induced wealth inequality will ultimately result in a second far worse financial crash that will topple this teetering edifice of corruption. The violent stage of this Crisis will then erupt.
“But as the Crisis mood congeals, people will come to the jarring realization that they have grown helplessly dependent on a teetering edifice of anonymous transactions and paper guarantees. Many Americans won’t know where their savings are, who their employer is, what their pension is, or how their government works. The era will have left the financial world arbitraged and tentacled: Debtors won’t know who holds their notes, homeowners who owns their mortgages, and shareholders who runs their equities – and vice versa.” – The Fourth Turning – Strauss & Howe
The first American Fourth Turning was a rebellion against a foreign empire. The second American Fourth Turning was an internal rebellion that killed 700,000 young men. The third American Fourth Turning resulted in a foreign conflict that resulted in the deaths of 65 million people. Do these once every 80 year turnings alternate between external and internal conflict? If so, we are on the verge of events that will tear the fabric of this nation apart. The debt, civic decay, and heinousness of those in power will lead to the disintegration of our existing social order and sheer chaos, as forces battle for the soul of the nation. What it is replaced by is unknown at this time. It could be something far worse, or it could be a rekindling of our nation’s founding heritage of liberty, freedom and civic duty.
Linear thinking old timers are likely to scoff at the notion that some trilogy of novels for teenagers could capture the mood of the time in a way that explains how the people of this country will respond to the current worsening Crisis. I’m sure the works of Steinbeck and Tolkien were scoffed at during the last Fourth Turning.
“The original American patriots were those individuals brave enough to resist with force
the oppressive power of King George. I accept the definition of patriotism as that effort to resist oppressive state power. The true patriot is motivated by a sense of responsibility and out of self-interest for himself, his family, and the future of his country to resist government abuse of power. He rejects the notion that patriotism means obedience to the state.” – Ron Paul
Do you reject the notion that patriotism means obedience to the state? Know your enemy.
“Remember who the real enemy is.” – Haymitch Abernathy – Catching Fire


via Zero Hedge http://feedproxy.google.com/~r/zerohedge/feed/~3/x_aZ7WVOk44/story01.htm Tyler Durden


 “The potential social and financial returns are
 The
The 