The Atlantic’s Franklin Foer Allegedly Identified As “Reporter-2” In The Sussmann Indictment

The Atlantic’s Franklin Foer Allegedly Identified As “Reporter-2” In The Sussmann Indictment

Authored by Jonathan Turley,

I have a column today in the Hill on the indictment of former Clinton campaign lawyer Michael Sussmann by Special Counsel John Durham.

The indictment fills in a great number of gaps on one of the Russian collusion allegations pushed by the Clinton campaign: Alpha bank.

Sussman and others reportedly pushed the implausible claim that the Russian bank served as a conduit for communications between the Trump campaign and the Kremlin.

The indictment removes the identity of key actors like a “Tech Executive” who used his connections with an Internet company to help the Clinton campaign (and said he was promised a top cyber security position in the widely anticipated Clinton Administration).

One of those figures however may have been identified: “Reporter-2.”

 Atlantic staff writer Franklin Foer wrote an article for Slate that seems to track the account of the indictment and, as such, raises questions over his role as a conduit for the Clinton campaign’s effort to spread the false story.

The indictment discusses how Fusion GPS pushed for the publication of the story, telling Foer that it was “time to hurry” on the story:

“The Investigative Firm Employee’s email stated, ‘time to hurry’ suggesting that Reporter-2 should hurry to publish an article regarding the Russian Bank-1 allegations. In response, Reporter-2 emailed to the Investigative Firm Employee a draft article regarding the Russian Bank-1 allegations, along with the cover message: ‘Here’s the first 2500 words.’”

The indictment states Reporter-2 published the article “on or about the following day, October, 31, 2016.”

That is when Slate published a piece written by Foer headlined, “Was a Trump Server Communicating With Russia?”  The story then was pushed by the Clinton campaign.

Foer has not addressed this close coordination with Fusion, including the showing of an advanced copy of his article. He later stated the following in the Atlantic:

“Every article is an exercise in cost-benefit analysis; each act of publication entails a risk of getting it wrong, and sometimes events force journalists to assume greater risk than they would in other circumstances. Before I published the server story, I asked myself a fairly corny question: How would I sleep the next week if Donald Trump were elected president, knowing that I had sat on a potentially important piece of information? In the end, Trump was elected president, and I still slept badly.”

The cost behind this article is getting it wrong but relying too greatly on a biased source without independent research. Foer states that he was more concerned with missing a chance on the story only to have Trump elected. We have been discussing the rise of advocacy journalism and the rejection of objectivity in journalism schools.

In this case, Foer allegedly coordinated with investigators paid by the Clinton campaign to publish a story that had little or no basis.

Even the researchers quoted in the indictment objected that the theory was unsupported and could bring public ridicule. Yet, the campaign continued to push the story and Foer ran it after allegedly sending an advance copy of his article to Fusion.

The next question is who is the “Tech executive”?

Tyler Durden
Sat, 09/18/2021 – 13:30

via ZeroHedge News https://ift.tt/3zlYltn Tyler Durden

Goldman: “This Needs To Change Before A Larger Correction Can Occur”

Goldman: “This Needs To Change Before A Larger Correction Can Occur”

Last week, we published one Goldman trader’s top ten reasons why investors are especially bearish for the last two weeks of September, which he then countered with a list of his own reasons why there is little to be worried about. Judging by last week’s market moves which saw the S&P swoon lower and slide sharply on Friday’s opex, it appears that once again Goldman was wrong. So, one week later, Goldman flow trader Scott Rubner has doubled down with a thread focusing on market technicals, in which he lays out what in his view – “given new market structure dynamics” – needs to change “before a larger correction can occur.”

So without further ado, here is Rubner’s latest Tactical Flow of Funds market summary, which he summarizes as “Consensus is Bearish! But the market is currently positioned for it“, which however is news to Wall Street because as the latest Fund Manager Survey found,  equity protection is at the lowest level since Jan’18, a far cry from the financial media – and Goldman’s – repeated erronous claims that everyone is hedged for a crash.

With that in mind, here is Goldman’s Scott Rubner on why one should buy this dip:

I did a number of back-to-back zoom calls this week and sentiment was more bearish than I have seen in a very long time. The 10 biggest reasons for the bear case are highlighted below. This was my pushback on the calls this week, who have been calling for a 2H September correction.

Given new market structure dynamics, this needs to change before a larger correction can occur. September already logged a massive +$32B inflows M-T-D (basically a few trading days). Money continues to flow into the market if the dips are small, there is a competition for dip alpha.

1. Global Equities logged +$12.7B worth of weekly inflows during week 36. The magic money tree keeps flowing as retail bought the dip again this week. Week 36 saw inflows into all asset classes, yet again, stocks, bonds, and cash. Issuance paper was absorbed during this week.

Source: Goldman Sachs Investment Research Division, Cormac Conners, as of 9/10/21. Past performance is not indicative of future returns

2. Global Equities have logged a massive +$725B worth of inflows YTD or $1.1 Trillion worth of annualized inflows.

** These next two bullets are the most important lines of this whole email.

3. Passive inflows have logged +$606B (~84%) of inflows, while active funds +$120B (~16%) of inflows.

4. For the first time in history, US passive fund AUM has now fully exceeded active fund AUM.

5. USA Passive AUM = $4.636 Trillion (52% of assets) vs. $4.287 Trillion (48% of assets).

6. Global Passive AUM = $7.565 Trillion. This is the first time above > $7 Trillion.

7. Geographically, USA has seen (+$452B worth of inflows) or 63% of flows vs. ROW at 37%.

8. Tech stocks saw 11 straight weeks of inflows. Let’s simply call this 2021 dynamic = USA, Passive, large cap, tech. This is new. I haven’t seen anything like this in the past. It’s made it hard to tactically short the market, and broad indices grind bps higher.

9. Passively Allocated? Passive Inflows = “you give me money, I buy” vs. “you ask me money, I sell”. For the past 45 weeks you have not asked for any money and given me a massive +$921 Billion worth of dollars.

10. To summarize, the 10 points above:

  • If you allocate $1 into SPY, that means 6 cents into AAPL, 6 cents in MSFT, 4 cents into GOOG/L, 4 cents in AMZN, 2 cents into FB. That is 22 cents of every $1 into 5 stocks.
  • If you allocate $1 into QQQ, that means 11 cents into AAPL, 10 cents in MSFT, 8 cents into GOOG/L, 8 cents in AMZN, 4 cents into FB. That is 41 cents of every $1 into 5 stocks.

Tyler Durden
Sat, 09/18/2021 – 13:00

via ZeroHedge News https://ift.tt/3lGNNjP Tyler Durden

Supply Chain Shipping Hell: “Just Get Me A Box” Says Logistics Manager

Supply Chain Shipping Hell: “Just Get Me A Box” Says Logistics Manager

Authored by Mike Shedlock via MishTalk.com,

Two years ago, the cost for a 40-foot container to transport goods from Asia to the U.S was under $2,000. Today it’s as much as $25,000.

When I saw this Bloomberg headline I thought it was about cardboard boxes. Instead, ‘Just Get Me a Box‘ is about shipping containers. 

It’s mid-August, and logistics manager RoxAnne Thomas’s phone won’t stop pinging. Her faucets, sinks, and toilets are waylaid near Shanghai, snagged in Vancouver, and buried under a pile of shipping containers in a rail yard outside Chicago. 

“Every step of the process, there’s still backlog,” said Thomas, 41, in one of several interviews from late July through August. “The beginning of the supply chain in China—I don’t think that’s going to get better for a year.” And the outlook more broadly? “A year and a half before things are truly back to normal.”

Although the pandemic has shuttered factories and shaken supplies of raw materials, Thomas’s chief challenge is freight, and it starts with what used to be cheap, plentiful commodities: shipping containers.

Two years ago, a 40-foot container cost less than $2,000 to transport goods from Asia to the U.S. Today the service fetches as much as $25,000 if an importer pays a premium for on-time delivery, which is a luxury

The fear is we’re ordering all this stuff for demand, and the demand is going to fizzle out before the product gets here,” Thomas says. With summer winding down, the big test of the global trading system’s resilience might still be ahead.

Commodity Shipping Rates Post Biggest Daily Gain in a Decade

Bloomberg also reports Commodity Shipping Rates Post Biggest Daily Gain in a Decade

Average rates for giant Capesize bulk carriers — which can carry products like coal, iron ore and grains — jumped by $6,700 a day on Monday, the most since 2010, as owners continue to benefit from strong demand for raw materials. The rally extended Tuesday, pushing the daily rate to almost $53,700, the highest level in 11 years, Baltic Exchange data show.

Parabolic Rise in Shipping Rates

Also consider this September 16 report: Ship Owner Genco Says Commodity Freight Rates Set to Spike.

Spot rates for container ships to move manufactured products have surged for 20 straight weeks and now stand 731% above their seasonal average over the prior five years, according to Drewry Shipping. John Wobensmith, the president and chief executive officer of Genco Shipping & Trading Ltd., said that prices to move commodities — which have already rallied sharply this year — may follow a similar cycle in the coming years with not enough ships being built to meet demand.

You do get to a point, and you’ve seen this in containers, where you hit a certain utilization rate and you start to go parabolic on rates,” he said in an interview. “I think we’re getting close to that period.

Beige Book Comments

  • San Francisco Fed: Prices rose substantially over the reporting period. Although lumber prices have dropped significantly, prices for other building materials, such as metals, cement, and wallboard have continued to climb. Other price increases were noted for energy, information technology, textiles, airline tickets, and agricultural products, such as fruits, meats, and seafood. The reported biggest drivers of these price hikes included higher shipping and logistical costs, continued supply chain disruptions, and rising labor costs

  • Atlanta Fed: District contacts continued to cite increasing nonlabor costs, especially for steel and freight, with multiple contacts referencing record increases in shipping container rates. The price of lumber stabilized but remained elevated relative to pre-pandemic levels, while mentions of increased food product costs became more widespread. Contacts cited the ability to pass through price increases with greater frequency, and with minimal resistance

  • Richmond Fed: Demand for cars continued to exceed supply while inventories were low, leading to lower carrying costs and increased margins for auto dealers. Clothing sales rose, and demand for furniture and home goods remained strong. Retailers noted shortages of and increased lead times for merchandise, particularly on foreign-made goods. One contact reported refunding several bridal parties because dresses did not arrive on time for weddings. Many retailers were able to maintain margins despite increases in costs of products and shipping.

  • National Comments: The other sectors of the economy where growth slowed or activity declined were those constrained by supply disruptions and labor shortages, as opposed to softening demand. In particular, weakness in auto sales was widely ascribed to low inventories amidst the ongoing microchip shortage, and restrained home sales activity was attributed to low supply.

The Beige Book is a summary of economic activity in each of the Fed’s 12 regions. It was released on September 8 and come out approximately 2 weeks before the Fed meets to set interest rate policy.

The Fed’s FOMC rate-setting committee meets again on September 21-22 with the announcement on the 22nd.

What About Cardboard Boxes? 

  1. August 6 Fortune: Online Retailers Get Boxed in by Higher Cardboard Prices

  2. April 6 Supply Chain Dive: Cardboard Prices Reach Record High Amid e-Commerce Demand

  3. July 9 DC Velocity: Strong Demand, Rising Costs Affect Packaging Strategies

DC Velocity

The price of corrugated products was rising through the spring, with some of the country’s largest producers of containerboard—the material used to make corrugated boxes—announcing increases of $50 to $70 per ton. The cost of packaging supplies in general was rising too, increasing by double-digits in many cases, according to government data and industry groups that track packaging demand. John Blake, senior director analyst with consulting and research firm Gartner, says changes in demand for packaging throughout the pandemic, combined with volatile supply chain activity last year, are driving the increases and shining a spotlight on the need for shippers to better manage sourcing strategies and packaging processes.

Shipping Rates Peaked?

In contrast to John Wobensmith’s call for shipping rates to go parabolic, Hapag-LLoyd AG  says Spot Rates Have Peaked.

One of the world’s biggest shipping lines has decided to stop increasing spot freight rates on routes out of Asia to Europe and the U.S. as it sees an end to the rally that has seen prices hit records. 

Hapag-LLoyd AG thinks spot rates have peaked and further increases are “not necessary,” according to Nils Haupt, the Hamburg-based company’s head of corporate communications. The move comes after French rival CMA CGM SA last week froze rates, saying it was prioritizing long-term relationships following a rally that has seen some spot rates jump more than sixfold in the past year.

While many shipping lines have taken advantage of rising spot prices, the rally is expected to “come to an end at some point,” said Jim Bureau, chief executive officer of logistics digital platform provider JAGGAER.

“The supply chain is extremely fragile right now,” he said. “How much more cost can carriers practically take on without increasing financial risk on both buyer and supplier?”

Prices Already Went Parabolic

This setup reminds me of the spike in lumber. 

Prices have already gone parabolic. The question at hand is when and how fast prices crash. 

But even if shipping costs fall in half, they will remain very elevated June 2020.

*  *  *

Like these reports? If so, please Subscribe to MishTalk Email Alerts.

Tyler Durden
Sat, 09/18/2021 – 12:30

via ZeroHedge News https://ift.tt/3tTxgfL Tyler Durden

Anti-Lockdown Protesters In Australia “Break Police Line” As Clashes Erupt

Anti-Lockdown Protesters In Australia “Break Police Line” As Clashes Erupt

Throughout the pandemic, Australia’s government has chosen to enact stringent restrictions to combat COVID-19. After the sixth lockdown since the pandemic began, anti-lockdown protesters in Melbourne have had enough with draconian virus measures and voiced their opposition in the streets on Saturday. 

Their right to protest freely was quickly deemed illegal as a massive brawl between demonstrators and police broke out. More than 200 people in Melbourne were arrested at illegal anti-lockdown rallies, according to Reuters

A rally in the Melbourne suburb of Richmond turned violent when police attempted to shut it down. Protesters broke through the police line in an epic fashion. 

Other clashes were captured on film. 

An aerial view of another group of protesters in Melbourne resisted police orders. 

On the ground, there was a massive police presence. RT News said local reports indicate around 2,000 officers were called in. 

The illegal demonstrations took place as the metro area endures its sixth lockdown since the pandemic began, with the broader state of Victoria reported over 500 infections today.

Victoria Police Commander Mark Galliott told local media that these protesters came out “not to protest freedoms, but simply to take on and have a fight with the police.” 

One of the causalities of the pandemic has been freedom of expression as the right to assemble has been banned in the guise of stopping the spread. 

By criminalizing peaceful protest and enforcing the authorities to intervene, the government of Australia is making the situation worse where it would entice even more freedom-loving people into the streets to protest tyranny. 

Tyler Durden
Sat, 09/18/2021 – 12:04

via ZeroHedge News https://ift.tt/3klEmH5 Tyler Durden

Ministry Of Manipulation: No Wonder Trust And Credibility Have Been Lost

Ministry Of Manipulation: No Wonder Trust And Credibility Have Been Lost

Authored by Charles Hugh Smith via OfTwoMinds blog,

Now that every financial game in America has been rigged to benefit the few at the expense of the many, trust and credibility has evaporated like an ice cube on a summer day in Death Valley.

Here is America in a nutshell: we no longer solve problems, we manipulate the narrative and then declare the problem has been solved. Actually solving problems is difficult and generally requires sacrifices that are proportionate to one’s wealth and power. But since America’s elite are no longer willing to sacrifice any of their vast power for the common good, sacrifice is out in America unless it can be dumped on wage earners. But unfortunately for America’s elite, four decades of hidden-by-manipulation sacrifices have stripmined average wage earners, and so they no longer have anything left to sacrifice.

Enter the Ministry of Manipulation, which adjusts the visible bits to align with the narrative that the problem has been fixed and the status quo is godlike in its technocratic powers. All this manipulation doesn’t actually solve the problems, it simply hides the decay behind gamed statistics, financial trickery and glossy PR. The problems fester until they break through the manipulated gloss and the public witnesses the breakdown of all the systems that were presented as rock-solid and forever.

Let’s take three core fields of manipulation: cost of living, Social Security and the stock market bubble. Each is a key signifier of the status quo functioning as advertised, and so manipulating them to fit the narrative is the elite’s prime directive. Goodness knows what would happen if people were exposed to the unmanipulated reality, but it wouldn’t be good for America’s self-serving power elite.

The cost of living–the Consumer Price Index (CPI), a.k.a. inflation–is the most threadbare trash heap of manipulation currently on display. Fully 40% of the Index is based on the opinion of random people rather than easily tabulated real-world data. I refer to the government’s comically wacky method of reckoning the cost of housing: ask a random bunch of homeowners what they guess they could rent their house for.

But wait, why not simply tabulate the actual rents being paid? That data is easily available, and could be made apples-to-apples by applying the methodology of the Case-Shiller housing index, which is to track the cost data of the same homes / flats over time. This would provide reliable data on the actual increase or decline in rents being paid.

Gathering actual real-world date is anathema because then the CPI would be much higher and not so easily manipulated. The same can be said of all the other tricks of manipulating the cost of living: seasonal adjustments (i.e., lop off price increases and attribute the reduction to “seasonality”) and hedonic adjustments (i.e., after adjusting for the better stereo and the rear-view camera, today’s $40,000 car is tabulated as “cheaper” than yesteryear’s $10,000 car of the same size).

If these same adjustments were applied to the weight and height of individuals, a 6-foot tall individual weighing 200 pounds would be “adjusted” to 6 inches in height and a weight of 2 pounds. This is a slight exaggeration but not by much, as today’s calculation of expenses are laughably understated in the CPI: today’s cars haven’t risen in cost at all according to the CPI, even as the number of work hours needed to buy a new car have skyrocketed–that is, when measured in purchasing power of wages, vehicles are much more expensive now.

Then there’s healthcare, which is a weighted as light as a feather in the CPI. Healthcare– you know, that sector which routinely bankrupts American families with bills in the tens of thousands?–is weighted as roughly equal to clothing. This is beyond absurd, but par for the CPI course of endless manipulations, all aimed at reducing the CPI so the public can be lulled into a fairyland belief that inflation has been trifling for decades, even as their paychecks buy a third less than they did a decade ago.

Next up, the appalling manipulation of Social Security. The first step is manipulating the CPI down so seniors’ annual increases can be held to near-zero (no better brand of cat food for you, retirees–tighten your budget if you want the lights to stay on).

The truly big manipulation is the artifice that there is a mythical “trust fund” that we are drawing down to pay Social Security benefits. The trick was pulled decades ago, when Social Security taxes did in fact go into an independent agency account. President Johnson decided that he needed all that “free money” to pay for his misadventure in Vietnam, so the Social Security account was combined with the federal general fund, and an accounting gimmick was created: a completely fake class of IOUs that were presented as a “trust fund”, IOUs with no marketable value at all.

There is no trust fund. When Social Security runs a deficit, the Treasury borrows the money in the same way it borrows all the other trillions of dollars needed to cover federal deficits. The money borrowed to pay Social Security is borrowed exactly like the money needed to pay the cost overruns on the F-35 aircraft or the fraud-riddled bills for meds paid by Medicare.

It’s all smoke and mirrors and artful manipulation, designed to serve the interests of those running the show. It’s the Big Con, intended to lull the public into a false confidence in the status quo narratives and technocratic magic.

Speaking of magic, look at how the stock market hits a low and then roars higher the same day every month. 

The “market” manipulation is so obvious that Comrade Powell of the Federal Reserve Politburo doesn’t even bother explaining it.

The Politburo cronies just buy the dip, the Fed and its proxies (Blackrock, cough-cough) jam stocks higher and the Fed’s cronies pocket billions–as shown on the chart below of the billionaires’ soaring Fed-generated wealth.

No wonder public trust in America’s self-serving institutions has cratered, and the credibility of the manipulators has been crushed. 

Now that every financial game in America has been rigged to benefit the few at the expense of the many, trust and credibility has evaporated like an ice cube on a summer day in Death Valley.

*  *  *

If you found value in this content, please join me in seeking solutions by becoming a $1/month patron of my work via patreon.com.

My recent books:

A Hacker’s Teleology: Sharing the Wealth of Our Shrinking Planet (Kindle $8.95, print $20, audiobook $17.46) Read the first section for free (PDF).

Will You Be Richer or Poorer?: Profit, Power, and AI in a Traumatized World (Kindle $5, print $10, audiobook) Read the first section for free (PDF).

Pathfinding our Destiny: Preventing the Final Fall of Our Democratic Republic ($5 (Kindle), $10 (print), ( audiobook): Read the first section for free (PDF).

The Adventures of the Consulting Philosopher: The Disappearance of Drake $1.29 (Kindle), $8.95 (print); read the first chapters for free (PDF)

Money and Work Unchained $6.95 (Kindle), $15 (print) Read the first section for free (PDF).

Tyler Durden
Sat, 09/18/2021 – 11:30

via ZeroHedge News https://ift.tt/3Am6bo0 Tyler Durden

Facebook Deletes German Anti-Lockdown Groups As New Censorship Rules Go Into Effect

Facebook Deletes German Anti-Lockdown Groups As New Censorship Rules Go Into Effect

This week, Facebook announced a new enforcement policy that seeks to deplatform groups who coordinate online and spread misinformation, hate speech, and incite violence.  

The new “coordinated social harm” policy was immediately used against 150 pages and groups connected to Germany’s Querdenken (Lateral Thinking) movement, which has routinely fueled resistance to government health restrictions and vaccines through anti-lockdown protests.

Facebook’s head of security policy Nathaniel Gleicher wrote in a blog update Thursday that his team has been “expanding our network disruption efforts so we can address threats that come from groups of authentic accounts coordinating on our platform to cause social harm.” 

Gleicher said: “Today, we’re sharing our enforcement against a network of accounts, Pages and Groups operated by individuals associated with the Querdenken movement in Germany.” 

“We removed a network of Facebook and Instagram accounts, Pages and Groups for engaging in coordinated efforts to repeatedly violate our Community Standards, including posting harmful health misinformation, hate speech and incitement to violence. We also blocked their domains from being shared on our platform. This network was operated by individuals associated with the Querdenken movement in Germany, which is linked to off-platform violence and other social harms,” he said. 

Gleicher said the new policy allows Facebook to act against the “core network” of a group that commits widespread violations. He said individuals associated with the Querdenken movement regularly violated the platform’s terms of service by spreading health misinformation, inciting violence, bullying, and harassment. 

Thursday’s action moves Facebook into a more aggressive role as the judge of the “new normal” in a post-COVID world. They’re the deciders of right and wrong and won’t let people with opposing views use their platform. 

We have previously discussed Facebook’s move to align itself with pro-Biden media. It was found that the Biden Administration has routinely flagged anti-vaxx material to be censored by the social media company.

When it comes to politicians, celebrities, and other high-profile users of the platform (but not Trump), they’re given special treatment in what appears to be a two-tier digital society where only leftist points of view can be expressed while everyone is deplatformed. 

Tyler Durden
Sat, 09/18/2021 – 11:00

via ZeroHedge News https://ift.tt/3hJVqVw Tyler Durden

The Funny-Money Game

The Funny-Money Game

Authored by Alasdair Macleod via GoldMoney.com,

The sense of general unease that I detect among those I meet and discuss economics and financial matters with is increasing – with good reason.

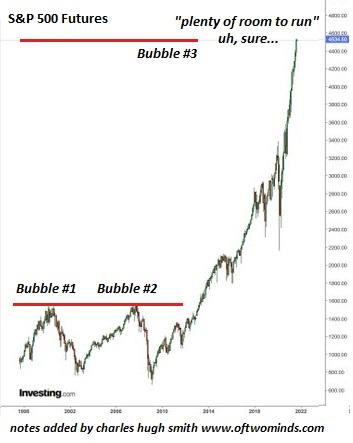
Clearly, what everyone calls inflation, rising prices or more accurately currency debasement, will lead to higher interest rates, threatening markets which are unmistakably in bubble territory.

The consequences of rising prices and interest rates are still being badly underestimated.

In this article I get to the source of the inflation problem, which is the monetary debasement of the dollar and other major currencies. An important part of the problem is that mathematical economists have lost sight of what their beloved statistics represent —none more so than with GDP.

I explain why GDP is simply the total of accumulating currency and credit which is wrongly taken reflect economic progress – there being no such thing as economic growth. Once that point is grasped, the significance of this basic error becomes clear, and the fiat currency paradigm is revealed for what it is: a funny-money game that will go horribly wrong.

There is only one escape from it, and that is to own the one form of money that is no one’s counterparty risk; the one form of money that always comes to humanity’s rescue when fiat fails.

And that is gold. It is neglected by nearly everyone because it is the anti-bubble. The more that people believe in fiat-denominated assets, the less they believe in gold. That is until their funny-money games implode, inevitably triggered by sharply rising interest rates.

Introduction

Those of us with grey hairs gained in financial markets can, or should, recognise that after fifty years the funny-money game is ending. Accelerated money printing has led to what greenhorn commentators call inflation. It is not, as they claim, rising prices: they are the consequence of the monetary expansion which was the original and remains the correct definition of inflation.

Rising prices in the aggregate are nothing other than currency debasement. And currency debasement leads, as surely as night follows day, to higher interest rates. And higher interest rates lead to falling asset values. For the bullish investor, that is all he or she needs to know.

But that doesn’t reckon with crowd psychology, leading investors to prefer to see and hear no evil rather than reason. As individuals, we need to stand back from our own circumstances and prejudices to gain a sense of perspective, to turn our greed for ever-rising stock prices into a fear of losses before the crowd realises that the outlook has changed for the worse and attempts to stampede into safety.

Hence, an understanding of the relationships between politics, economics and catallactics in current times matters more than usual. Even though nearly all investment is handed to so-called expert managers in pension funds, insurance companies, banks, portfolio managers and financial advisors (whose advice is usually taken unquestionably), the delegation of responsibility for our investments is always to those who extrapolate the past into the future. It amounts to a strategy unable and unwilling to consider and evaluate factors of change. The herd instinct has moved on from Charles Mackay’s Madness of Crowds to create and drive a madness of regulated institutions which hang on to a central banker’s every words. In turn, central banks have striven to eliminate the uncertainties of free markets and now control interest rates with a Stalin-like severity. Believing in their own propaganda, central bankers themselves have become fully captured by this funny-money game.

In an article for Goldmoney two weeks ago I pointed out that Jay Powell’s Jackson Hole speech on monetary policy did not mention money once. And most investing institutions willingly embrace the fiction that inflation is of prices and not money. By buying fully into the Fed’s meme, they have blinded themselves to the consequences for interest rates. They comfort themselves that the Fed is in control because it has been in control over markets for nearly all their professional lives. If the Fed says inflation is transient, it will be so.

It is not just America’s Fed. All the major central banks are captured by similar delusions about money, or rather over the management of their currencies which is no longer with the simple objective of controlling their purchasing power. Instead, currency and credit have become the essential tools for funding excess government spending. And even if leaders such as President Biden or Boris Johnson, like St Paul on the road to Damascus, undergo a sudden conversion to the merits of sound money, they would face the task of stemming the tide of rapidly escalating social liabilities such as pensions and healthcare, which have nothing to do with the covid crisis.

No, the establishment is fully committed to currency debasement as a means of funding the state’s increasing need for revenue. It requires concealment of the true situation, which is why Jay Powell and his fellow central bankers are encouraged to ignore any connection between the expansion of circulating currency, credit and prices.

It involves systemic delusion on all aspects of economic policy in favour of the survival of socialistic redistribution. But this article focuses on one aspect central to it: the fallacy of relying upon statistics and where it is likely to lead.

Mises’s evenly rotating economy

The Austrian economist, Ludwig von Mises, pointed out that there is a fundamental difference between an economy and the statistics used to represent it. In the real world, it takes time to do things; to anticipate, to plan, to implement. The desires of tomorrow and thereafter evolve through time, as do the means to supply them. And in economics, time is Man’s most precious commodity. But statistics cannot capture time. They only record what has passed.

You cannot capture human progress or the lack of it through statistics. Statistics are no more than an accounting mechanism for quantifying economic transactions after they have occurred. If everyone tomorrow does exactly what they did yesterday like mechanical robots lacking motivations and desires, statistics for yesterday would be a reasonable representation of what is to pass tomorrow. The same would be true for what happened last year as a precedent for next year. In other words, we would have an economy which conforming with mathematics evenly rotates.

It is of course an impossibility. As von Mises pithily put it,

“Action is change, and change is in the temporal sequence. But in the evenly rotating economy change and succession of events are eliminated. Action is to make choices and to cope with an uncertain future. But in an evenly rotating economy there is no choosing, and the future is not uncertain as it does not differ from the present known state. Such a rigid system is not peopled with living men making choices and liable to error. It is a world of soulless unthinking automatons. It is not human society; it is an anthill.”

With hindsight, statisticians adjust their models from earlier expectations to what has occurred as a basis for future predictions. However, what happened yesterday will condition us for what happens tomorrow because we are all conditioned by experience, but no more than that. The fact that we continually make plans for an improvement in our condition is unequivocal proof that no economy evenly rotates. But it is a useful concept because it allows governments to estimate revenues, and it allows businesses prepared to dig into the details to use estimates of current markets for their investment and production plans. But to take the concept of an evenly rotating economy as the basis of economic prediction is a mistake made today by nearly everyone.

Nearly everyone now talks about economic growth represented by gross domestic product. But in GDP they unconsciously describe an evenly rotating economy, which they assume can grow, confusing growth with the progress they think they are describing. So ingrained is the habit of substituting GDP for economic progress, that this unconscious deception has become fundamental to maintaining the credibility of monetary policy.

Defining GDP

So far, we have described what GDP is not, pointing out the difference between a static economic model stripped of time and the dynamic reality of a working economy. We are now able to consider what GDP represents, and why it changes through successive years.

GDP can be estimated by using three different approaches: income, expenditure, and production. In theory they should produce the same result. In practice, significant differences arise because they are based on different administrative and data sources that are subject to errors and omissions, and all the information is not available at the same time. The outcome is therefore subject to revisions, and usually combines these approaches to give a final estimate of total spending.

Irrespective of the approach, essentially GDP is the sum of household spending, investment in production, government spending, and net exports. Much is excluded, such as financial transactions, second-hand transactions, and the cash economy.

Now, we must consider why GDP increases. Let us assume that in a closed economy, where trade and capital flows across borders do not exist, Year 1’s GDP was $100bn. Let us now assume there is no change in the quantity of currency and credit in Year 2, and that individuals’ cash liquidity balances do not alter either. Therefore, in Year 2 GDP must be the same as in Year 1. In other words, economic activity will obviously change as well as prices for individual goods and the number of transactions will vary. But those changes will be contained within the unchanged GDP total, which will remain unchanged at $100bn, because there is no additional currency and credit involved. The same must be true of successive years under the same conditions. The deployment of currency and credit between household spending, investment in production, and government spending will almost certainly differ, but they must always total $100bn.

With GDP unchanged, there is nothing to stop the economy progressing, but that is a matter decided between consumers and producers. Government spending, so long as it is fully funded by taxes, will affect the speed of economic progression but it will not alter the GDP total. The same is true of changes in the split between consumption and savings.

Another way of expressing it is in terms of Say’s law, which defines the role of money in the context of the division of labour. Over the course of a year, we make net profits or losses and earn income. We allocate the proceeds into spending, savings and taxes which are recycled by the state. As the mathematical economists might say, broad money supply being the total currency and credit in the economy has a velocity of circulation of precisely one.

If there is no increase in the quantity of currency and credit, then those that improve their earnings and profits do so at the apparent expense of those that don’t. But that is a function of an economy’s evolution, the reallocation of resources to their more productive use — Schumpeter described it as creative destruction.

But overall, an improvement in the general economic condition comes from an increase in the currency’s purchasing power, with each unit of it buying more and improved goods and services at the year-end compared with its start. Even those who experience a decline in income benefit from the improvement in economic conditions, lifting more out of poverty than governments can ever achieve by increasing taxation to pay for welfare.

Cross-border trade and capital flows have been excluded from our theoretical example to simplify matters and we should comment on these separately. In a free market, an imbalance in trade sees capital flows move in the opposite direction. If importers and exporters dispose of foreign currencies acquired through trade, then the model still stands because no currency nor bank deposits are destroyed.

Without monetary and credit interventions, even an overall trade deficit will not alter the quantity of currency outstanding, only its ownership changes. The adjustment will be reflected in the exchange rate and not in changes to the amount of currency and credit.

An export surplus leads to domestic holders either possessing foreign currency or selling it for the domestic equivalent. If foreigners end up holding it, a currency remains in the domestic money supply through correspondent banking. The ownership of currency changes, and again, the adjustment is in the exchange rate. But in practice, there will be changes in the levels of short-term trade finance outstanding, and central banks and exchange stabilisation funds routinely intervene in currency markets, withdrawing or adding to outstanding currency levels from time to time.

Returning to the example above, if in Year 2 GDP increases over Year 1 by, say, ten per cent to $110bn, it can only be because the quantity of currency and credit circulating in the economy has increased, not necessarily the underlying economic activity. Furthermore, in practice, bank credit fluctuates and is subject to cycles of expansion and contraction. And central banks attempt to stimulate demand for currency by managing interest rates. They intervene directly by quantitative easing and through repo and reverse repo market operations. But the fact remains that the increase in GDP can only reflect an increase in the quantity of currency and credit.

We can therefore conclude that what is commonly described as economic growth is only an increase in the quantity of money and credit in the economy and does not reflect changes in the underlying economic condition.

Empirical evidence of the GDP/broad money relationship

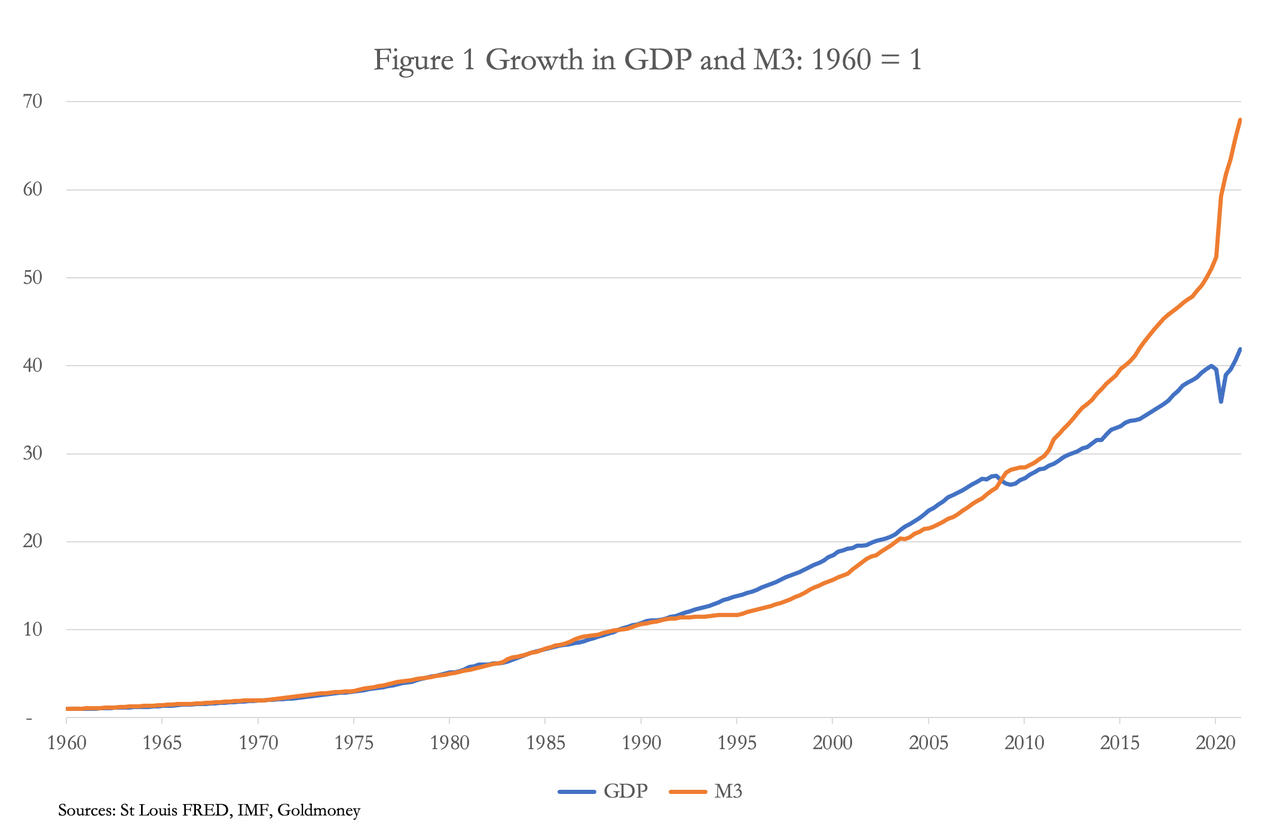
Figure 1 below shows the relationship between broad money supply and GDP for the US over the last sixty-one years. As one would expect from the analysis above, there is a high degree of correlation between the two, but there are growing discrepancies, particularly following the Lehman crisis, that bear further examination.

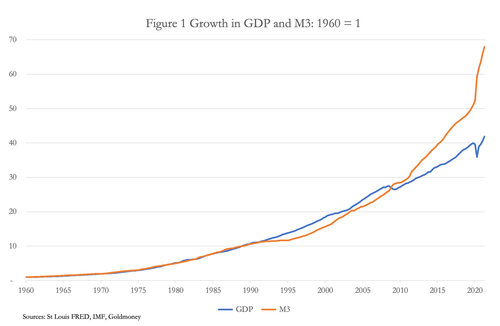
In practice, there is a numerical difference between nominal GDP and M3, due to statistical and other errors. But what concerns us is the rate of change for both measures, which is why they have been recast in the chart to show multiples of expansion from a 1960 base.

In the thirty years from 1960-1990, the expansion of both measures was identical. It was only from 1992 onwards that a divergence became noticeable, coincidentally following the financialisation of the US economy when commercial banks increasingly undertook purely financial activities. This gave rise to shadow banking activities, which is bank lending by lenders, brokers and other intermediaries which fall outside the realm of regulated banking and official statistics.

While not all shadow banking involves credit creation, it led to an unquantified amount of credit creation passing from regulated banks to shadow banks, depressing the headline M3 money statistic. Banks used off-balance sheet vehicles such as collateralised loan obligations to finance residential property lending, a practice which blew up during the Lehman crisis. The banks were forced to take some of those obligations on board, which is why growth in M3 crossed over and became greater than that of GDP in October 2008.

In other words, the divergence of M3 growing at a lesser rate than nominal GDP until the great financial crisis of 2008-2009 was not divergence when credit creation by shadow banks is considered. Allowing for shadow banking, our analysis of the relationship between GDP and M3 is fully confirmed by the numbers until the Lehman crisis occurred.

That was followed by a massive inflation of currency and credit as the Fed effectively wrote an open cheque to save the financial system and is reflected in the subsequent acceleration of M3 growth relative to that of GDP.

Since that financial crisis, nominal GDP has increased by 55% (to April 2021), while M3 increased by 140%. And there is still an additional unknown level of credit creation by shadow banks. While these forces are reflected in GDP visibly accelerating in its rate of increase despite the covid shock, the surprise is that GDP has not increased by even more.

Part of the explanation is temporal, because it takes time from the creation of money and credit to enter general circulation. The rapid expansion of M3 over the last eighteen months can therefore be expected to fuel further rises in GDP following covid lockdowns. Furthermore, increasing amounts of currency and credit are fuelling asset price inflation, particularly through quantitative easing, so are excluded from GDP statistics and will take yet more time to work through to the goods and services included in GDP.

The inappropriateness of a CPI deflator

Given that GDP reflects only the quantity of currency and credit in the economy, the practice of deflating its expansion by an index of prices serves no purpose. It is only consistent with the belief that changes in the quantity of money have little or nothing to do with prices.

But by applying an adjustment for the consequences for prices from earlier monetary expansion, the use of GDP as an indicator of the state of the economy is falsely legitimised. Furthermore, the term “real GDP” for GDP modified in this way helps to fix it in the public mind as the supreme indicator of economic activity, and its increase a laudable objective for monetary policy. Behind this blunder is a chequered history.

In pursuing indexation as a means of public compensation for price inflation forty years ago, statist economists came to realise the considerable impact on state finances. Indexation of increasing quantities of bonds and of a range of welfare payments following the inflationary 1970s proved to be too expensive for expansionary governments, and consequently statisticians have continually modified their calculations of price inflation to reduce the burden on government finances.

The general level of prices is only a concept and therefore cannot be measured. Statistics of aggregated prices and their construction become little more than a matter of policy. It allows the statistician to use sophisticated mathematical tools and methods to claim almost anything he wishes. Despite a rapidly accelerating inflation of currency and credit, government statisticians have managed to peg annual increases of consumer prices at roughly two per cent for some time. Two per cent happens to be the inflation target commonly set by central banks when setting interest rates, and with the CPI statistic under firm control, until recently policy makers have been able to continue to maintain interest rates at the zero bound.

Independent statistical analysis from Shadowstats.com highlights the statistical deception perpetrated by the CPI method by producing a rival index shorn of all the statistical modifications introduced to reduce the numbers since 1980. It currently shows an unadjusted rate of annualised price increases at over thirteen per cent. Admittedly, even the official rate has now escaped its managed two per cent level and only this week was admitted to be 5.3%.

While pointing out the self-serving nature of price statistics we must not forget they do not serve a credible economic purpose. Changes in value of money cannot be defined in the same way in which changes in the size or weight of an object are recorded. In any event, a price index is a collection of historical prices with very little connection to the future however it is assembled. And to use it as a basis for monetary policy is to make the same mistake of assuming that growth in GDP is evidence of a growing economy. It fails to recognise that catallactics is an evolving human science of choice which cannot be defined by the mathematics applicable to the natural sciences.

The price consequences of monetary policy

Now that it has been established beyond doubt that GDP reflects only monetary expansion, we can conclude that driven by excessive levels of currency and credit growth GDP will rise significantly in the foreseeable future, irrespective of subsequent monetary policy. Unless that is, for some reason there is a sudden and substantial contraction of currency and credit. But given the Fed’s apparent belief that GDP signifies the state of the economy, we can be assured that such an outcome will not be permitted.

Instead, a post-covid GDP recovery is being hailed as evidence of successful economic management by the monetary authorities. But their measurement of inflation through price indices is about to impart an enormous headache. We have noted that the CPI is currently recorded as rising at 5.3% annualised, so the Fed’s hopes that the rise is transient and that the statisticians at the Bureau of Labor Statistics can bring it back under control look remoter by the day.

There are two basic forces in the relationship between the quantity of money and prices. The first is changes in the money quantity, which if increased will tend to lower its purchasing power. The second is changes in the currency holders’ perception of the relation between money and goods, reflected in changes in the liquidity to hand. Assuming for the moment that that does not change, we can see that the recent rapid increase in M3 money illustrated in Figure 1 above is bound to increase the GDP number. But GDP is the sum of transactions captured within it, and irrespective of whether economic activity increases or diminishes, prices in those transactions can only rise because of the sheer size of the disparity between GDP and the quantity of broad money. And given the difference between M3 and GDP illustrated in the chart in Figure 1, and adding to M3 the creation of an unknowable amount of extra credit from shadow banking, the latent forces driving prices higher by debasing the currency are considerably greater than commonly thought.

The first force in the money relationship described above conforms with the equation of exchange, the mathematical expression of the relationship between the quantity of money and prices in the aggregate. But if there is a theme in this article it is to point out the error of applying mathematical relationships to human action. The second of the two forces mentioned above is changes in crowd psychology, which will also determine the value of a currency relative to goods.

This can be illustrated by considering changes in the average level of currency liquidity held by its users. As distinct from allocations to savings, currency to hand represents unspent production, held in reserve for unexpected changes in a person’s needs and wants.

But if in the aggregate holders of currency liquidity suspect that prices of the goods and services that they might desire but do not immediately need will begin to rise more rapidly, they will reduce their currency in hand to buy those goods. This is a fair description of current conditions: a wide range of consumer prices are rising unexpectedly, encouraging anyone with excess liquidity to dispose of it, exacerbating the price trend. And we can see from the excessive quantity of currency and credit yet to be unleashed into the GDP-recorded economy that this trend is likely to have an effect additional to the mathematical relationship, possibly driving the dollar’s purchasing power down more rapidly than recent increases in M3 money would suggest is likely.

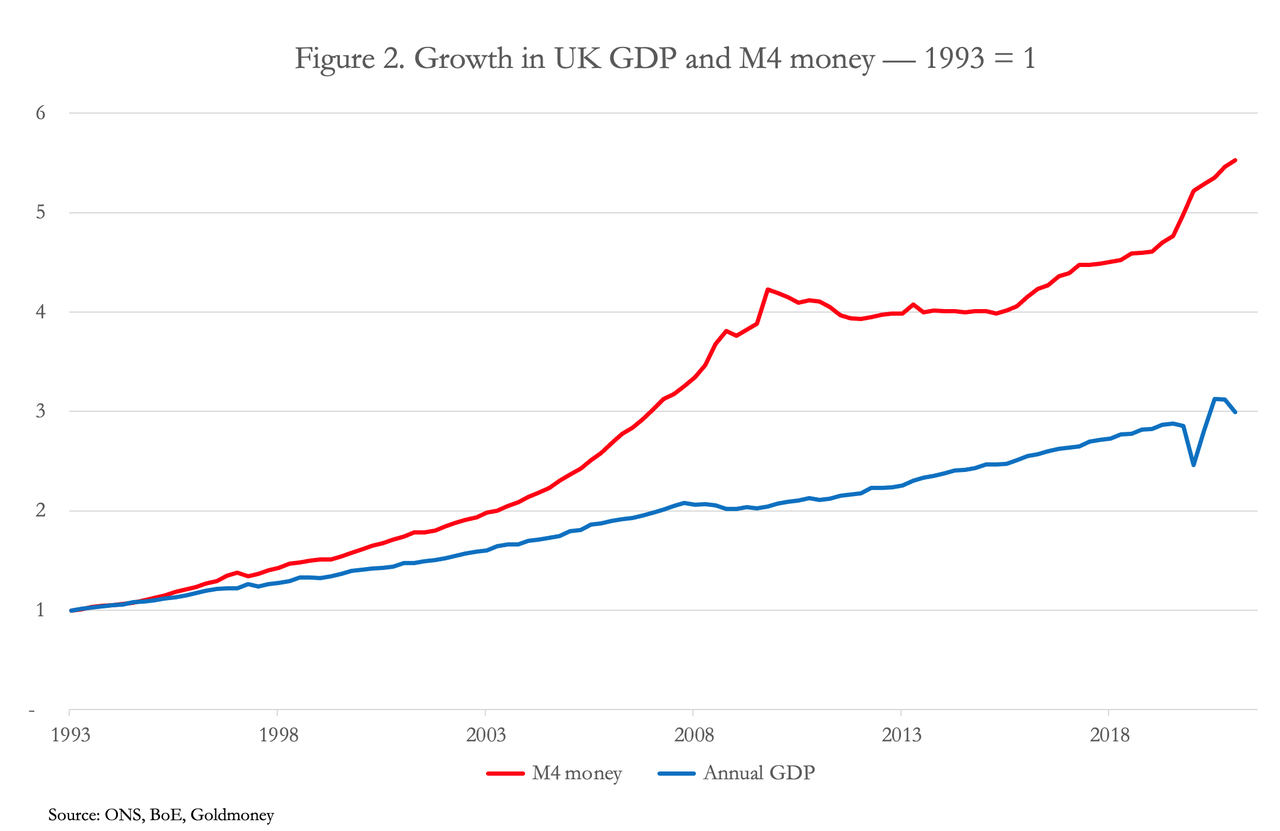
The situation in the UK mirrors that of the US, with the broadest measure of money (M4 in this case) exceeding GDP by an alarming margin. This is illustrated in Figure 2, which is based on 1993, following big-bang in the mid-eighties when the financialisation of banking will have begun to impact the bank lending relationship to GDP.

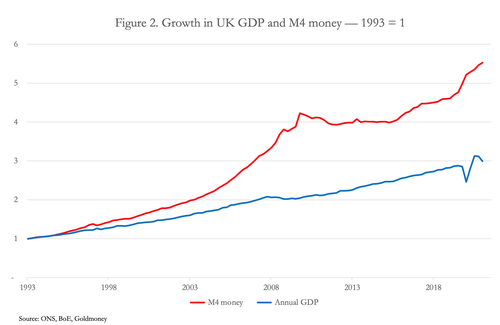
The disconnection between GDP, which measures goods and services excluding financial activities, and a more rapidly increasing M4 reflects the development of financial services in London following big-bang in the mid-eighties. But in time, currency and credit can be expected to cross over from purely financial activities into those recorded in GDP.

The consequences for interest rates and financial markets

Examining the true relationships between currency, credit and the economy strongly suggests that a price inflation shock is still in its early stages. We have established that growth in GDP is little more than growth in broad money, and we have explained the disparities in their rates of growth. In addition to the mathematical effect of the theory of exchange, we have noted that the trend of rising prices is likely to accelerate as consumers reduce their cash liquidity by buying goods before prices rise even more. Together, these factors can be expected to lead to a generally unexpected fall in the dollar’s purchasing power, and we have further noted that the major central banks (except possibly China’s) have pursued similar monetary policies, which will have similar consequences.

Interest rates must increase, and the increase in dollar and sterling rates must be substantial enough to stabilise these currencies if they are not to collapse entirely. But at this juncture we are less interested in the ultimate future for fiat currencies than the effect on financial asset values.

Fixed interest bond yields will rise substantially, which means that prices will fall. Higher interest rates and bond yields in turn will undermine equity values. To the extent that financial asset values are in a bubble, we can expect a substantial derating. Much of shadow banking is tied up in ETFs, which will also see a substantial contraction.[iii] It is also worth noting that stablecoins, such as tether, represent yet further monetary expansion, being issued in the same manner as central banks issue cash and credit banks’ reserve accounts. The FSB has yet to officially include stablecoins in its shadow banking estimates.

The monetary response from central banks will attempt to stop markets from falling significantly for three reasons: central banks are committed to funding government deficits, and rising government bond yields hamper that objective; they believe that buoyant financial markets are essential for maintaining the public’s confidence in the economic outlook; and they are acutely aware that falling asset prices are likely to trigger an acceleration of collateral liquidation by the banks as theorised by Irving Fisher following the 1930s depression.

Gold

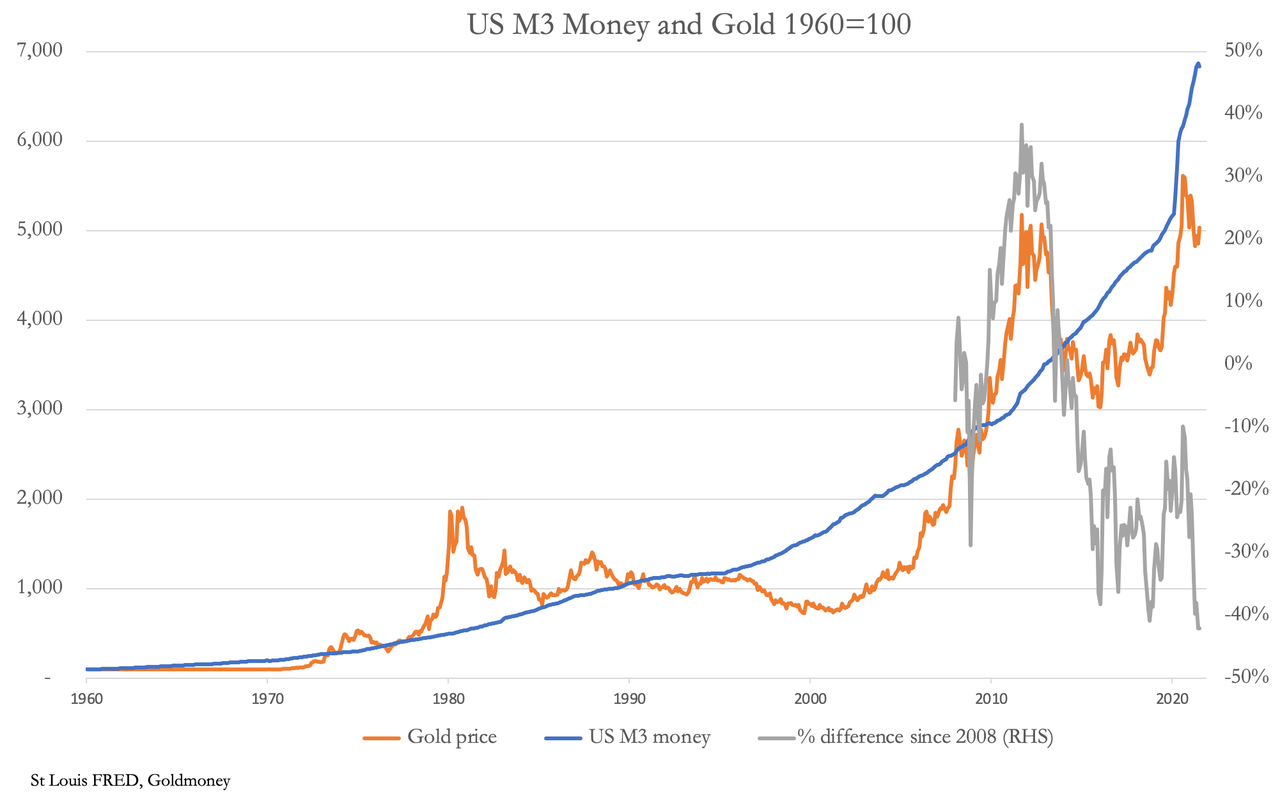
Figure 3 shows the relationship between the dollar gold price and US M3 money supply. The grey line shows the difference between the two, which currently shows gold at a discount of 42% relative to where it was at the time of the Lehman crisis.

It is a mistake to assume that the gold price should adhere to the growth of broad money supply, which is confirmed by periods of significant over and under relative valuations. But in general, an acceleration of the rate of monetary expansion can be expected to lead to higher gold prices.

While M3 has increased substantially in the last eighteen months gold has been left behind. In a sense, this is not surprising, because the current financial asset bubble and interest rates held at the zero bound can only be maintained if there is supreme and continuing confidence in the prospects for asset values and currencies. Put another way, when there is a financial bubble, gold can be regarded as the anti-bubble, so is bound to be out of fashion.

Following the Lehman crisis, the gold price rose to $1,925 against a background of mounting concern for the global banking system. Compared with the track of M3, gold stood at a premium of 40% at that time, which we can now say discounted monetary inflation too far ahead, in the absence of an unmanageable financial crisis materialising. Today, it stands at a discount of 42%, which suggests that optimism in the fiat currency system is at a similar but opposite extreme to 2011.

There is little doubt that the financial asset bubble will be burst by rising interest rates, which will be beyond the Fed’s control for the reasons outlined in this article. That being the case, there is a strong argument for leaving the funny-money game to the madness of crowds and the madness of regulated institutions. The only credible way to insulate oneself from it completely is by retreating into the one asset for which there is no counterparty risk — physical gold, and perhaps some physical silver which has the additional benefit that ownership of it is less likely to be banned by panicking governments.

And the substantial discount in the relative rates of growth makes gold appear to be exceptionally undervalued.

Tyler Durden
Sat, 09/18/2021 – 10:30

via ZeroHedge News https://ift.tt/2YYXPF1 Tyler Durden

Europe’s Soaring Natural Gas Prices To Persist For “Weeks To Come,” IEA Warns

Europe’s Soaring Natural Gas Prices To Persist For “Weeks To Come,” IEA Warns

IEA Executive Director Fatih Birol delivered some unwelcoming news for commercial and residential natural gas buyers during an interview on Bloomberg TV Friday morning. He said European natural gas prices might push higher in the coming weeks as the heating season begins. 

“We may still see gas prices a bit high for the next days and weeks to come,” Birol said in the interview. The “most important factor here will be in the short term — how the winter conditions will be.”

He said if the European winter season is “harsh.” This would suggest natgas prices may remain elevated and or even accelerate higher. So far, European gas prices have more than tripled this year. 

Birol said, “very strong demand” due to the economic rebound has been a driver in higher natgas prices. There’s also the issue of declining flows from Russia, which have failed to replenish European stockpiles ahead of the heating season.

Natural gas supplies are below average for this time of year. 

For Central Europe, maximum average temperatures have already slipped from around 80F in mid-August to about 70F. By the end of the month, maximum high temps are slated to drop between the 55F to 60F range. This means the heating season is beginning. 

Another way to quantify increasing heating demand in Central Europe is through heating degree days, which measure the energy needed to heat a building. The index rises when daily average temperatures are below 65F.

Uncertainty looms over the replenishment of European natgas supplies as colder weather has arrived. Russia’s Nord Stream 2 pipeline to Germany could be Europe’s saving grace, but regulators could take months to certify before taking shipments. 

If European leaders don’t get ahold of hyperinflating energy prices, there will be a growing discontent of people and businesses leaders who will exert political pressure.

Combine soaring energy prices with rising food prices, and it’s going to be a troubling fall/winter season for working-poor folks who’ve had their wage gains stripped by inflationary forces. 

Tyler Durden
Sat, 09/18/2021 – 09:55

via ZeroHedge News https://ift.tt/3nH2g1H Tyler Durden

Almost A Quarter Of COVID Patients In England Are Being Treated For Something Else

Almost A Quarter Of COVID Patients In England Are Being Treated For Something Else

Authored by Paul Joseph Watson via Summit News,

Almost a quarter of people in hospitals in England who are being counted as ‘COVID patients’ are actually being treated for other illnesses, according to a new report.

“Health service statistics show there were 6,146 NHS beds taken up by people who were Covid positive on September 14th, the latest date data is available for,” reports the Daily Mail.

“But just 4,721 patients (77%) were primarily being treated for the virus, with the remaining 1,425 receiving care for other illnesses or injuries. They could include patients who’ve had a fall or even new mothers who tested positive after giving birth.”

In the Midlands area meanwhile, a full third of patients supposedly being treated for COVID were actually in hospital for different reasons.

The report also acknowledges that as many of half of patients who enter hospital only test positive for COVID after being admitted for an unrelated illness.

The difference between the ‘official’ figure and the real one is important because the UK government has said it won’t hesitate to re-enforce mask mandates, vaccine passports and a new lockdown this winter if hospitalizations continue to rise.

As we previously highlighted, despite the fact that the vaccine was supposed to prevent hospitalizations, many of the same experts who lobbied for the previous lockdowns are claiming that numbers are on a trajectory that will mandate new lockdown restrictions.

Just 24 hours after health secretary Sajid Javid asserted that they had been completely scrapped, the government reversed its position, saying that vaccine passports will in fact form a “first-line defence” against a winter wave of coronavirus.

Back in December, the same government told the public that there was no plan whatsoever to introduce vaccine passports even as they were paying private corporations to build the system.

*  *  *

Brand new merch now available! Get it at https://www.pjwshop.com/

In the age of mass Silicon Valley censorship It is crucial that we stay in touch. I need you to sign up for my free newsletter here. Support my sponsor – Turbo Force – a supercharged boost of clean energy without the comedown. Get early access, exclusive content and behinds the scenes stuff by following me on Locals.

Tyler Durden
Sat, 09/18/2021 – 09:20

via ZeroHedge News https://ift.tt/3nLJiXC Tyler Durden

Nationwide Blackout Hits Syria After Gas Pipeline Bombed

Nationwide Blackout Hits Syria After Gas Pipeline Bombed

A blackout has reportedly plunged all of Syria into darkness Friday into Saturday, with Syria’s state-run SANA announcing the nationwide power outage is due to an attack on a gas site and pipeline in southern Damascus. 

Into the overnight hours, electricity reportedly returned to much of the capital of Damascus, while the Minister of Electricity Ghassan al-Zamil vowed to restore the rest of the country’s power in a matter of “hours” as technicians are on the scene.

Illustrative image: gas pipeline bombing from earlier in the war, Reuters file.

The timing of the event suggests possible Israeli covert sabotage, given the blackout began just as the second batch of fuel trucks was crossing into Lebanon from Syria. Earlier in the day reports emerged that an Iranian tanker began offloading fuel at Syria’s Baniyas port

It was part of Hezbollah’s promise to get Iranian fuel into Lebanon amid the country’s energy crisis, which has seen its own severe blackouts hit major cities and towns over much of the past month.

There’s also the possibility of an attack on Syria’s infrastructure by remnant anti-Assad insurgent groups, also as there’s again in recent weeks been renewed fierce fighting centered on the southern Syria city of Deraa.

According to a popular Syria blogger and commentator, “Sources in southern Damascus reported hearing an explosion seconds before the blackout. All of this happened as the second batch of tankers carrying Iranian fuel was crossing into Lebanon.”

Speculating on the question of a possible external sabotage operation that caused the blackout, given the deeply suspicious timing, geopolitical commentator and Syria watcher Aaron Maté said, “Just as it helps Hezbollah bring desperately needed fuel into Lebanon, Syria suffers a sabotage attack that leads to complete blackout.”

“This is on top of the regular power shortages caused primarily by US sanctions & the 10-year dirty war,” Maté added. 

Tyler Durden
Sat, 09/18/2021 – 08:45

via ZeroHedge News https://ift.tt/3lGkuhj Tyler Durden