A recovery in Chinese independent refiners’ oil imports tops this week’s pick of trends in energy and raw materials markets. EU carbon markets, the relationship between US rig counts and tubular steel prices, and LNG supply to Europe are also on the agenda.
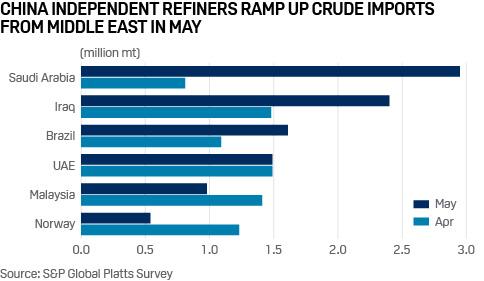
1. Saudi crude supply to Chinese independent refiners soars in May
What’s happening? China’s independent refiners ratcheted up crude imports in May by 71.1% on the year to a record high 4.42 million b/d, sending a bullish signal to the global oil market that the recovery in Chinese energy demand is on track. The independent refining sector’s crude imports from Saudi Arabia, Iraq, Oman and UAE increased 62.5% on the month to 7.78 million mt in May, accounting for about 41.6% of the total arrivals for those independent refineries, a monthly survey by S&P Global Platts showed June 3. Supply from Saudi Arabia jumped more than threefold from April to 2.95 million mt.
What’s next? Major Middle Eastern crude producers and Russia would draw support from the latest Chinese import data, as rapid energy demand recovery in the country would provide incentives for the major crude suppliers to reconsider production cuts in Q3. OPEC and its allies agreed on June 6 to extend the coalition’s 9.6 million b/d output cut agreement through July. The cuts – originally 9.7 million b/d including Mexico – had been scheduled to taper to 7.7 million b/d in July through the rest of the year. The independent sector’s bullish Middle Eastern crude import figures, coupled with recent sharp recovery in Dubai crude benchmark price structure may also prove effective in raising official selling prices (OSPs) for Middle Eastern crude grades flowing to Asia, industry officials and market participants said.
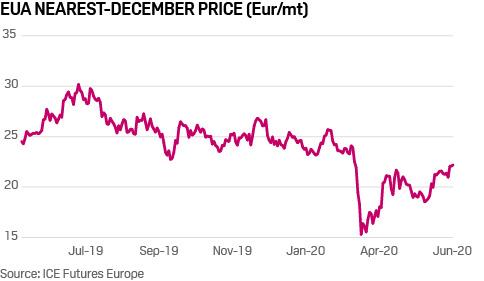
2. EU carbon market eyes evolving policy as price rebounds
What’s happening? EU carbon dioxide allowance prices have rebounded above Eur20.00/mt from their March lows of below Eur15.00/mt – seemingly defying a very bearish demand picture. A severe slump in demand due to the coronavirus lockdowns in Europe has combined with an already cheap natural gas picture. This means industrial sector demand for allowances is extremely low at the same time that cleaner gas-fired electricity plants continue to keep more emissions-intensive coal off the power grids in Europe, curbing utility hedging demand. However, the relative resilience of carbon prices is partly linked to the supply side: carbon market reforms are coming, and market participants are aware that EU regulators want to agree tougher 2030 emissions targets as well as tapping the carbon market to help deliver a low carbon economy by 2050.
What’s next? While analysts and traders say a drop back below Eur20/mt cannot be ruled out in the short-term – even as low as Eur15/mt – any significant price dips are likely to continue to attract buy-side support, given market reforms that could tighten supply in future. Policy levers include steepening the decline in the annual carbon cap from 2021-2030 and revising the quantitative rules governing the Market Stability Reserve, which starting cutting the overall supply of allowances in January 2019. This process is expected to kick off after the summer, with the EC set to ramp up the 2030 emissions goal beyond the current 40% cut below 1990 levels to at least 50%.
3. US tubular steel prices slump amid falling oil and gas rig count
What’s happening? The US oil and gas rig count fell by 22 in the week ended June 3, according to Enverus, and has fallen by 527, or 63%, since March 4. Since falling by $100/st from the start of March, US oil country tubular goods (OCTG) prices remained flat at the start of June, as recent supply cuts were at least partially offsetting the demand loss. The monthly S&P Global Platts domestic OCTG assessment remained flat June 1 at a midpoint of $800/st for June.
What’s next? The rapid recovery in crude prices in recent weeks to above the $30/b level has prompted some producers to scale back curtailment plans, suggesting the bottom may be in sight for rig count declines, which would help to support US OCTG pricing.
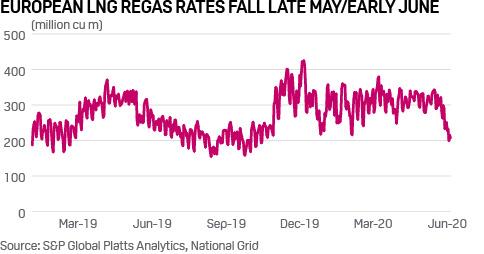
4. Lower LNG deliveries to Europe could support hub prices
What’s happening? LNG regasification in Europe has begun to fall sharply from sustained highs over much of 2020, with regasification rates having dropped by 30% since the start of June compared to the May average. LNG regasification rates have been strong all year despite the low price environment, as there was little sign previously of supply cuts from market participants and Europe remained the destination of choice for LNG produced in the Atlantic Basin.
What’s next? European hub prices have been at a solid discount to prices in both Asia and North America in recent weeks, and with dozens of US LNG cargoes having been cancelled recently, shipping rates have eased lower, reducing the cost of moving the commodity over longer distances. If the trend for lower LNG supply to Europe persists over the summer, it could help lift European gas prices from their recent record lows.
via ZeroHedge News https://ift.tt/2UotKtn Tyler Durden
“What The Heck Is Going On”, Citi Asks As Euphoria Hits Dot Com High Tyler Durden
Mon, 06/08/2020 – 12:44
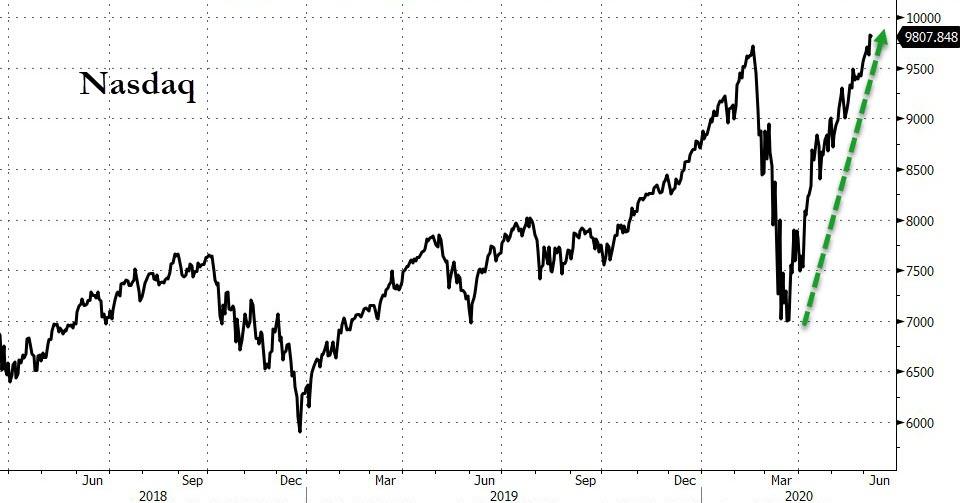
Less than three months after markets were gripped by a historic bout of panic, dumping everything – bonds, stocks, gold, bitcoin – in a liquidation frenzy, euphoria on Wall Street is back to levels not seen since the dot com bubble according to Citi’s panic/euphoria model, prompting the bank’s top strategist Tobias Levkovich to warn that bullish investor positioning, which as we noted over the weekend now also includes hedge funds in addition to retail traders, may be overly extended and investors may not be factoring all the potential risks, according to Bloomberg.
A puzzled Levkovich then writes, in a note titled “What The Heck Is Going On”, that “the market’s plunge and rebound in such a short period of time has left many investors scratching their heads in confusion. Those who held on to their equity
assets have ridden the stock market roller coaster and are almost back where they started, while those who sold are feeling upset and the ones who bought in the eye of the storm are richer.”
All this is taking place even as Citi writes that the its model still shows that a “more than 70% probability of a down market in the next 12 months remains”, which in turn prompts the Citi strategist to explain that just like the payrolls report, the bank’s panic/euphoria model “may have been distorted” as soaring trading volume numbers “have been a significant factor in the more jumpy readings/revisions of our sentiment metric.”
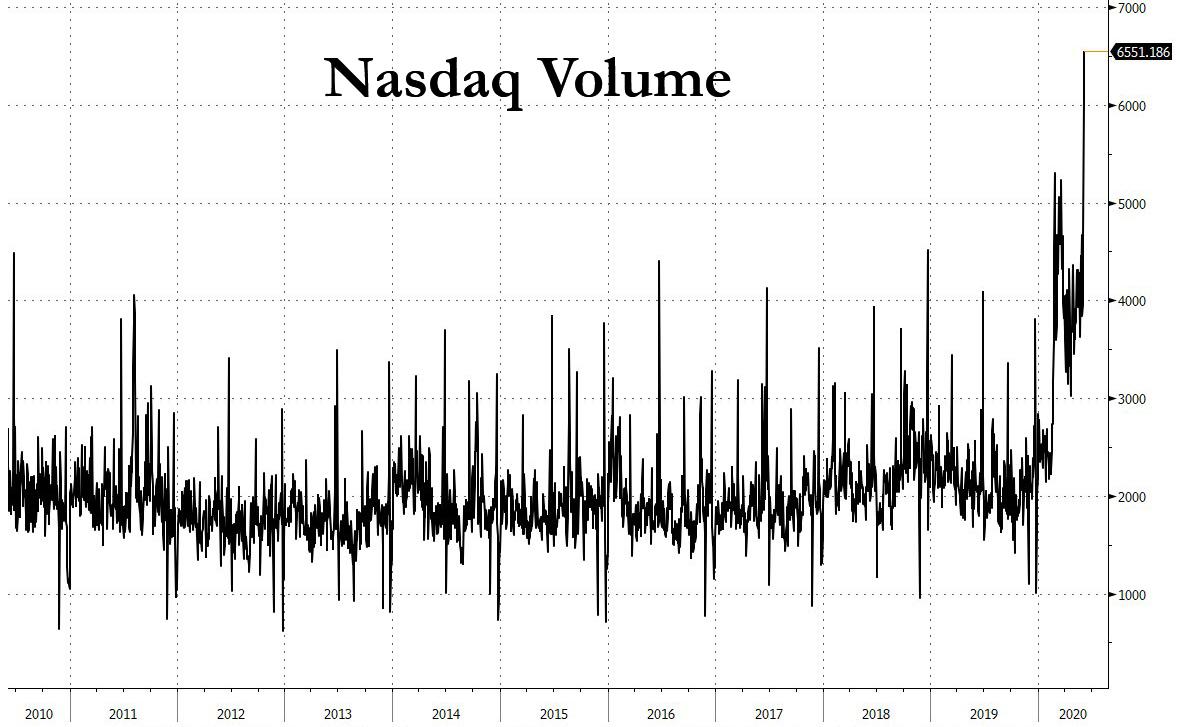
Yet there is no denying the relentless euphoria which on Friday manifested itself in the highest Nasdaq volume in history…
… even though Levkovich refuses to get fully on board, wiring that he is worried about the “for several reasons including our oft-stated C&I lending standards data which leads industrial activity and thereby earnings by nine months and we think EPS will have to be incredibly impressive by 1H 21 to support a 3,200 S&P 500 level.”
The strategist then highlights ridiculous forward valuations, pointing out that forecasts are roughly $130 at the moment for 2020 and are projected to jump to just north of $160 which would be near 2019 profits. Yet, with the forward P/E now at 20x those hoped-for numbers, he warns that “valuation leaves little to chance” as quoted by the Globe and Mail.
Finally, all this assumes corporate tax rates do not move higher – something Goldman warned over the weekend would happen should Biden defeat Trump and the Dems sweep Congress, “not to mention easy sailing on Covid-19 containment plus vaccines that are ready to go and inoculate tens of millions of people rapidly; which seems difficult given how poorly testing has gone.”
But, as the resigned strategist concludes, none of this matters as “some have argued that substantial Fed induced liquidity has made traditional fundamental analysis moot” and “the market is not really focused on the next few months, in our opinion.”
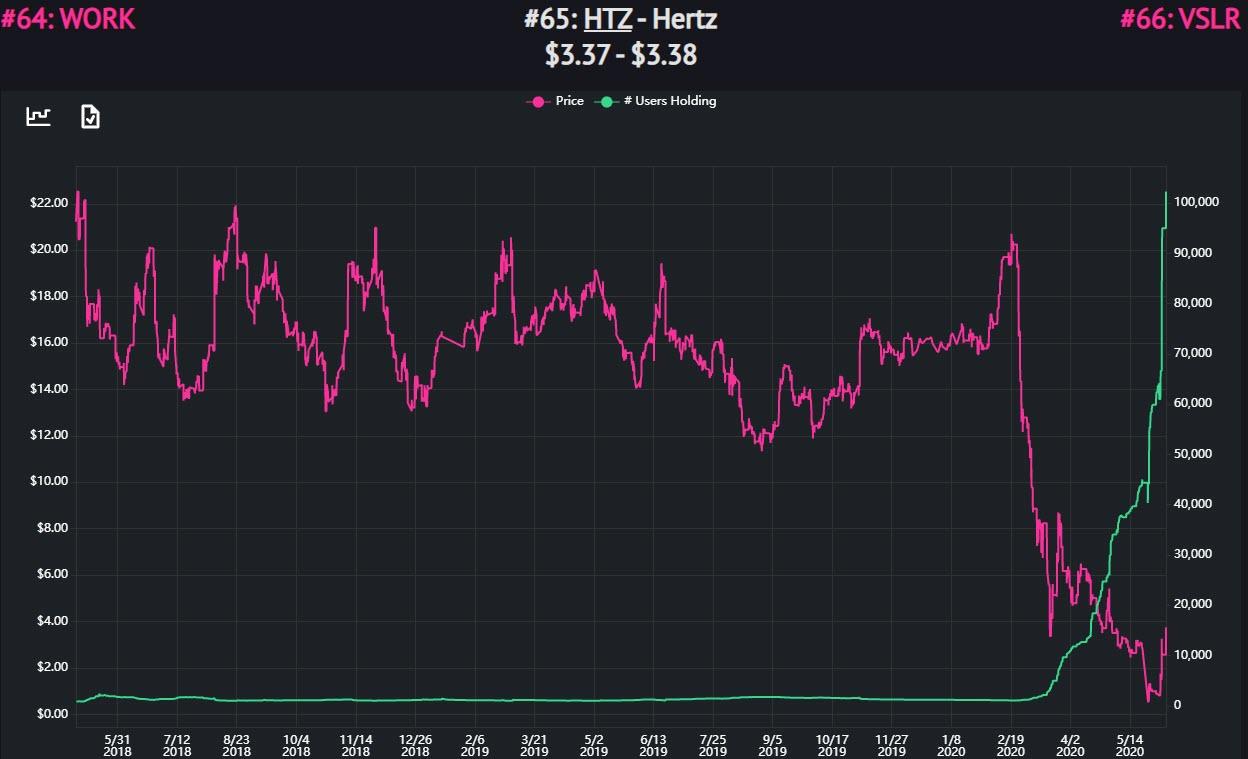
Said otherwise, nothing matters so just buy everything, as the army of Robin Hood investors is doing with bankrupt Hertz today.
via ZeroHedge News https://ift.tt/30n4V58 Tyler Durden
After the killing of George Floyd by a Minneapolis police officer, America is finally embracing police reform. As is so often the case in matters of personal freedom, libertarians were here long before mainstream political counterparts and fought a frequently lonely battle against abusive government power. Now, just as they did with same-sex relationships, drug reform, and the ongoing battle against the surveillance state, people across the political spectrum seem ready to concede that a little more freedom could be a good thing. If the effort succeeds, we may not get the credit—newly converted reformers are already trying to separate the cause from its long-time promoters —but at least we’ll live in a better world.
“Where are the libertarians?” is such a knee-jerk cry after incidents of police brutality that it’s safe to assume that it’s a matter of bad faith rather than of ignorance. Having left the issue on the back burner for so long, some people don’t want to admit that we were there ahead of them. Unfortunately, when it comes to police misconduct, we’ve been way ahead of them.
“Of the three political alternatives, a free economy, a mixed economy, a totalitarian state, only one provides the economic, political, and cultural context in which systematic police brutality cannot be a problem: a free society,” wroteReason founder Lanny Friedlander in a very ’60s-ish 1969 essay. “The police of a free society, engaging in retaliatory force only, enforcing laws of a defensive nature only, would be bound by the same laws they enforced, and would stand fully accountable for their actions.”
Going beyond window-dressing, libertarians favor minimizing opportunities for police to act against the public and making any interactions as non-confrontational as possible.
In 1971, the fledgling Libertarian Party (L.P.) called for “the repeal of all ‘crimes without victims’ now incorporated in federal and state laws,” such as the prohibitions on drug use that have driven so much of the escalation in aggressive police tactics. The same platform declared itself opposed to “so-called ‘no-knock laws'” of the sort that got Breonna Taylor killed by cops this year when they crashed through her door at night, unannounced, looking for illegal drugs.
In cases of police misconduct, libertarians favor holding government agencies and their employees accountable for their actions.
“We support full restitution for all loss suffered by persons arrested, indicted, tried, imprisoned, or otherwise injured in the course of criminal proceedings against them which do not result in their conviction,” the L.P. proposed in 1976. “Law enforcement agencies should be liable for this restitution unless malfeasance of the officials involved is proven, in which case they should be personally liable.”
That police agencies too often foster abusive conduct was no secret to libertarians long before the Minneapolis Police Department failed to implement reforms that might have saved George Floyd’s life.
“When a rookie Houston patrolman named Alan Nichols did the unthinkable and reported three fellow officers for the vicious beating of a black prisoner, police internal-affairs investigators tried to have him fired, the chief publicly reprimanded him, and other police ostracized him,” Glenn Garvin wrote in Inquiry, a Cato Institute publication, in 1979 coverage of violent and racially charged policing in Texas.
“Civil libertarians need to recognize that federal prosecution of law-enforcement officers who use excessive force often provides the only check on such unrestrained state power,” Dirk G. Roggeveen urged in the pages of Reason as Americans reacted to the 1991 police beating of Rodney King.
Through these years, police not only misbehaved but also came to act like an occupying army lording it over a hostile populace.
Seattle’s “police force has spied on local political activists for more than 20 years,” Roxanne Park warned in Inquiry in 1978. “The intelligence abuses discovered in Seattle are ‘typical examples’ of the practices of urban police departments.”
“Over the last 25 years, America has seen a disturbing militarization of its civilian law enforcement, along with a dramatic and unsettling rise in the use of paramilitary police units (most commonly called Special Weapons and Tactics, or SWAT) for routine police work,” Radley Balko cautioned for the Cato Institute in 2006. He expanded his argument in his 2013 book, Rise of the Warrior Cop.
Now, after decades of manifestos, journalism, research, and advocacy, America seems to agree with libertarians. “Americans by a 2-to-1 margin are more troubled by the actions of police in the killing of George Floyd than by violence at some protests,” the Wall Street Journalreports from survey results. That just may result in policy changes.
Michigan Rep. Justin Amash, the only Libertarian in Congress, literally wrote the bill that would eliminate qualified immunity, the legal doctrine that makes it so difficult to hold police accountable for their bad behavior unless courts in the same jurisdiction have already ruled that such conduct is wrong.
If Congress doesn’t rise to the occasion, the Supreme Court could. Associate Justices Clarence Thomas and Sonia Sotomayor both look eager to revisit the mess the court created when it invented qualified immunity.
No-knock raids, which so often end in tragedy when police kick-in the wrong door, or when suddenly awakened residents try to defend against intruders, are also getting a second look. Louisville, Kentucky is considering banning such warrants, a half-century after the Libertarian Party proposed exactly that.
City council members in Minneapolis are even talking about disbanding the police department amidst a national, though ill-defined, movement to “defund police.” Whether or not that’s an improvement depends on what comes next. Retaining harsh enforcement by another name will continue the abuses, the intrusiveness, and the disproportionate use of state violence against disfavored communities under nothing more than different branding.
Maybe that’s why it’s taken so long for people to seriously consider police reform, and why they’re so resistant to giving libertarians credit on the issue. Real change requires not just dropping the word “police” but reducing the opportunity for government agents to use violence against the public. That means fewer laws to be enforced and less intrusive enforcement of those laws. That’s a hard pill to swallow for ideologues who are committed to forcing people to do what they don’t want to do, or to forcibly stopping them from exercising their own preferences.
Libertarians should be happy that Americans are ready to discuss police reform. But we’ll have to see if the country is actually prepared for less policing.
from Latest – Reason.com https://ift.tt/3dNnrHq
via IFTTT
We covered a lot of issues including why domestic freedom of movement has more in common with international migration than most people think, why the arguments I advance in Free to Move do not rely on any distinctively libertarian premises, and how the framework for addressing potential downsides of migration that I outline in the book might apply to the coronavirus pandemic.
I am grateful to Jack for this opportunity, and for his thoughtful questions. Part II of the interview will be posted tomorrow.
In the meantime, I am pleased to announce that the audio version of Free to Moveis now available for pre-ordering (delivery by June 23). Many readers have asked about this, and Oxford University Press has responded to popular demand by making the audio version available faster than I previously expected. As with the e-book and hard copy editions, 50% of any royalties generated by the audio version will be donated to to charities supporting refugees.
from Latest – Reason.com https://ift.tt/3f0qc8D
via IFTTT
There are undoubtedly countless people right now who can hardly believe what they’ve been seeing over the past few months.
Global pandemic, total economic shutdown, tens of millions of jobs lost, trillions of dollars of debt and money printing, and now, social unrest, including riots and looting, brought on by yet another harrowing murder at the hands of the police.
A poll conducted by NBC News and the Wall Street Journal last week showed 80% of respondents believe the United States is spiralling out of control.
And it all happened so quickly.
We’ve been writing for years at Sovereign Man about the need to have a Plan B, consistently pointing out that this is a completely normal, rational thing to do.
A great Plan B is like an insurance policy. You hope you’ll never need to use it, but if you ever do, you’ll be really glad that you have one.
Having a Plan B is not capitulating. It’s not running away.
It’s sensible. It ensures that, no matter what happens or doesn’t happen next, you’ll be in a position of strength, regardless of what you choose to do.
If you want to march in the streets or dedicate yourself to social change, you’ll be better off with a Plan B. If you’re concerned about the policy impacts of mob rule, you’ll be better off with a Plan B.
Frankly what we’ve seen so far is potentially just a taste of what’s coming.
Just imagine how swiftly and viciously governments could react if another major outbreak of COVID-19 takes place.
Just imagine how much rage will explode in the streets depending on who wins the Presidential election in November.
And then there are other risks– like the looming Cold War with China, spiralling deficits, etc., and we haven’t even begun to see the effects of those yet.
One key component of a Plan B is to consider– is there at least a possibility that you might ever need to leave?
Would greater social unrest, economic upheaval, World War III, etc. prompt you to want to get out of Dodge? If so, you’ll want to have thought about that well before you start packing your bags.
This means you’ll always have another option to live, work, invest, retire… and potentially even pass down those rights to future generations.
A Plan B also takes your finances into consideration.
Will the trillions and trillions of dollars that the Federal Reserve is pumping out cause serious damage to the dollar? Will Cold War with China compel the world to abandon the dollar as a reserve currency?
These are certainly possibilities. And that’s why gold and other real assets are also worth considering as part of a Plan B.
There are so many other considerations– tax planning, estate planning, family planning, asset protection… even things like homesteading or home schooling.
No two Plan Bs are the same. But the core ethos is that a Plan B makes sense, no matter what happens (or doesn’t happen) next.
There’s no downside, for example, in good tax planning that can save you money. There’s no downside in having a second passport that can provide generational benefits to your future descendants. There’s no downside in making it more difficult for people to file frivolous lawsuits against you.
Having a Plan B is like taking care of your health… it just makes sense. There’s no downside.
We covered a lot of issues including why domestic freedom of movement has more in common with international migration than most people think, why the arguments I advance in Free to Move do not rely on any distinctively libertarian premises, and how the framework for addressing potential downsides of migration that I outline in the book might apply to the coronavirus pandemic.
I am grateful to Jack for this opportunity, and for his thoughtful questions. Part II of the interview will be posted tomorrow.
In the meantime, I am pleased to announce that the audio version of the book is now available for pre-ordering (delivery by June 23). Many readers have asked about this, and Oxford University Press has responded to popular demand by making the audio version available faster than I previously expected. As with the e-book and hard copy editions, 50% of any royalties generated by the audio version will be donated to to charities supporting refugees.
from Latest – Reason.com https://ift.tt/3f0qc8D
via IFTTT
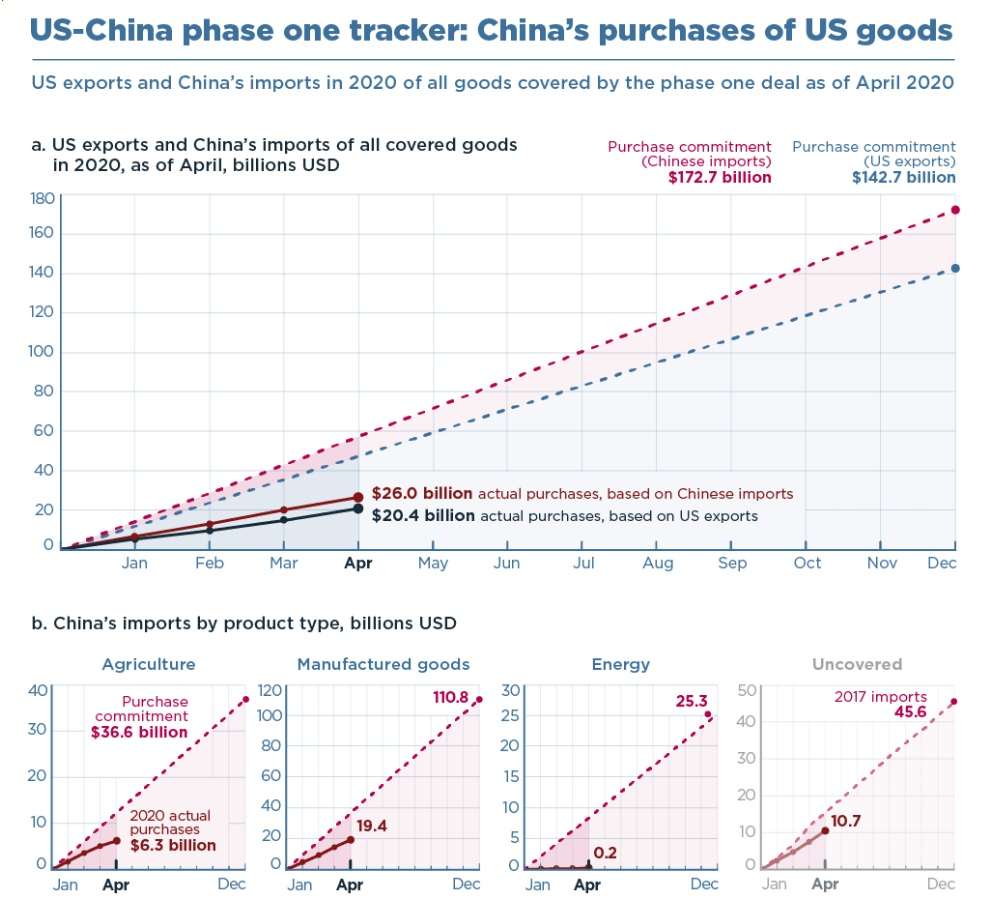
When the United States and China called a truce in their trade war late last year, arguably the most important part of the deal was China’s promise to increase imports of American goods by $200 billion by the end of 2021.
Don’t get me wrong: There were other important details too. The United States agreed to forgo another planned tariff increase that would have hiked prices for many consumer goods, and both sides agreed to a framework for resolving long-standing disagreements over intellectual property. But for President Donald Trump, who has complained for years about America’s trade deficit with China, the promise that China would import more American goods was clearly the key element of the bargain—as evidenced by the fact that he keeps talking about it.
Through the first four months of 2020, China has imported only about 45 percent of what it would have had to buy to be on pace to meet the deal’s goals, according to an analysis of trade data from both countries by the Peterson Institute for International Economics (PIIE). The so-called “phase one” deal between the two countries broke down the overall $200 billion promise into smaller, specific targets for agricultural goods, energy, and manufacturing outputs. So far, China does not appear to be close to hitting any of those goals:
Chad Bown, a senior fellow at PIIE, notes that the deal only stipulates that China must hit the year-end targets this year and next year. Still, the prorated totals for the first third of the year serve an illustrative purpose.
The COVID-19 pandemic is a factor. It has disrupted manufacturing and trade on both sides of the Pacific. But the bigger problem seems to be that the Chinese import targets were never all that realistic to start. As The Wall Street Journalnoted shortly after the deal was made public, Trump was effectively asking for “an unprecedented jump in bilateral trade.” To meet its obligations, China would have to hike its purchases of U.S. goods by 60 percent over the 2017 (pre–trade war) baseline.
That part of the agreement was “unrealistic at best” from the start, wrote Brookings Institution scholars Joshua Meltzer and Neena Shenai in February. Perhaps worse, the deal actually handed leverage to China for future negotiations. “Because these purchases are not market-based (if they were, the commitments would have been unnecessary), they actually create stronger U.S. dependencies on China,” Meltzer and Shenai wrote. “Because of its state-led and controlled economy, China could gin up demand to try and meet these commitments, but the spigot could likewise be turned off at any point and for any reason.”
Neither side seems to care much now about the trade deal or the fact that China is unlikely to meet its obligations. This week, the Chinese government asked state-owned companies to stop buying American pork and soybeans in response to the United States threatening retaliation for China’s crackdown on Hong Kong. If that happens, China’s already-low purchases of U.S. agricultural goods are likely to fall further.
Meanwhile, Trump said last month that he has no interest in revisiting the trade agreement. “Somehow, I lost a little flavor for it,” he told reporters on May 15, though he also told Fox Business he was “very disappointed in China” for failing to meet its obligations so far. While Trump’s top economic advisers continue to defend the deal, the president’s limited attention span seems to be focused elsewhere.
It now seems like the trade deal was always more of a political prop than anything else—a way for Trump to tout the supposed success of his trade war as he ran for re-election, while postponing any additional tariff increases until at least 2021. Shortly after the “big, beautiful” deal was signed in January, for example, he told farmers at a rally in Ohio they’d have to “buy bigger tractors” in order to meet the new demand from China.
But farmers, who have already borne the brunt of the Trump administration’s costly trade policies, are likely to get shortchanged again. The Trump administration is reportedly preparing another round of federal bailouts for farmers hurt by the trade war—a far cry from the promise that a deal with China would motivate farmers to buy bigger tractors.
Now that the Republican Party has decided its 2020 campaign strategy will be focused on anti-China hawkery, last year’s limited trade agreement probably matters less than it ever did. The only concrete accomplishment of Trump’s economically destructive trade war is looking like a dud.
from Latest – Reason.com https://ift.tt/2UnlxFW
via IFTTT
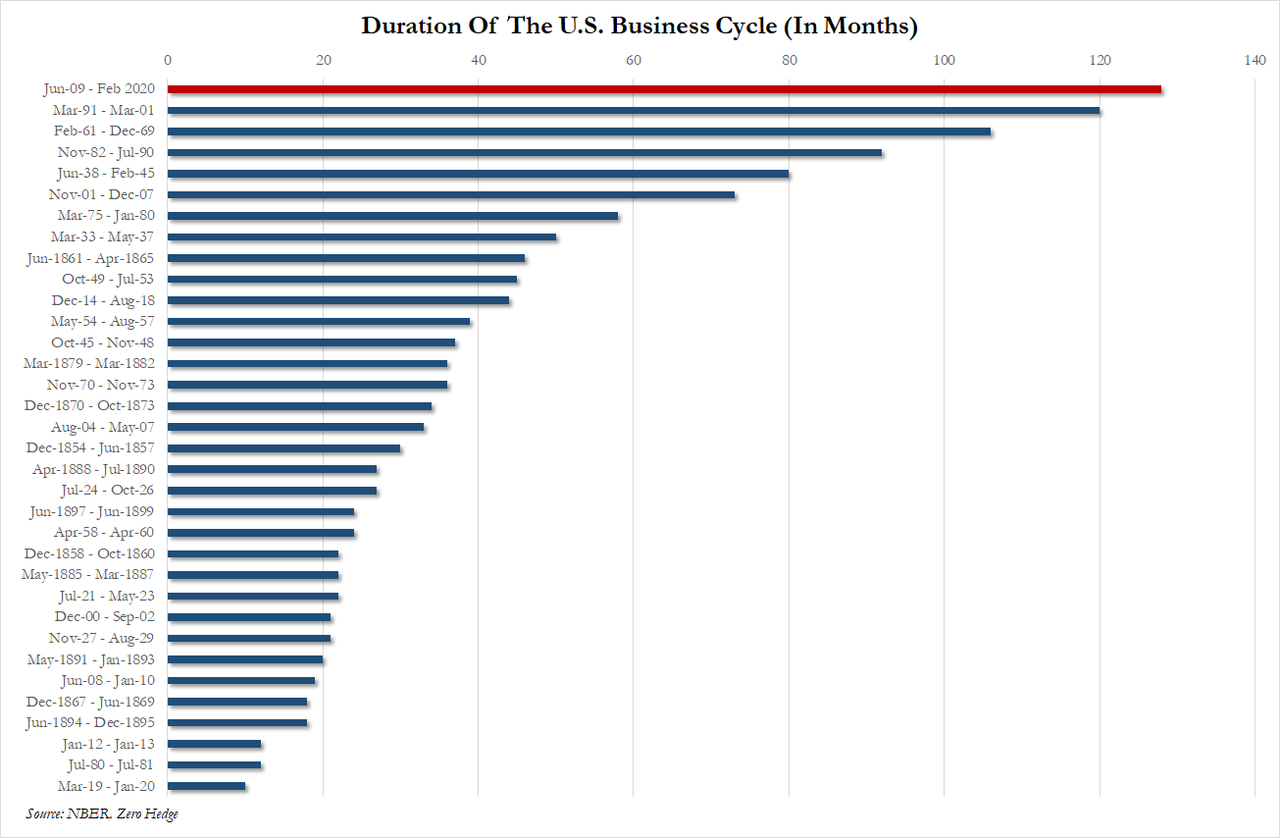
The Longest Expansion In History Is Officially Over: The US Entered Recession In February, NBER Finds Tyler Durden
Mon, 06/08/2020 – 12:24
While it should hardly come as a surprise to anyone who can fog a mirror, The Business Cycle Dating Committee of the National Bureau of Economic Research – the official arbiter of whether America is in recession or not – has issued a statement confirming that February 2020 marks the end of the expansion that began in June 2009 and the beginning of a recession. .
This was the longest period of economic expansion in US history at 128 months…
The Business Cycle Dating Committee of the National Bureau of Economic Research maintains a chronology of the peaks and troughs of U.S. business cycles. The committee has determined that a peak in monthly economic activity occurred in the U.S. economy in February 2020. The peak marks the end of the expansion that began in June 2009 and the beginning of a recession. The expansion lasted 128 months, the longest in the history of U.S. business cycles dating back to 1854. The previous record was held by the business expansion that lasted for 120 months from March 1991 to March 2001.
The committee also determined that a peak in quarterly economic activity occurred in 2019Q4. Note that the monthly peak (February 2020) occurred in a different quarter (2020Q1) than the quarterly peak. The committee determined these peak dates in accord with its long-standing policy of identifying the months and quarters of peak activity separately, without requiring that the monthly peak lie in the same quarter as the quarterly peak. Further comments on the difference between the quarterly and monthly dates are provided below.
A recession is a significant decline in economic activity spread across the economy, normally visible in production, employment, and other indicators. A recession begins when the economy reaches a peak of economic activity and ends when the economy reaches its trough. Between trough and peak, the economy is in an expansion.
Because a recession is a broad contraction of the economy, not confined to one sector, the committee emphasizes economy-wide indicators of economic activity. The committee believes that domestic production and employment are the primary conceptual measures of economic activity.
The Month of the Peak
In determining the date of the monthly peak, the committee considers a number of indicators of employment and production. The committee normally views the payroll employment measure, which is based on a large survey of employers, as the most reliable comprehensive estimate of employment.
This series reached a clear peak in February. The committee recognized that this survey was affected by special circumstances associated with the pandemic of early 2020. In the survey, individuals who are paid but not at work are counted as employed, even though they are not in fact working or producing. Workers on paid furlough, who became more numerous during the pandemic, thus resulted in an overcount of people working in recent months. Accordingly, the committee also considered the employment measure from the Bureau of Labor Statistics household survey, which excludes individuals who are paid but on furlough. This series plateaued from December 2019 through February 2020, and then fell steeply from February to March. Because both series measure employment during the week or pay period containing the 12th of the month, they understate the collapse of employment during the second half of March, as indicated by unprecedented levels of new claims for unemployment insurance. The committee concluded that both employment series were thus consistent with a business cycle peak in February.
The committee believes that the two most reliable comprehensive estimates of aggregate production are the quarterly estimates of real Gross Domestic Product (GDP) and of real Gross Domestic Income (GDI), both produced by the Bureau of Economic Analysis (BEA). These measures estimate production that occurred over an entire quarter and are not available monthly. The most comprehensive monthly measure of aggregate expenditures, which includes roughly 70 percent of real GDP, is monthly real personal consumption expenditures (PCE), published by the BEA. This series reached a clear peak in February 2020. The most comprehensive monthly measure of aggregate real income is real personal income less transfers, from the BEA. The deduction of transfers is necessary because transfers are included in personal income but do not arise from production. This measure also reached a well-defined peak in February 2020.
The Quarter of the Peak
In dating the quarterly peak, the committee relies on real GDP and real GDI as published by the BEA, and on quarterly averages of key monthly indicators. Quarterly real GDP and real GDI peaked in 2019Q4.
The quarterly average of employment as measured by the payroll series rose from 2019Q4 to 2020Q1. However, the committee concluded that the special factor noted above implies that the series should not play a significant role in determining the quarterly peak. The quarterly average as measured by the household survey reached a clear peak in 2019Q4. The committee concluded that like GDP and GDI, the number of people working also reached its quarterly peak in 2019Q4.
The fact that the monthly peak of February occurred in the middle of 2020Q1 while the quarterly peak occurred in 2019Q4 reflects the unusual nature of this recession. The economy contracted so sharply in March (the final month of the quarter) that in 2020Q1, GDP, GDI, and employment were significantly below their levels of 2019Q4.
* * *
All of which makes perfect sense given stocks are at record highs…
via ZeroHedge News https://ift.tt/2BFd2zq Tyler Durden
Sizing The Commercial Real Estate Bust Tyler Durden
Mon, 06/08/2020 – 12:05
Submitted by Chris Whalen of The Institutional Risk Analyst
“You pass the Helmsley Palace, the shell of old New York transparently veiling the hideous erection of a real estate baron…”
Jay MacInerney
Bright Lights, Big City (1984)
So how big is the impending commercial real estate bust in the US? Bigger than the residential mortgage bust of the 2000s and also bigger than the commercial real estate wipeout of the 1990s, including the aftermath of the Texas oil boom of the late 1970s and 1980s.
Commercial real estate as a mortgage asset class is half the size of the $11.5 trillion market for residential homes, but the losses this cycle could be far larger per dollar of assets. That’s big. Both markets are fundamentally affected by interest rates above all.
The US has not experienced a really nasty deflation in commercial real estate prices since the 1990s and, before that, the bust in the Texas oil patch in the late-1970s. Abby Livingston told the story of Houston during the oil bust in The Texas Tribune last month (“All of the party was over”: How the last oil bust changed Texas”):
“Real estate soon emerged as the most noteworthy outlet for Texas money. With growth in commerce and in population, it seemed quite logical at the time to invest big in new housing developments, soaring skyscrapers in Dallas and Houston, shopping centers, and vacation condominiums on South Padre Island.”
Last week, the Financial Times reported that Chesapeake Energy Corporation, the pioneer of shale oil created by Aubrey McClendon, is on the brink of bankruptcy. This not only signals the end of the US oil boom, but another surge in real estate speculation in the areas affected. From the New York border southwest along the Appalachian Mountains to Texas and as far west as California, shale exploration and production financed a period of giddy real estate investment that is now suddenly ended.
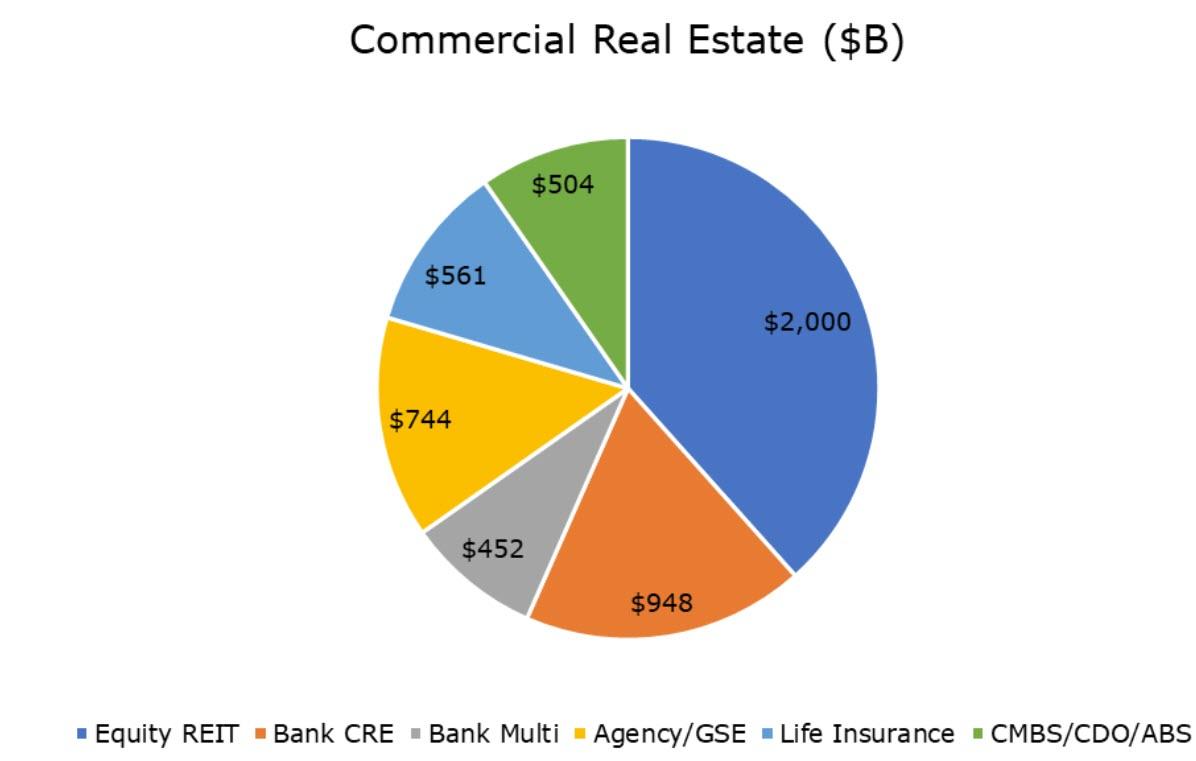
Equity REITs own more than $2 trillion of physical real estate assets in the U.S. including more than 200,000 properties in all 50 states and the District of Columbia, NAREIT reports. The equity REITs, as the name suggests, are generally funded with equity rather than debt, but individual assets are routinely encumbered with mortgages to increase returns.
The latest Mortgage Bankers Association survey shows that commercial banks continue to hold the largest share (39 percent) of commercial/multifamily mortgages at $1.4 trillion. Agency and GSE portfolios and MBS are the second largest holders of commercial/multifamily mortgages, at $744 billion (20 percent of the total). Life insurance companies hold $561 billion (15 percent), and CMBS, CDO and other ABS issues hold $504 billion (14 percent). The chart below shows the equity REITs and the various classes of commercial mortgage lenders and investors.
Source: NAREIT, MBA, FDIC
This particular bust in commercial property is very different from the 1990s, but in common with that era also includes a large energy component. The difference is that, due to COVID19 and the more recent looting in major cities, the valuation of once solid urban commercial and residential properties held by equity REITs is now very in much question.
The fact of the COVID19 lockdown, the riots and looting following the killing of George Floyd by the Minneapolis Police, and the coincident rise of telecommuting, which keeps people away from the large metros, raises questions about the entire economic structure of cities. So long as social distancing is required or even the preferred option, many of the institutions and structures within the big cities no longer function.
Connor Dougherty and Peter Eavis reported in The New York Times on Friday:
“Faced with plunging sales that have already led to tens of millions of layoffs, companies are trying to renegotiate their office and retail leases — and in some cases refusing to pay — in hopes of lowering their overhead and surviving the worst economic downturn since the Great Depression. This has given rise to fierce negotiations with building owners, who are trying to hold the line on rents for fear that rising vacancies and falling revenues could threaten their own survival.”
And the operative term is survival. Add the Shale oil bust to the already precarious state of the commercial real estate market in major metros and the image becomes truly catastrophic. In 1981, oil peaked at $31.77 per barrel, at the time an unheard-of valuation for black gold. The FDIC tells the tale in their excellent History of the Eighties:
“The bottom hit in 1986. Oil was priced at $12.51, still high compared with 15 years before. But historical context was no help to oil producers who plunged deep into debt buying up rigs amid the frenzy to meet anticipated demand. The economic angel of death for oilmen came in the form of bankers calling in loans.”
The 1980s were a tough time in Texas as politicians and business leaders were forced to liquidate business and their personal possessions to pay debts. Much like the shale oil industry today, the domestic oil industry was forced to adjust to changes in oil prices that made these assets uneconomic. But the wider speculative bubble in commercial real estate reached all around the nation. The FDIC continues:
“When the bust did arrive in the late 1980s and continued into the early 1990s, the banking industry recorded heavy losses, many banks failed, and the bank insurance fund suffered accordingly. Compounding the magnitude of these losses was the fact that many banking organizations active in real estate lending had weakened their underwriting standards on commercial loan contracts during the 1980s.”
Sound familiar?
Source: FDIC
The troubles in the oil patch were only part of the economic disaster of the 1980s and early 1990s. The collapse of the residential mortgage market and the S&L industry put home prices into a deep freeze for much of a decade. But the 1980s were also a very difficult time for commercial real estate and a number of major US cities, which had been abandoned by affluent households fleeing the violence and chaos of the inner cities.
After a catastrophic fiscal crisis in New York during the 1970s, followed by the famous blackout and rampant acts of arson, the cities saw mass abandonment of commercial properties, leaving many inner cities derelict. The famous 1977 New York City blackout and subsequent riots destroyed parts of the city and saw public services cut to the bone.
Whereas the nadir of the riots and burning of 1977 in New York marked a starting point for the rebirth of the city decades later, today New York City stands on the edge of the abyss.
What is similar to the 1990s and before was the role of the Federal Open Market Committee in encouraging the financial excesses in commercial lending as part of a broader policy of asset reflation. In the 1970s and 1980s, banks piled into a new asset class known as real estate is a desperate effort to offset losses on loans to Third World nations.
Then Fed Chairman Paul Volcker refused to allow US banks to write down bad loans to Argentina and other debtor nations until he left office in 1989, but the workout of bad commercial loans continued for years to come. The Fed’s aggressive reflation strategy in the 1980s worked, only too well, causing the banks to inflate a vast bubble in commercial real estate that deflated through the 1990s.
Since 2008, low or zero interest rates have again caused an even bigger bubble in commercial real estate assets, a gold rush that drove net loss rates negative as loan-to-value ratios plummeted. Now with asset prices in a free fall, LTVs are rising and we expect to see net loss rates on commercial exposures solidly in the red this quarter. Get used to it.
Source: FDIC/WGA LLC
The Scope of the Damage
The state of the equity REITs casts a pall over the rest of the $5.2 trillion commercial mortgage segment. Once seen as top commercial credits, these equity REITs now face an enormous change in how businesses and consumers view urban commercial office and multifamily residential assets. As usage falls, so too do valuations and tax revenues for the localities.
Projects that a year ago might have made sense as long-term bets on the future of cities like New York have no economic rationale today. And the loans and mortgage bonds that support these buildings no longer make any financial sense. Ponder all of the commercial buildings in New York and other major metros that depend upon tourism, hospitality and entertainment for their economic life. Without these features, there is no reason to be in these metro areas.
The cardinal rule of landlords is that the most important thing is to be aware of your tenants, their needs and their financial situation. When your tenants just get up and leave, however, defaulting on leases and filing bankruptcy, the economic model for rental buildings and condominiums falls apart.
Part of the difficulty of estimating loss rates for commercial properties is that every property is different, every loan is different, sometimes in very significant ways. Whereas you can generalize about residential assets at the portfolio level, with commercial loans the analysis is asset-by-asset, loan-by-loan.
Commercial real estate brokerage CBRE says hopefully that “The real estate recovery will lag the economic recovery, with multifamily and industrial recovering first, followed by office and retail.” But the reality at the loan levels suggests otherwise.
Consider an example: “WFCM 2013-LC12” or the Wells Fargo Commercial Mortgage Trust, a CMBS issued in 2013 with a combination of hotel and retail use commercial properties. Back in 2017, Fitch Ratings noted that the deal “has exhibited relatively stable performance since issuance” and reaffirmed the ratings. But things change.
“As of the May 2020 remittance period, there are two REO assets (1.3%) and one loan in foreclosure (0.4%). In addition, there are 16 loans (24.9%) that appear on the master servicer’s watchlist, including four loans (2.1%) that are 30 days delinquent. The REO assets, the loan in foreclosure, 10 watchlist loans (11.6%), and three other loans (13.6%) have been identified as KBRA Loans of Concern (K-LOCs). K-LOCs consist of specially serviced and REO assets as well as non-specially serviced loans in default or at heightened risk of default in the near term.”
KBRA continues: “Excluding K-LOCs with losses, the transaction’s weighted average (WA) KBRA Loan-to-Value (KLTV) of 91.6% has increased from 87.7% at last review and decreased from 99.2% at securitization. The KBRA Debt Service Coverage (KDSC) of 1.67x has decreased from 1.76x at last review and 1.69x at securitization.”
So, the good loans, excluding the likely losses and doubtful assets, have an LTV over 90%. The equity in many of the remaining properties may already be gone depending upon the location and utilization levels. Bank owned CRE, by comparison, tend to have initial LTVs closer to 50, but those assets may also have seen significant erosion in the equity and thus an increase in effective LTV.
And by no coincidence, the prices for WFCM 2013-LC12 have suffered since the start of 2020. The most junior D tranche of this CMBS was trading in the mid-90s after the start of the year, but then suffered several downgrades and resultant drops in price.
Today the Ds trade below 70 or about 1,600bp over the curve. If you are lucky enough to hold the bonds, you get the idea. The As are flopping around below par or plus 180bp over the curve after touching 98 in mid-March.
So how big will the commercial real estate bust be in 2020-21 and beyond? In 1991, the FDIC reports, “the proportion of commercial real estate loans that were nonperforming or foreclosed stood at 8.2 percent, and in the following year net charge-offs for commercial real estate loans peaked at 2.1 percent.”
In 1991, the net charge off rate for all $1.6 trillion in bank owned real estate loans was less than 0.5% Multifamily mortgage loans peaked in Q4 of 1991 around 1.5% of net charge offs but remained elevated until 1996.
But this time is different. Based on our informal survey of REIT valuations and individual assets, we think that the world has been turned upside down for many investors. Actual LTVs for urban commercial and luxury residential assets in many metros are well-over 100 and are likely to be restructured, albeit over a period of years. As we noted last week, it’s all about buying time.
We think that net charge offs on commercial loans could rise to 2-3x the peaks of the 1990s, with loss rates at 100% percent or more in some cases, and remain elevated for years for come as the workout process proceeds.
Failing some miraculous economic rebound in the major metros, look for credit costs related to commercial real estate to climb for REITs, CMBS investors, the GSEs, and banks in that order of severity. Figure a 10% loss spread across $5 trillion in AUM over five years?
via ZeroHedge News https://ift.tt/3dJzxBF Tyler Durden


