Two months ago, the U.S. Centers for Disease Control and Prevention (CDC) published “best estimates” implying that less than 0.3 percent of Americans infected by the COVID-19 virus will die from the disease. This month the CDC published a revised best estimate that puts the infection fatality rate (IFR) at 0.65 percent, more than twice as high. Meanwhile, the results of the CDC’s seroprevalence studies in various parts of the country, which it first reported a month ago and updated this week, imply IFRs ranging from 0.1 percent in Utah to 1.4 percent in Connecticut.
The wide range of IFR estimates partly reflects uncertainty about exactly how deadly COVID-19 is. But it also reflects actual variations in how likely patients are to die in different places and at different times. Although people frequently talk about the infection fatality rate as if it were a single, constant number, it is bound to be affected by conditions, such as the patient mix and the quality and capacity of the local health care system, that vary from one place to another and that may change over time.
In May, the CDC’s best estimate, included in its “COVID-19 Pandemic Planning Scenarios,” was that 0.4 percent of Americans who develop symptoms of the disease will be killed by it. It also estimated that 35 percent of infections do not result in symptoms. Together, those estimates implied a national IFR of 0.26 percent. As critics noted, the CDC did not cite any sources for its numbers.
The new version of the planning scenarios includes a direct IFR estimate of 0.65 percent, based on preprint study that the Australian epidemiologists Gideon Meyerowitz-Katz and Lea Merone published on July 7. “Based on a systematic review and meta-analysis of published evidence on COVID-19 until May, 2020, the IFR of the disease across populations is 0.68%,” they reported. “However, due to very high heterogeneity in the meta-analysis, it is difficult to know if this represents the true point estimate. It is likely that, due to age and perhaps underlying comorbidities in the population, different places will experience different IFRs due to the disease.” They also cautioned that “given issues with mortality recording, it is also likely that this represents an underestimate of the true IFR figure.”
The CDC has clarified its estimate by citing the source on which it is based, which is surely an improvement. But at the same time, the CDC has switched from an estimate of the symptomatic case fatality rate for Americans to an estimate of the infection fatality rate derived from research conducted around the world (which it revised downward slightly for reasons that are not explained in the planning scenario). Because of the high geographic variability noted by Meyerowitz-Katz and Merone, it is questionable whether the new estimate provides a more accurate picture of what is happening in the United States.
The CDC’s seroprevalence studies seem more relevant to that question, although they have problems of their own. While virus testing in the United States has expanded dramatically since the early stage of the epidemic, it is still skewed toward people who have symptoms consistent with COVID-19 or who have reason to worry that they were exposed to the virus. The results of those tests are therefore a highly misleading indicator of virus prevalence, missing lots of people who have been infected but never sought testing because their symptoms were mild or nonexistent. According to the CDC’s latest best estimate, 40 percent of COVID-19 infections are asymptomatic.
The CDC’s antibody studies avoid the sampling bias of virus screening by using blood drawn from patients for routine tests unrelated to COVID-19. But it is still not clear that the patients included in the studies are representative of the local population, let alone the country as a whole. The CDC at one point was talking about conducting an antibody study with a random sample of the U.S. population, which would give us a clearer understanding of the national IFR, but I can no longer find any mention of that plan on the agency’s website.
With that caveat in mind, the CDC’s findings still reveal striking regional variations in both infection rates and implied IFRs.
The CDC estimates that nearly 7 percent of people in the New York City area had been infected as of April 1. That number had more than tripled by May 6, when the CDC estimates 23 percent of New Yorkers were infected. The estimated virus prevalence was almost 6 percent in Louisiana as of April 8 and about 5 percent in Connecticut as of May 3.
The CDC’s prevalence estimates, when you take into account the dates when samples were drawn, indicate that the virus made much less progress elsewhere in the country during the spring. The estimated rate was less than 4 percent in Philadelphia at the end of May, about 3 percent in South Florida as of April 24, less than 3 percent in Missouri on both April 26 and May 30, about 2 percent in western Washington state on May 11, about the same in Minnesota on June 7, a bit more than 2 percent in Utah on May 3, and just 1 percent in the San Francisco Bay Area on April 27.
The ratio of estimated total infections to known cases also varied widely. The CDC estimates that infections outnumbered confirmed cases by at least 24 to 1 in Missouri as of late April, while the ratio in Connecticut was more like 6 to 1 around the same time. During the first round of testing, the estimated ratio was 10 or more to 1 in seven of the 10 areas where samples were drawn. The wide range of ratios helps explain the wide range of implied infection fatality rates, since more undetected infections means a bigger denominator.
The current crude case fatality rate in the United States—reported deaths as a share of confirmed cases—is 3.6 percent. Assuming that 10 to 1 is a reasonable stab at the ratio of total infections to confirmed cases, the nationwide IFR would be less than 0.4 percent, substantially lower than the CDC’s latest estimate. But that ratio is a moving target, since expanded virus testing can reduce the gap between total infections and confirmed cases. That seems to be what happened in some of the locations studied by the CDC, since their ratios fell between the first and second rounds of antibody testing. Unreported COVID-19 deaths, the extent of which is also a matter of much controversy, complicate the picture further.
Still, a few observations seem reasonable based on what we know at this point.
First, COVID-19 patients do worse in some parts of the country than others, a fact that is apparent from the crude case fatality rates for various states as well as the IFRs implied by the CDC’s seroprevalence research. While Utah’s IFR (about 0.1 percent in early May, based on the CDC’s data) may rise as the epidemic progresses there, it is unlikely ever to approach the IFRs in Connecticut (1.4 percent around the same time) or New York City (0.6 percent or more, depending on whether “probable” cases are included, based on an antibody study conducted by the New York State Department of Health in April). Reasons why COVID-19 is especially deadly in some places may include age demographics, the prevalence of preexisting medical conditions, stress on local hospitals, and factors (such as population density and mass transit use) that not only promote virus transmission but may increase the typical viral load.
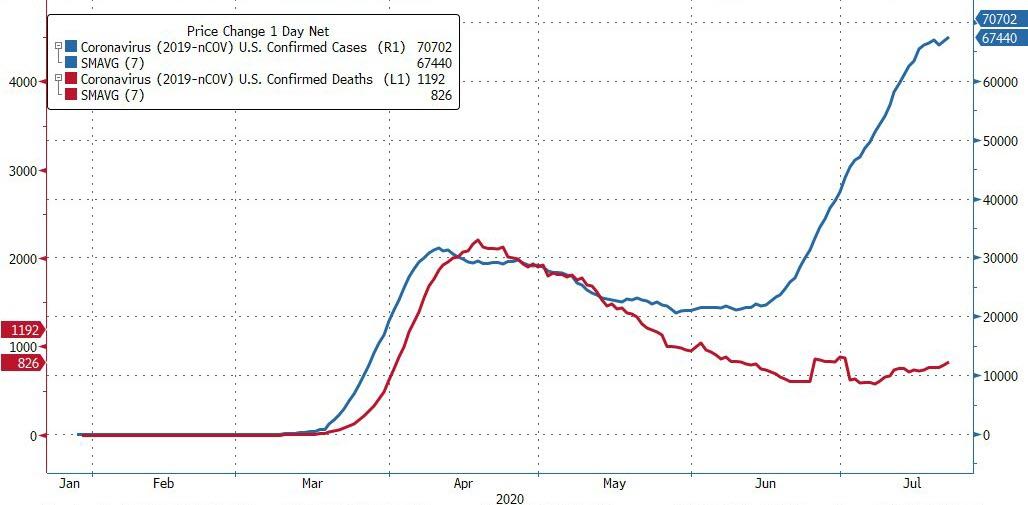
Second, the IFR can change over time in any given place. If the average age of people infected by the virus goes up, for instance, the IFR can be expected to rise, since older people face a much higher risk of death. Conversely, the IFR can be expected to decline when the average age of COVID-19 patients falls, as it has been in the Sunbelt states that are driving the recent surge in new infections. Other things being equal, the IFR also will fall as COVID-19 treatments improve, another factor that helps explain why those states have not seen increases in daily deaths commensurate with the rise in confirmed cases.
Third, COVID-19 is clearly deadlier than the seasonal flu, but it does not seem to be nearly as deadly as the “Spanish flu” of 1918, contrary to the worst-case scenarios that had a profound impact on policy makers early in the epidemic. Even the CDC’s revised IFR estimate is substantially lower than the rates assumed in some of those projections.
Taking into account recent increases in infections, independent data scientist Youyang Gu, who has a good track record of predicting COVID-19 trends, is now projecting that the U.S. death toll as of November 1 will be about 268,000. That is hardly a happy prospect, but it is a far cry from the 2.2 million deaths the Trump administration was imagining in March.
The argument about the extent to which COVID-19 lockdowns can be credited for the gap between such nightmares and reality will no doubt continue. But at this point, the ultimate death toll will depend largely on the precautions that Americans voluntarily take to protect themselves and their neighbors. Barring the unexpectedly early deployment of an effective vaccine, our fate is in our hands.

from Latest – Reason.com https://ift.tt/2OSeT7i
via IFTTT