“We Have Never Seen This Before”: The Last Time The Market Did This, FDR Confiscated All The Gold
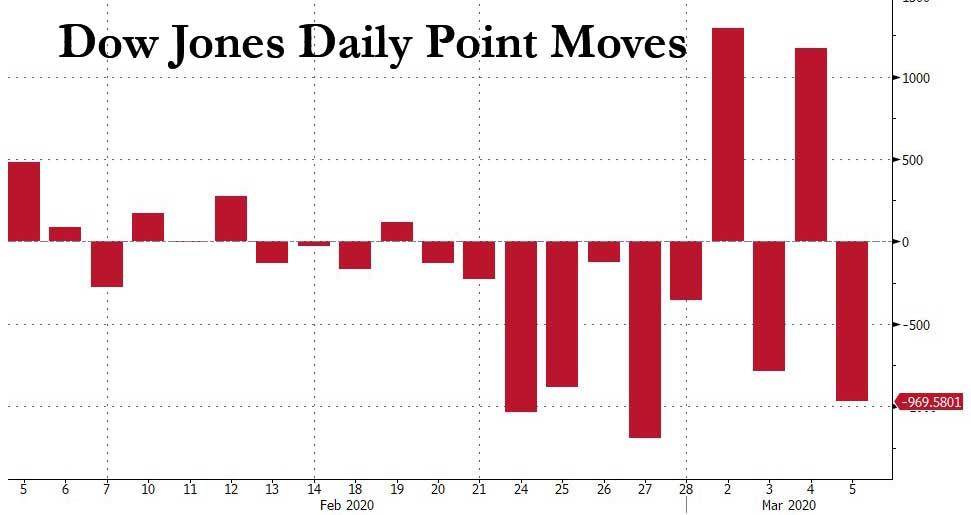
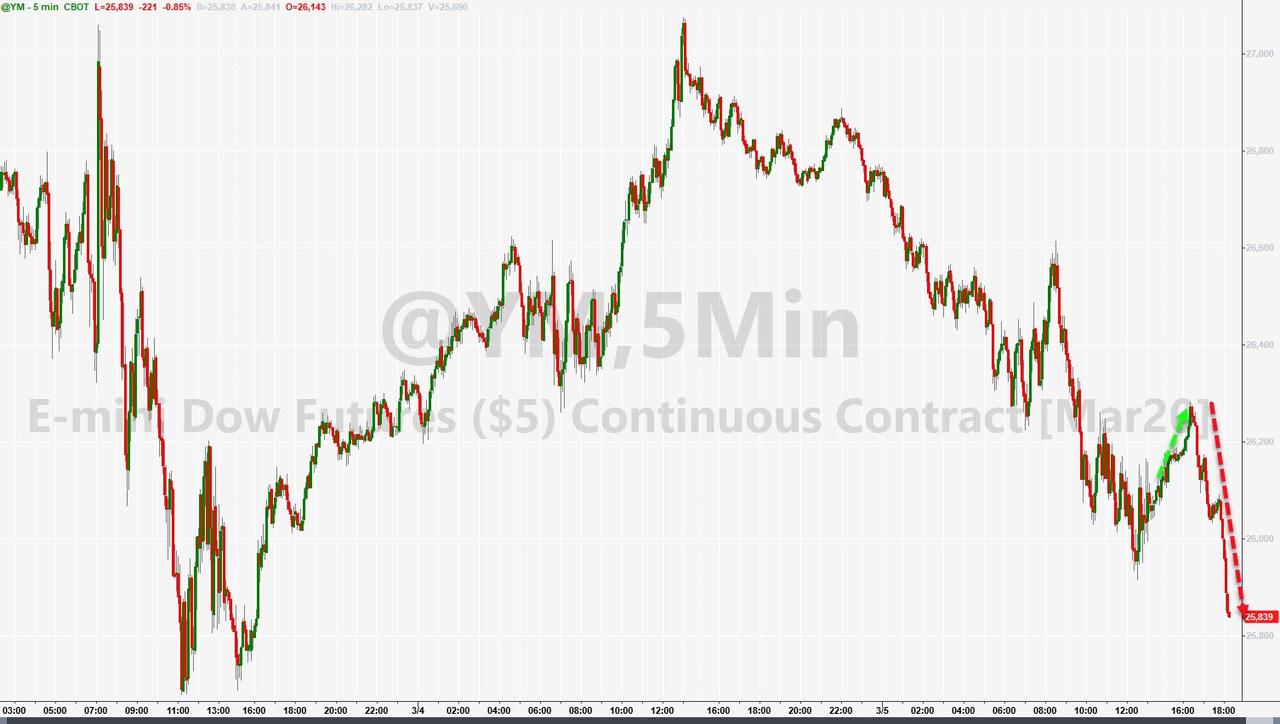
To say that moves in the US stock market have been erratic in the past two weeks would be a prodigious understatement: with the Dow Jones swinging by over 1,000 points on nearly 5 occasions in the past two weeks (today’s 970 point move would have been the fifth)…
… traders – holding on for dear life in a market rollercoaster the likes of which have not been seen in years – have given up trying to make sense, and are just praying they don’t lose all their money. “When you have a 4.5% up day in the market and a 2% down day – what does that mean?” Kathryn Kaminski of AlphaSimplex Group told Bloomberg. “It just means we don’t know what’s going on.”
And while futures continue to slide amid a surge in US coronavirus cases late on Thursday with over 2,000 New Yorkers now having self-quarantined, and emboldening what little is left of the bears – recall that heading into this week, single stock/ETF short interest was at all time lows…
… the bulls, who are rapidly losing faith that even the Fed can prop up this market, are pointing to the recent dramatic rebounds in the stocks most recently on Wednesday when the S&P500 surged back above 3,124 (it is now trading well below 2,990), yet which nobody can fully explain because even though there are several catalysts for the rebound that one could point to, historically speaking none of them are entirely satisfying as explanations, and as Nomura’s Masanari Takada writes in his daily Nomura quant note, “we suspect that more than a few investors (whether bearish or bullish) are feeling paralyzed in the face of such unusual swings in the market.”
However, it is what he says next that struck us as a stark admission that we have crossed the rubicon into a market that nobody, not even grizzled quant veterans, can explain: “We have also been at a loss to predict the market’s movements, and feel painfully reminded of the difficulties involved in drawing a story from nothing more than day-today changes in the market.”
And the punchline: “Even so, what is happening now is like nothing we have seen before.”
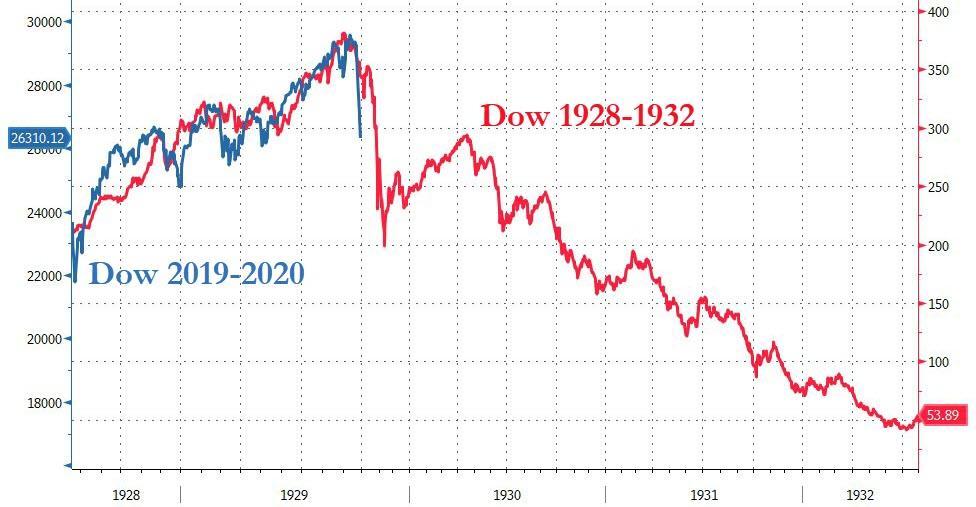
To be sure, here one can counter that maybe “we” simply haven’t been around long enough, and one just needs to extend the time horizon to observe a similar market to the one we have today. And so, indeed, without wandering too far off into the weeds, Nomura picks up on something we highlighted last week, namely that the market’s drawdown to a 10% correction from an all-time high was the fastest since just weeks before the great depression started…
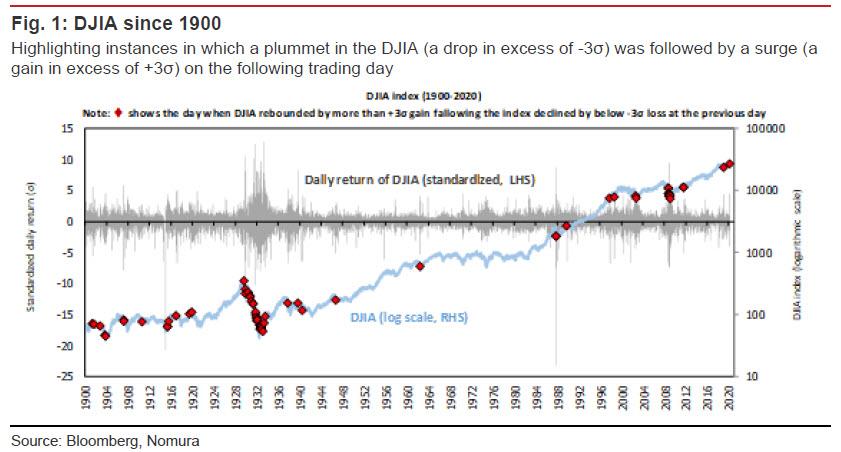
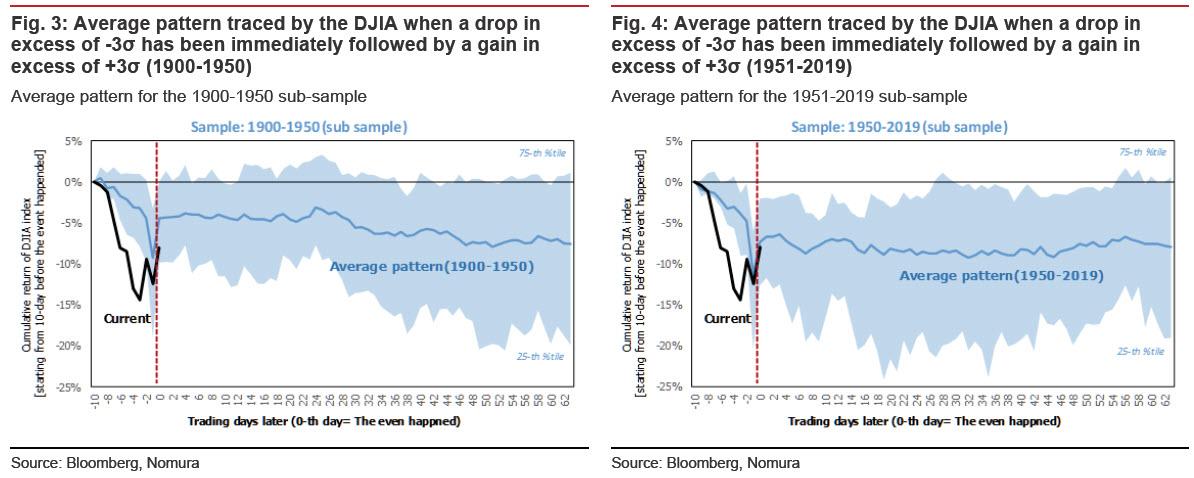
… and observes that there have been only 65 occasions since 1900 in which the DJIA has recorded a daily loss in excess of three standard deviations over the average daily return only to log a gain in excess of three standard deviations on the following trading day, and 70% of those occasions were concentrated in the 1900-1950 span, as happened this week on Tuesday and Wednesday (3 and 4 March), and 70% of those occasions were concentrated in the 1900-1950 span. In percentage terms, this is a frequency of just 0.21%.
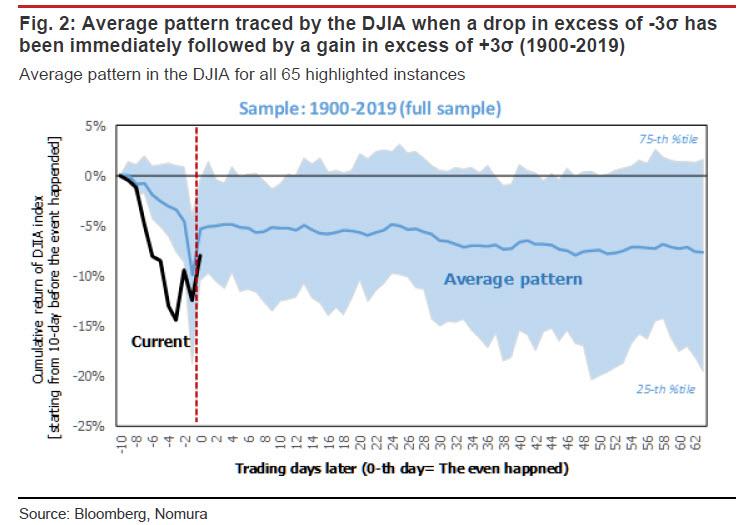
The last time this happened (14 January 2019), the market enjoyed a sustained rally, but the time prior to that (11 August 2011), no such rally ensued. Figure 2 is a plot of the average pattern followed by the market after each of these occasions, using the full sample of 65 instances between 1900 and 2019.
Yet while recent events are an extreme rarity across the entire historical spectrum, there is one distinct point in time when we observe cluster of activity similar to the furious market action noted in recent days (something tells us readers can already figure out which period we are talking about).
But before we get there, Takada writes that “it may be instructive to split this long span of time into two blocks (1900- 1950 and 1951-2019), as the impact of the Great Depression and the two world wars can be cordoned off in the 1900-1950 block. Even when back-testing the data in this fashion, however, we find no evidence that a gain in excess of three standard deviations on the day after a loss in excess of three standard deviations necessarily indicates that a bottom has been marked.
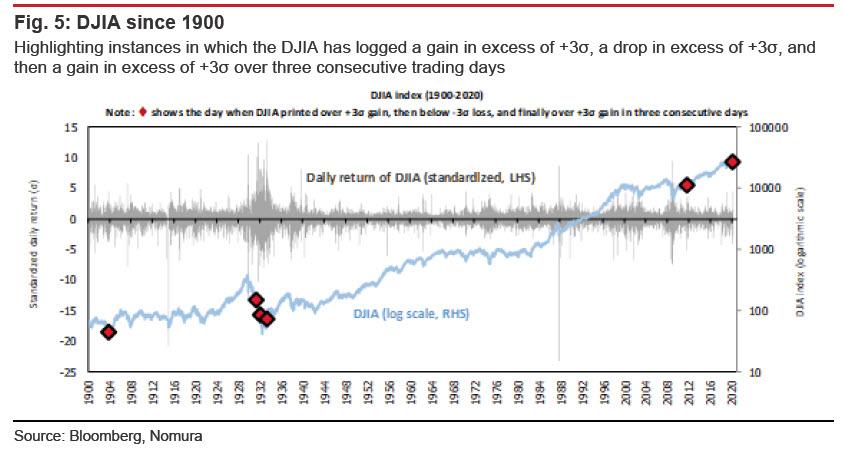
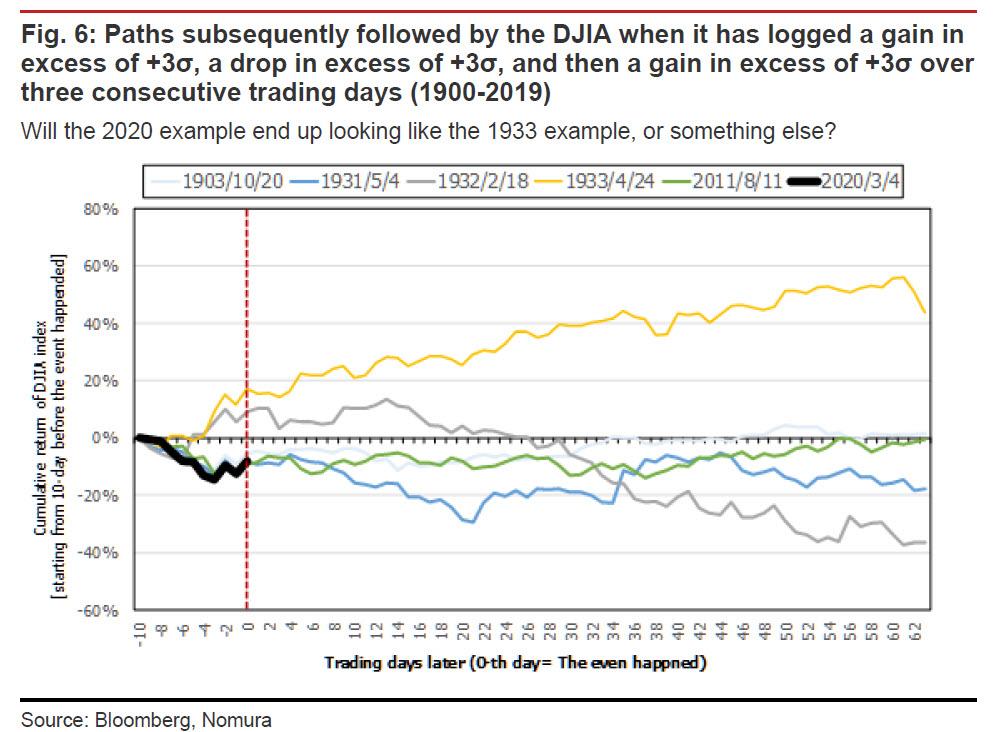
However, where the current market gyrations get even more interesting, is that this time the market logged a gain in excess of three standard deviations (over the average daily return), then a loss in excess of three standard deviations, and then a gain in excess of three standard deviations over the course of three consecutive trading days. This is only the sixth time this phenomenon has occurred since 1900.
And here is the stunning punchline: out of the five historical instances of this pattern (leaving out the present case for obvious reasons), Nomura finds that the only instance that was followed by a sustained market rally was that of April 1933, when the US abandoned the gold standard in the midst of the Great Depression.
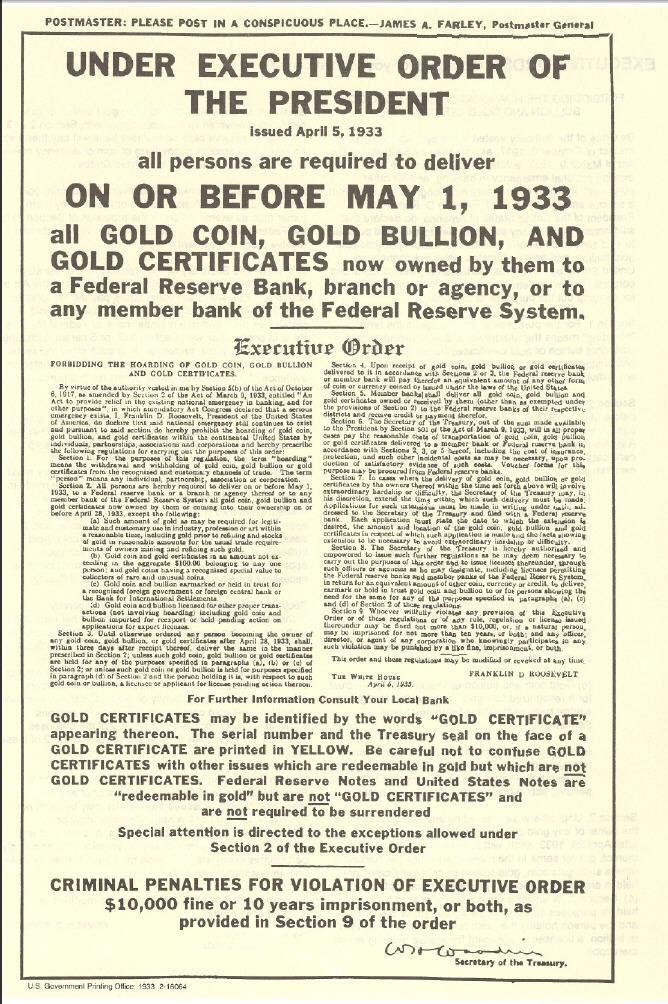
Which makes sense: with stocks in freefall for years after the Great Depression started, what some argue stopped the collapse, was the signing of Executive Order 6102 by FDR, which not only ended the gold standard, but also confiscated all gold held by the public, and finally devalued the dollar against gold (Roosevelt changed the statutory price of gold from $20.67 to $35 per ounce, thereby devaluing the U.S. dollar by 40%). Such a historic fiat devaluation against gold was, to many historians, the necessary condition that finally let stocks find a bottom during the great depression, and started the long and painful recovery… the culminated with World War II.
Of course, conditions now are vastly different than they were at the time of each of the five prior instances, with the dollar long ago losing its convertibility into gold (thank Nixon for that) – yet while it would be next to impossible to confiscate gold, a massive dollar devaluation against the yellow metal may be just what the Fed is planning next (as Harley Bassman suggested in 2016) – so Nomura’s dissection of these market patterns is intended only as something that may be of interest from a technical standpoint. That said, this look back at 120 years of market history may be helpful to market observers attempting to assess the sustainability of the rally in US equities…
… and also to spark some thoughts about what events may be necessary to halt the ongoing collapse in risk assets. Our advice: for those who own gold, now is a good time to have an unfortunate boating accident.
Ilhan Omar Tweets “Abortion Is A Constitutional Right”, Accuses Two Supremes Of Being “Sexual Predators”
A day after Senate Minority Leader threatened the Supreme Court (and later apologized for his language), none other than Rep. Ilhan Omar, D-MN, took to Twitter with some very accusatory Tweets.
She suggested two SCOTUS Judges of being “accused sexual predators” and then stated that abortion was a Constitutional right.
Two accused sexual predators should not be deciding whether or not women have access to healthcare in this country. https://t.co/okJE85pwoN
“Two accused sexual predators should not be deciding whether or not women have access to healthcare in this country,” she said.
She is allegedly referring to unproven and false claims against Justices Brett Kavanaugh and Clarence Thomas. Her statements were met with backlash from people around the country.
There’s more evidence that you married your brother to commit immigration fraud than there is for your false claims about Supreme Court Justices.
Just look at some of the responses from people around the country to Omar’s Tweets below.
Ilhan, again, I’m asking you to direct me to Chapter and Verse in the U.S. Constitution, where the Founding Fathers wrote this so called “right” please show me so I can read it myself…..I’m waiting
“Right to life…” is in the Constitution, so, abortion is pretty much the OPPOSITE of constitutional.
Maybe a Civics class or two would help with your glaring lack of knowledge about our nation’s rights.
— Susan [Needs a literary agent] Bagwell (@SweetieWalker) March 4, 2020
I’ll mail you a copy of the Constitution since apparently you have never read it.
— Peni Basse ⭐️⭐️⭐️ Text TRUMP to 88022 (@pmbasse) March 5, 2020
I’m not sure where she read that it was a right but I know for certain that abortion is something our Founding Fathers didn’t include in the Constitution.
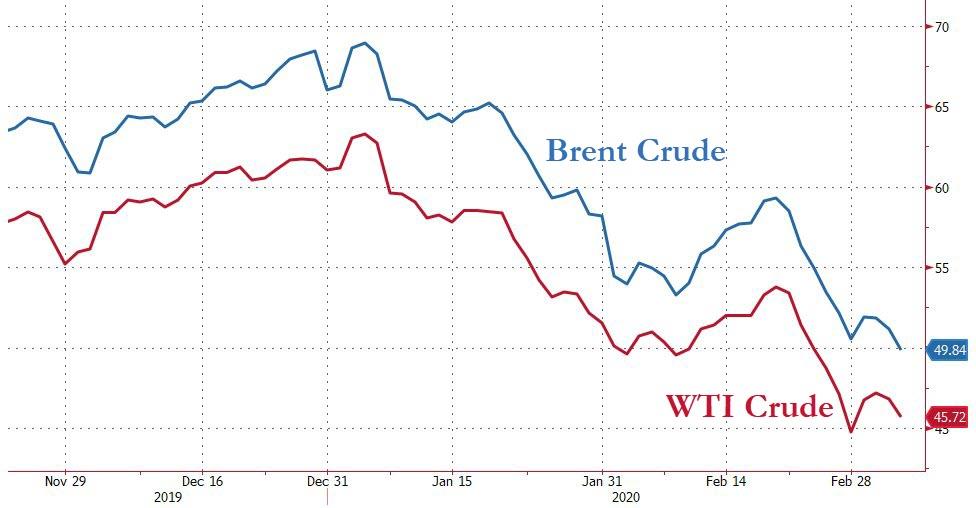
Oil prices have sold off sharply over the past month. Despite a series of bullish events – the killing of Qasem Soleimani by the US, Iran’s retaliation attack on US troops in Iraq, the shutdown of almost the entire Libyan production and the US’ tightening the screws on Venezuela by sanctioning Rosneft and potentially refusing to renew waivers to US companies stating in April – oil prices are now substantially lower than before these events. Brent front month prices peaked at $72/bbl in early January and are now at below $50/bbl (See Exhibit 1).
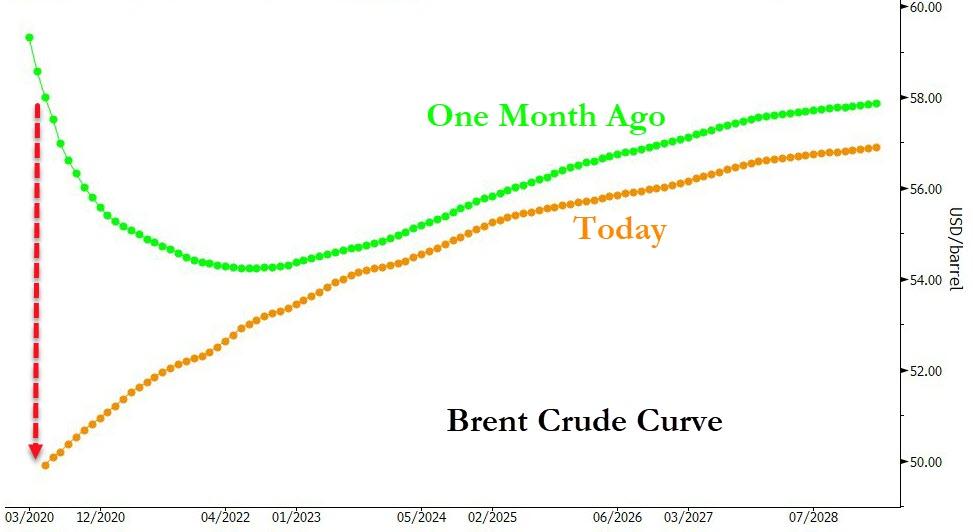
Moreover, by mid-January, the geopolitical tensions and supply losses had pushed the Brent curve into severe backwardation. June-December 2020 time-spreads for example traded as high as $4.50/bbl just one month ago, reflecting prolonged physical tightness. Those time-spreads are now in contango (see Exhibit 2).
This massive change in sentiment happened as the Coronavirus situation in China unfolded. Importantly, while we do expect a significant impact on Chinese oil demand from the massive travel restrictions in China, that alone would not warrant such a move in the curve in our view. Instead, we think the recent moves in oil prices is reflecting expectations for a significant slowdown in global economic growth. In fact, we think the oil price move is now pricing in a significant probability for a global recession in 2020.
Commodity markets are the only markets which currently reflecting this view. Equity markets, despite the recent sell-off, do not. Importantly, we believe commodity markets are still underpricing the risks to aggregate demand. The question is not longer whether the economic impact from the Coronavirus outbreak will be short-lived or whether it will be more pronounced. The question is whether the economic impact will be pronounced or catastrophic. In our view, energy markets are currently pricing in a pronounced impact with substantial fiscal and monetary stimulus down the road. There is substantial downside risk if that view turns out to be too optimistic.
That said, in either case we expect central banks to return to the 2008 playbook soon. Nominal interest rates will only decline from here and we are likely going to see a reacceleration in quantitative easing. However, in the catastrophic scenario, we believe central banks will quickly realize that the tools they have been using since 2008 will not get them very far this time. Hence, we would expect central banks to become more creative, by deploying something like “helicopter money”. This is not far-fetched. Hong Kong announced a few days ago that it would give every adult citizen HK$10’000, around $1300, in order to combat the economic fallout Coronavirus-crisis. We believe this would push gold prices sharply higher medium term.
How the Coronavirus outbreak changed the oil market outlook
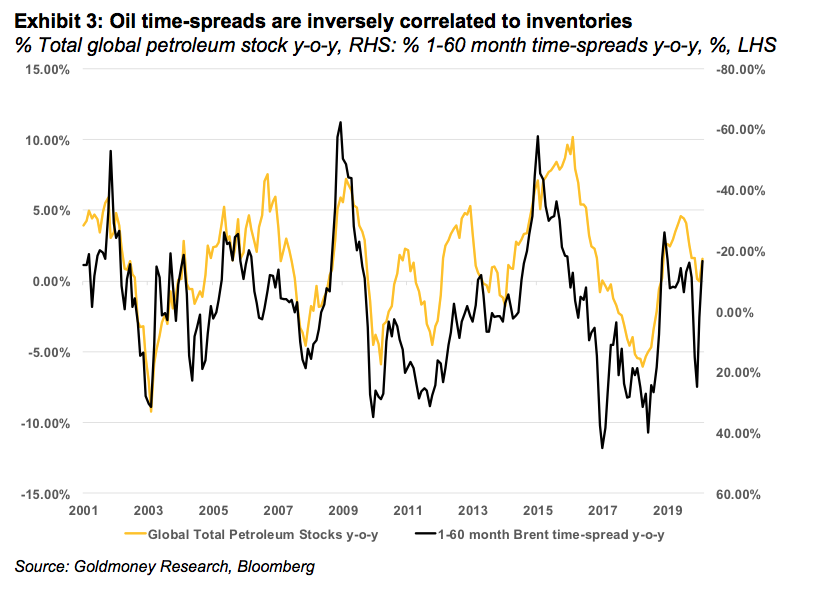
As we have highlighted before, there is a strong correlation between inventories and time-spreads (see Exhibit 3). When inventories are low, the oil curve tends to trade in backwardation (near-dated prices are above deferred prices). When inventories are high, the curve is in contango (near-dated prices are below deferred prices). The reason for this is that when inventories are low, consumers of a commodity are willing to pay a premium for immediate delivery rather than delivery at some point in the future. If oil (or any other commodity) is an input good in the production process, running out of the input good is much more costly than paying the premium as the alternative would be to shut down production. For example, jet fuel is an input good for an airline. Running out of jet fuel is very costly, hence, when inventories are generally low, airlines are willing to pay more for immediate jet fuel deliveries. The curve becomes backwardated. Conversely, when inventories are high, there is no risk of running out of oil, and storing oil is expensive (storage costs, insurance costs, time value of money), hence, consumers would rather have delivery in the future, and the curve is in contango.
The outlook at the end of 2019
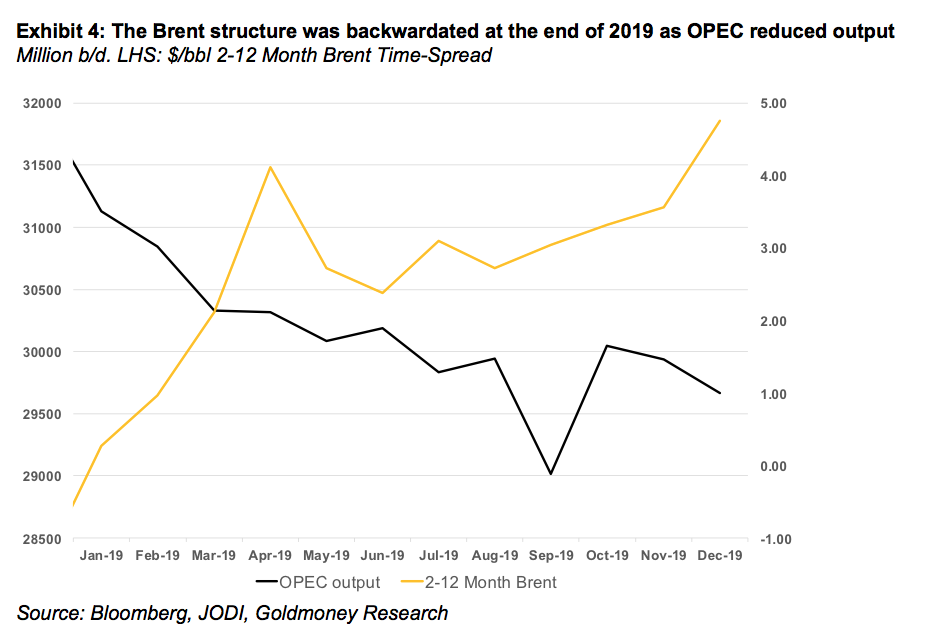
We ended 2019 with relatively low global petroleum inventories, and hence, the Brent curve was backwardated. The low inventory situation came amidst strong US shale production growth and weak global demand. The reason for this is that OPEC production was lower by close to 2mb/d year-over-year on both voluntary (core OPEC+) and involuntary (Iran, Venezuela) production cuts (see Exhibit 4).
However, we expected global balances to change going forward. By the end of 2019, we predicted the global oil balance to be oversupplied by roughly 0.7mb/d in 2020 and by about 1mb/d in 1H2020. Consequently, we expected the curve to become less backwardated and eventually to end up in contango, accompanied by lower front month prices.
Our bearish 2020 balance was driven mostly by strong production forecasts:
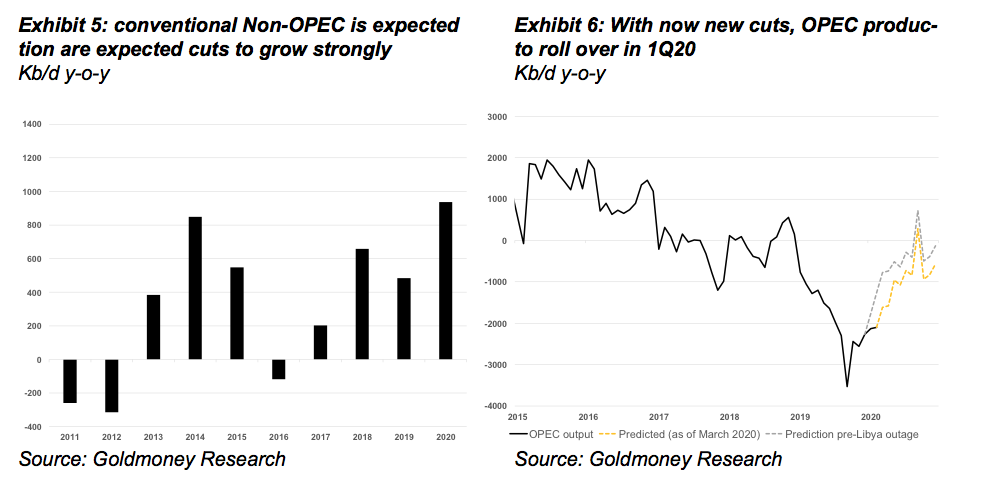
Conventional non-OPEC production was (and still is) expected to grow strongly in 2020 by about 1 mb/d with several major new fields coming online and ramping up.
US shale production, while not growing as quickly as in 2019, was still expected to grow at around 1mb/d (including natural gas liquids NGLs).
On net, we expected non-OPEC production to grow by 2mb/d year-over-year
This strong growth was expected to offset declines of 0.5mb/d year-over-year in OPEC production on the back of the new production cuts decided in December 2019 plus reduced output from Libya (we assume not all Libyan production will remain offline in 2020). The voluntary and involuntary production cuts from early 2019, however, would no longer show up as year-over-year declines.
On net, at the end of 2019 we expected global oil production to grow by around 1.6mb/d in 2020.
These supply growth expectations exceeded demand growth expectations in 2020. Most forecasters, including the International Energy Agency (IEA), predicted demand growth at slightly over 1mb/d. This reflected an expected recovery in global economic growth from 3% in 2019 to 3.4% in 2020. We had a more pessimistic outlook on demand growth of around 800-900kb/d because our calculation showed that demand growth was slowing down sharply in 2H2019, and thus, a minor recovery in economic growth would unlikely lead to the demand growth figures we had been accustomed to over the past years. But even with the more optimistic outlook by the IEA, the global oil balance was poised to be oversupplied.
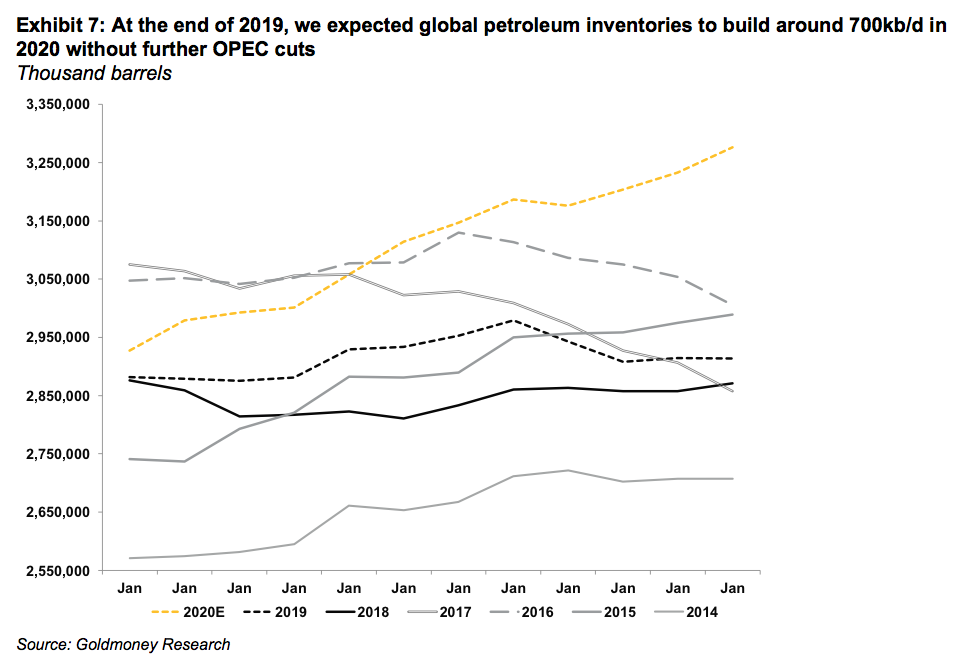
On net, we expected global petroleum inventories to build by close to 700kb/d in 2020 or about 230 million barrels. The bearish balances where mostly in 1H20 with an oversupply of >1mb/d, while it looked more neutral for the remainder of the year. Our inventory forecast, thus, implied weaker time-spreads and consequently, lower prices in 1H2020.
Shutting off Libyan exports
However, this bearish outlook was suddenly challenged in early January. Firstly, it was reported that Qasem Soleimani, an Iranian General of the revolutionary guards and commander of its Quds Force, was killed in an US airstrike in Iraq. Soleimani was considered the second most powerful man in Iran, in charge of all military operations outside Iran. The news sent oil prices sharply higher as the market began to worry about an escalation of this conflict in the region. Iran had repeatedly threatened to disrupt oil shipments in the Strait of Hormuz, through which about 1/3 of all seaborne oil flows. A few days later, Iran attacked a US base in Iraq with missiles in retribution. The US quickly announced that there weren’t any casualties among the US troops. The market interpreted that the Iranian retribution was an act of saving face rather than the first strike in a prolonged conflict, and prices moved sharply lower on the same day (see Exhibit 8). As suddenly as this conflict emerged, as quickly it was over, without any real impact on oil supplies.
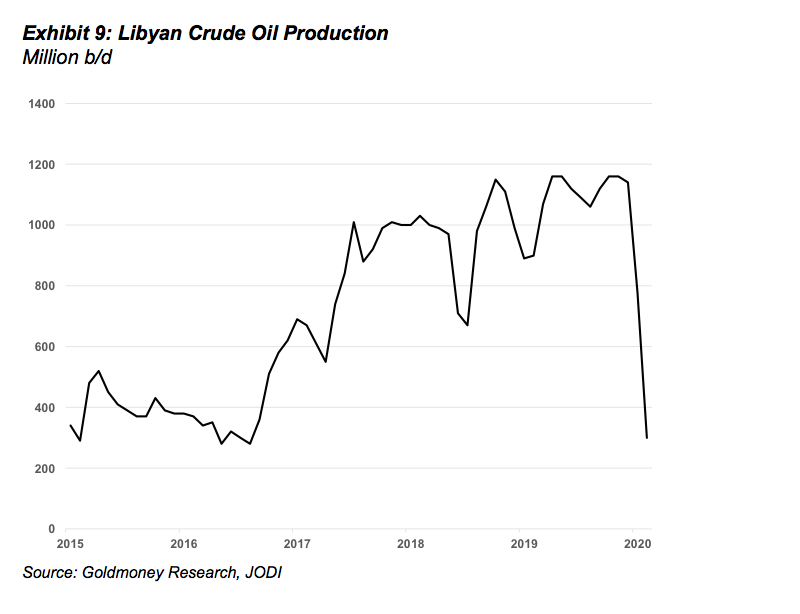
This changed quickly when on January 17, 2020, forces close to Libyan General Haftar closed almost all of Libya’s export ports. Prior to that, Libya had produced around 1.2mb/d of high-quality light sweet crude oil (see Exhibit 9). With the exports gone, the expected global oversupply in 1H2020 almost entirely vanished and 2H2020 now looked quite bullish. At the time, it was quite unclear how long the exports would remain shut-in.
Historically, exports resumed when demands from local groups that blocked exports were met. But this time, the situation is much more complex than just meeting financial demands of a few local interest groups. General Haftar seems to be using the exports as a bargaining chip in the ongoing international peace negotiations. He also seems to have the backing of local tribe leaders (who blocked the ports), which have been complaining about the unfair – or lack of – distribution of the oil revenues for years. Thus, the likelihood for a quick resumption of exports looked low in January (This view has since turned out to be correct. Six weeks into the disruption and a peaceful and quick resolution of the conflict seem very unlikely).
As oil exports could potentially remain offline for months, the Libyan situation turned an oversupply to a shortage overnight. Consequentially, oil prices rallied on these news and time-spreads became more steeply backwardated.
The Coronavirus outbreak starts impacting demand
This bullishness didn’t last long. Since oil prices peaked on the back of the Libyan news six weeks ago, oil prices sold off more than $20/bbl. Moreover, the Brent forward curve went from steep backwardation to contango. This sell-off is entirely driven by the outbreak of the Coronavirus in China. While there is a significant immediate impact on oil demand from the draconian measures taken by the Chinese government to contain the virus, we think the market is now pricing in wider demand destruction on the back of a global economic slowdown or possibly a global recession.
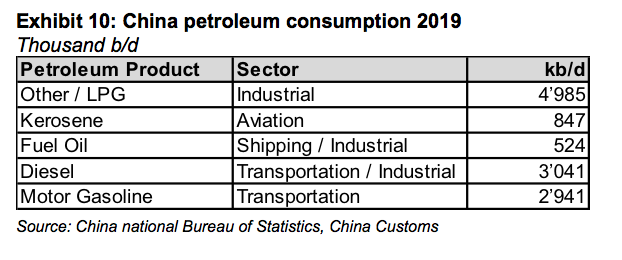
How much is oil demand affected in China? Chinese petroleum demand is roughly 13 mb/d, making it the second largest consumer in the world after the United States (see Exhibit 10). The below table show the breakdown of consumption by product:
We don’t have a lot of information out of China that would allow to directly calculate by how much oil demand is affected. The information we have suggests that air and rail travel and even car travel has decreased sharply, with some cities showing hardly any congestion in the streets. Thus, the hit from the transportation demand alone is most likely 2mb/d or even more as many international flights to and from China are suspended.
On top of that, manufacturing has come to an almost standstill in about 70% of the country. Over the past week, we saw some companies resuming operation, but only at a minority of plants in some regions. A lot of workers who came home from Lunar New Year are still required to stay at home. We estimate the total demand impact currently to be around 3mb/d. While this seems a lot, in our view, this alone cannot explain the dramatic move from backwardation to contango and the $20/bbl price decline in less than 4 weeks. We think the oil market is pricing in a sustained hit to global economic growth, to the point where it’s pricing in a significant probability of a global recession.
How big does the loss in oil demand have to be to warrant such a shift in the curve?
Our inventory-to-time-spread model allows us to back out how much the market is pricing in in terms of inventory builds. Prior to the outbreak of the Coronavirus, prompt prices traded 20% above longer-dated prices (5-year forward). Currently, prompt prices are trading 7% below the forward. In our time-spread to inventory model, such a move is equivalent to a 280-million-barrel build in global inventories. With 3mb/d of demand shut in, it would still take >3 full months of total Chinese lockdown in order to get to such a number, and that requires assuming that once the virus is contained, Chinese companies are not making up any of the lost production (and in turn oil demand). Hence, in our view, the shift in the Brent term structure is not simply reflecting lost Chinese demand, it is reflecting a sharp deterioration in global economic growth.
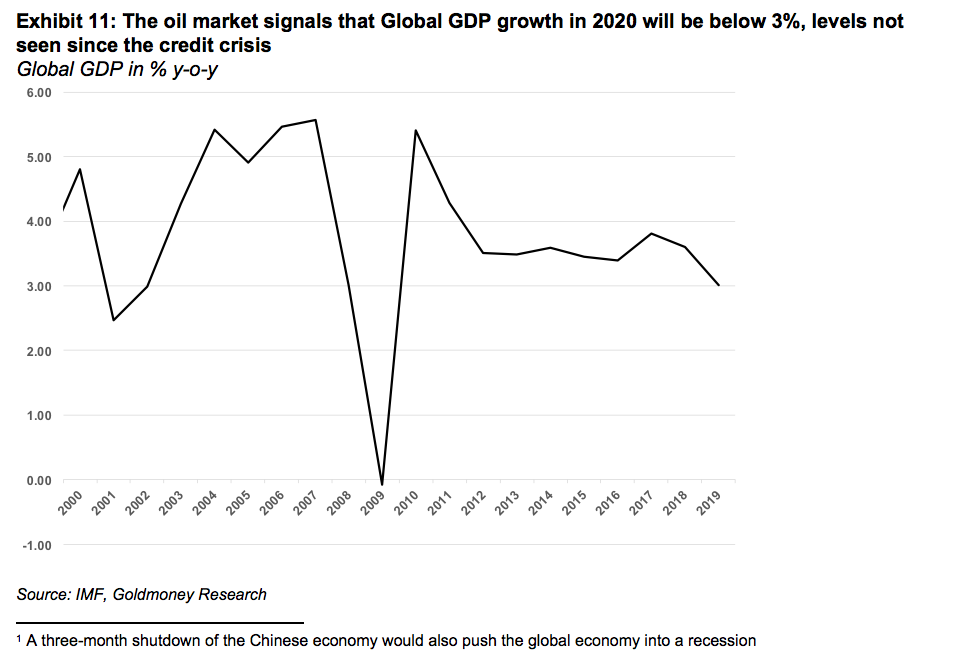
Assuming that lost Chinese demand is closer to 100 million barrels, 160 million barrels of inventory build (450kb/d) would have to come from lower economic growth outside of China. Our global demand model shows that a 1% change in global GDP accounts for 1 million b/d of oil demand. Thus, the market is now pricing in a 0.5% slowdown in global GDP on top of the slowdown in China. In other words, the oil market is pricing in global economic growth well under 3%. According to the IMF, the last time this has happened was during the finical crisis in 2009. Before that, one has to go back to the bursting of the dot.com bubble in 2002 to get to similar numbers.
Interestingly, commodity markets – oil and copper but also LNG and freight – are the only markets that seem to reflect this worldview. Equity markets on the other hand were making new highs even as the viral outbreak unfolded in China. While equities corrected sharply last week, equity markets have declined a lot less than commodities.
We may have already been in a recession before the Coronavirus outbreak
It may come as a surprise, but nobody really has a good handle on global oil demand. One would think that – given the importance of oil for the global economy – there would real-time in-depth data for oil demand across the globe. In reality, all demand data is of very poor quality, reported with a 2-3-month lag and very limited in scope (We only have data for OECD countries, which account for less than half of global demand). Furthermore, the data reported does not actually reflect what real demand is, it’s so called implied demand.
Meaning, the OECD member countries are obliged to report production of oil and petroleum products, changes in stocks as well as imports and exports. From those data points, implied demand is calculated. How much is actually consumed by cars, trucks, jets and heating boilers is unknown. In fact, for most regions, we don’t even know how much gasoline is sold at petrol stations. While some OECD countries report weekly implied demand data, it often comes with heavy revisions a few months later, to the extent that the weekly demand data reports are ignored by the oil market (the market focuses almost entirely on the inventory reports, as those are believed to be the least distorted). Hence, the best estimate we have for OECD demand is typically a few months old, and even that data often tends to be revised years later.
For non-OECD countries, demand data is even harder to obtain. Most non-OECD countries don’t report any data at all. Some do report some data, like China, but part of the data infers such strange results, that calculating implied demand becomes futile. Hence, non-OECD demand is typically just estimated based on economic growth projections. Hence, the global oil demand data that is typically reported and cited is simply a medley of notoriously bad OECD implied demand data and even less reliable estimates based on GDP predictions.
In addition, oil agencies such as the IEA typically publish balances that don’t balance. Meaning, supply minus demand does not equal changes in inventories on a global level. In other words, The IEA does calculate demand as implied demand bottom up for each country but applying the same data for a top down implied demand calculation for the world, leaves a huge error term. The reason typically provided for this error term, is that changes in non-OECD inventories are not part of the balance. However, we do have some inventory data from larger non-OECD economies, and taking those into account does not typically improve those balances, it often makes them worse.
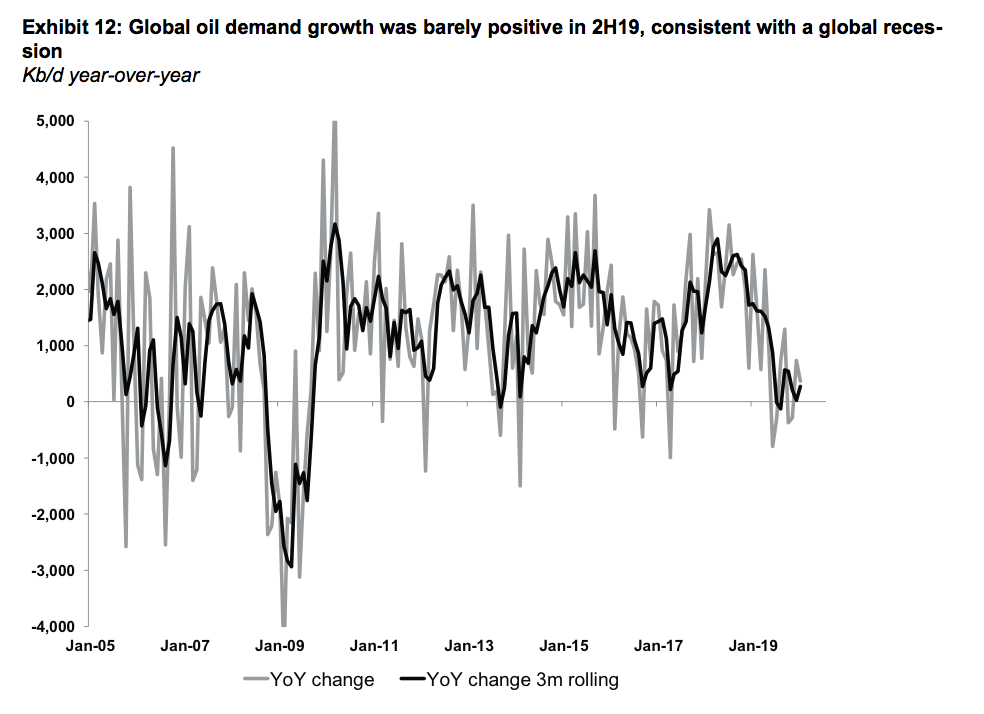
Thus, when trying to get a glimpse of the state of global demand, we calculate top-down implied demand. Meaning, we aggregate changes in global inventories, including oil at sea and add supply, which should add up to global demand. Importantly, our implied demand number for 2019 shows very weak demand of just 0.7mb/d year-over-year. This is below of what most forecast agencies show. Moreover, while implied demand was still healthy in 1H2019, it slowed down dramatically in 2H2019.
The latest numbers suggest that global demand growth in 2H19 was barely positive year-over-year. This would be consistent with global GDP growth at just 2%. While data for the most recent month will likely see some revisions, the latest revision have shown larger inventory builds than previously reported. We see indications for economic weakness in other corners of the petroleum markets as well. Demand from the chemical sector, for example, often an early warning sign for economic slowdown, was very weak in recent months.
Is the oil market bearish enough?
The oil market is one of the few markets that predicts a larger global economic impact from the virus outbreak. However, in our view, what is priced into the current forward curve is still too optimistic. The current 0.5% impact is the bare minimum we expect as a potential fallout on the global economy. This would require:
the draconian measured in China to be lifted over the coming weeks and business going back to normal (with heavy fiscal stimulus in 2H20),
Other governments abstaining from any comparable measures (no wide spread travel bans and lock-downs)
Companies outside China abstaining to close plants and offices and manage to remain productive
The general population largely accepting that they may get the virus eventually and going their business as usual
This scenario seems increasingly unlikely. France reported last week that tourism activity was down 30-40%. By the time this number was reported, the country had only 12 reported cases, so France can’t have been particularly affected by travel cancellations. We can, thus, assume that traveling activity across the world is now heavily impacted. Italy has over 2000 cases now as the virus is spreading in the northern part of the country. South Korea is closing plants and Japan has announced to close all schools until spring break. Global supply chains will no longer be impacted just because Chinese companies can’t deliver, but increasingly because manufacturers from other nations are affected as well. While supply is affected first, we expect demand to suffer going forward. Layoffs mean people will have less disposable income. The hospitality sector will be hit hard, retail as well. Car sales in China have collapsed and there are early indicators that car sales are already slowing down in Europe. We believe that – despite the sell-off – barely any of this to be currently priced into oil markets, still less in other assets such as equities.
Conclusion
Markets became really excited about some better PMI data prior to the Coronavirus outbreak. The IMF predicted a reacceleration in growth from 3% in 2019 to 3.4%. In all likelihood, the impact of the Coronavirus will bring 2020 growth well below 3% even in the “contained” scenario with minimal knock-on effects on other economies, either through supply chain effects or reduced demand for goods (commodities) from China.
However, if economic activity was in fact already much weaker in 2H19 than what is generally assumed, the Coronavirus may be just what it takes to finally push the global economy into a deeper recession.
In such a scenario, we would expect equities to adjust to reality over the coming weeks.
At the same time, this should be very positive for gold. Despite the near-term deflationary effects from lower commodity prices, we expect central banks to quickly return to the financial crisis playbook by slashing rates and deploying some form of Quantitative Easing (QE) or more direct form of stimulation (helicopter money). This would propel gold prices sharply higher over the medium term.
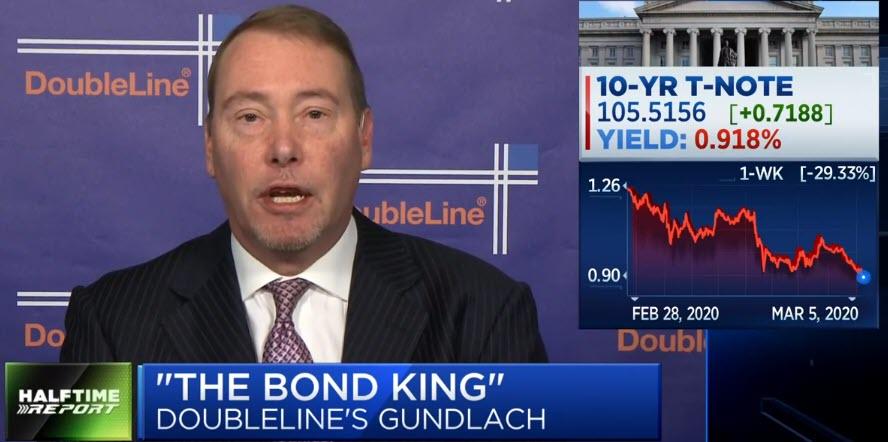
“Gold Is Going A Lot Higher” – DoubleLine’s Gundlach Warns Of “Seizure In The Corporate Bond Market”
“The bond market is rallying because The Fed has reacted the seizure in the corporate bond market – which is not getting enough attention.”
That was the sentence that sparked a chin hitting the table moment for anyone watching DoubleLine CEO’s Jeff Gundlach being interviewed on CNBC today. Until now, amid all this equity market carnage, various talking heads – who clearly are not ‘in’ the bond market – have confidently claimed ‘yeah, but it’s different this time, there’s loads of liquidity and credit markets are not showing any signs of pain’…Well that all changed today as the world was told the truth.
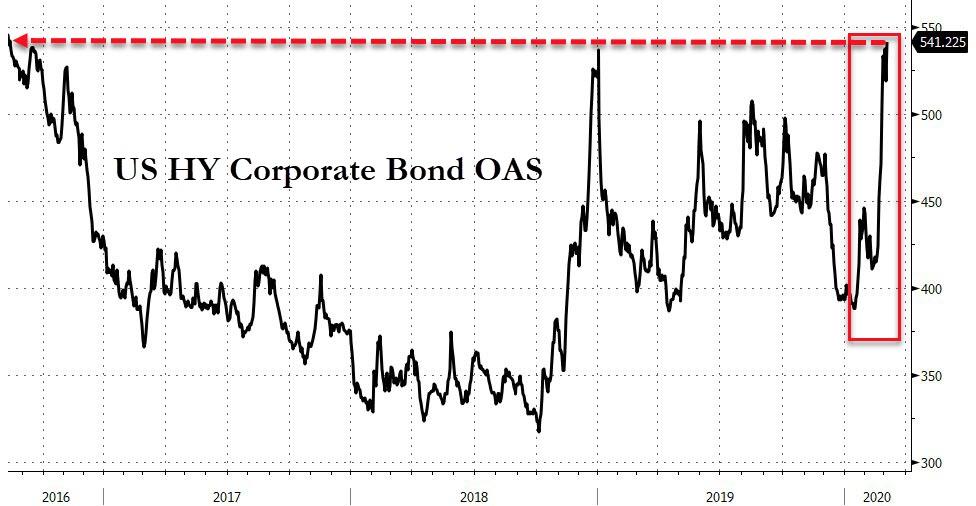
Credit spreads have exploded wider in recent days… “the junk bond market is widening out massively…”
Gundlach noted that Powell’s background in the private equity world – rather than academic economist land – has meant that his reaction function is driven by problems in the corporate bond market as “this will be problematic for the buyback aspect of the stock market.”
The Fed cut rates, he added, “in reaction to even the investment being shutdown for 7 business days.“
So the DoubleLine CEO said that Powell “cutting rates was justified” but didn’t like the way it was done as it signaled “panic.”
The reason for his disdain is clear:
“The Fed in their most recent press conference, took a victory lap, talking about how they had finally reached a stable place in policy and that they could be on hold for the foreseeable future, maybe even the entire world. That we are in a good place. That policy rates were appropriate. And I don’t know, I thought it was a little bit of hubris at this time.”
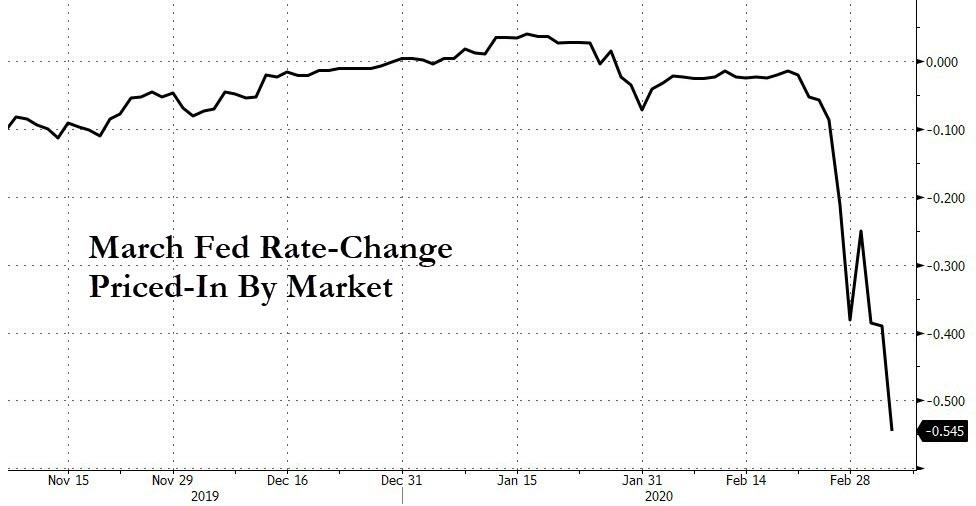
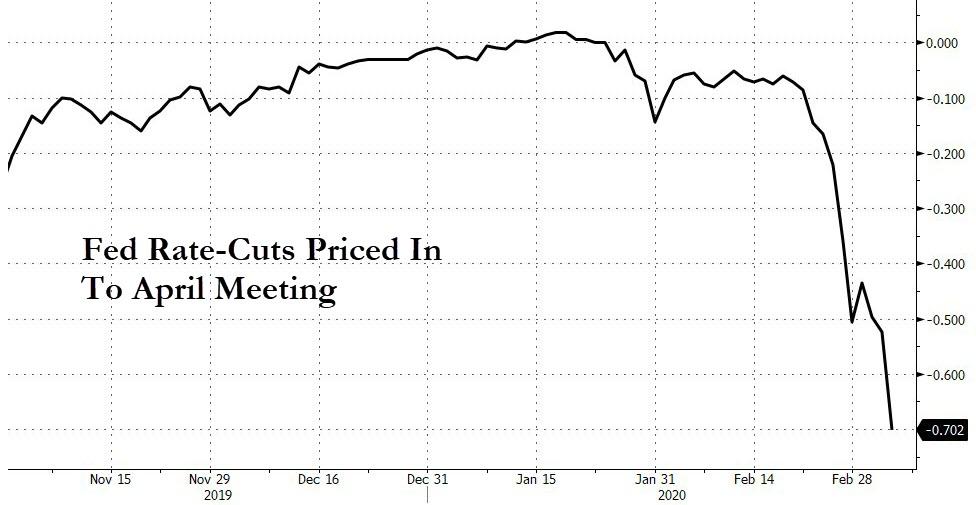
And reminds watchers that historically, “when The Fed has cut 50bps in an emergency intra-meeting such as this, they typically cut pretty quickly after once again.”
And sure enough the market is already pricing in another 50bps cut at the March meeting…
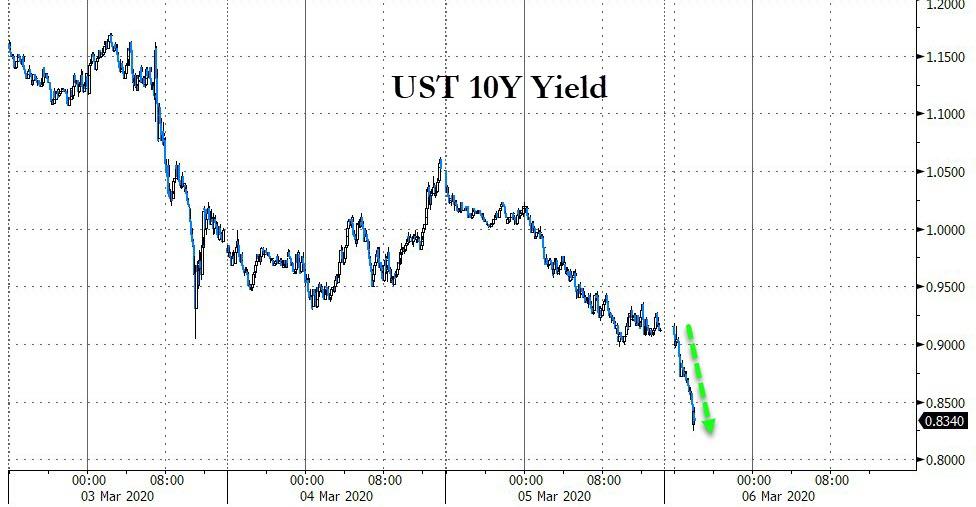
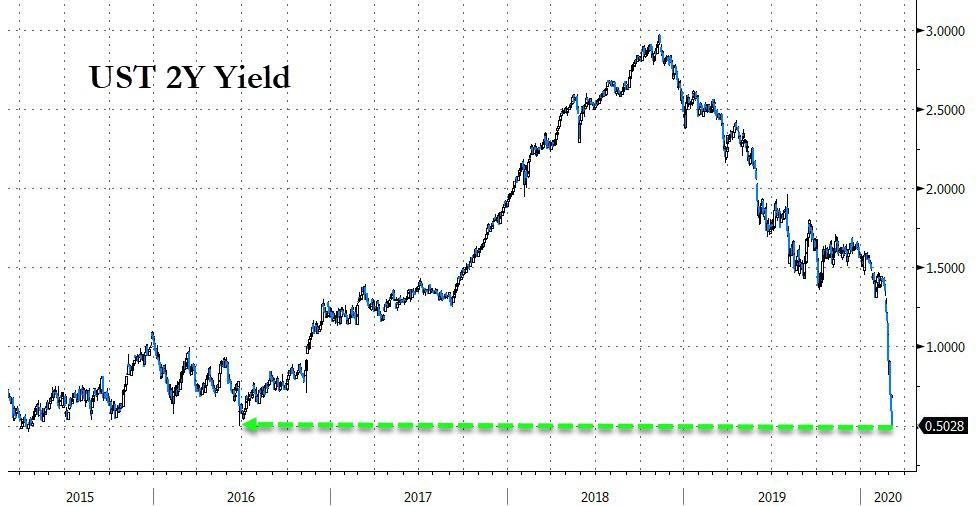
However, unlike Guggeheim’s Scott Minerd – who sees 10Y yields at 25bps – Gundlach believes “we are pretty near the low right now…maybe we get to 80 basis points on the ten year.”
Well we are at 85bps now…
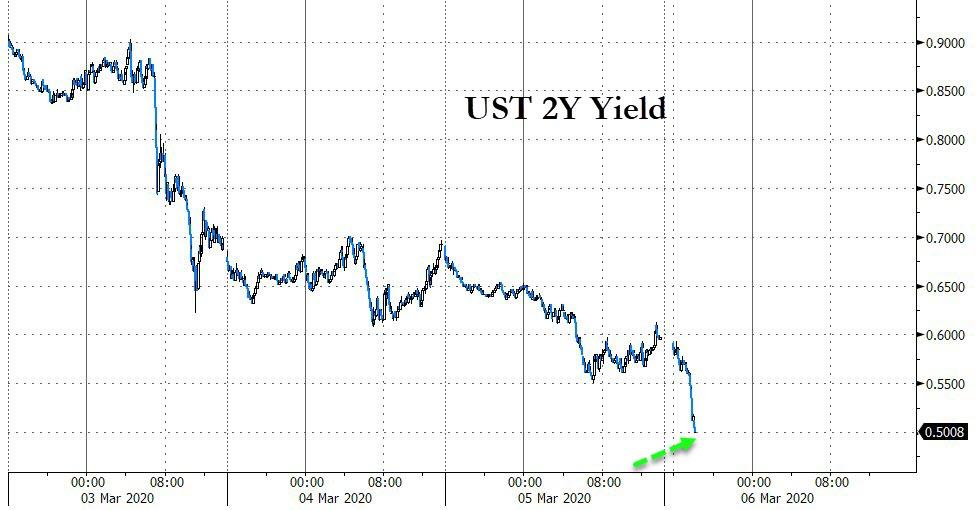
However, while his view is that long-rates are starting to floor, he notes that “short rates are definitely going lower. There is absolutely no upward pressure on short rates.”
Gundlach agrees with Jim Bianco that short-rates are going back to zero, but stopped short of expectations for negative rates:
“I think Jay Powell understands that negative rates are fatal to global financial system. If we go to negative rates, there will be capital destruction en masse.”
But more easing is coming, as Gundlach reflects on those calling for v-shaped recoveries:
“I think it is foolhardy to think anything other than this [pandemic] is going to take a major hit to short-term economic growth.”
His perspective on the financial and societal impact of the Covid-19 pandemic is refreshingly honest on CNBC:
“…obviously, the airlines are in free fall for good reason. And small business activity is going to contract. Maybe grocery store sales will go up on a short-term spike. But all other kind of social activity is grinding to a standstill.”
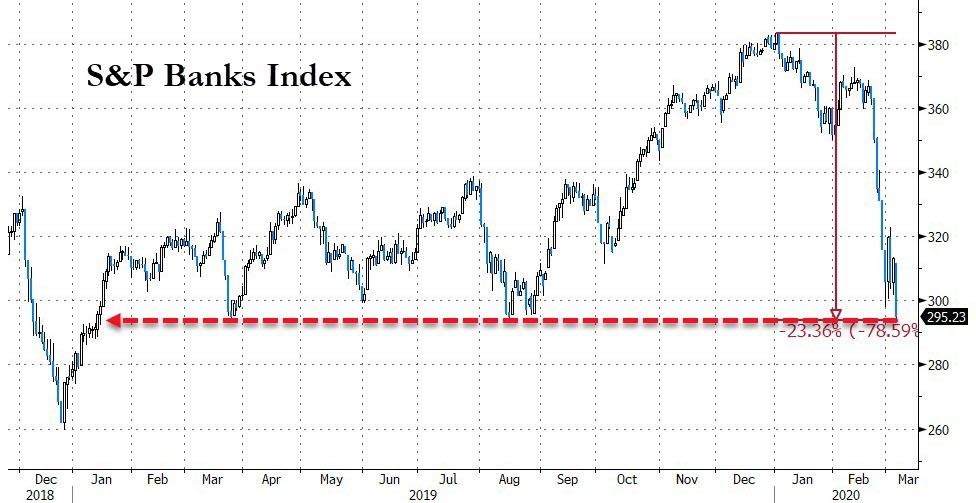
Warning that “the two sectors that are just falling knives are financials and transports. And I don’t see anything that’s going the reverse that until we get through the other side this valley of this sort of travel shutdown.”
Finally, Gundlach ends on an even more ominous note:
“…the President and the physicians, on top of this coronavirus situation, and they are saying that they might have a vaccine in like a year, year and a half.
So, nobody knows what is happening here. And so, caution is appropriate.“
So no more buy the dip?
As former Dallas Fed President Richard Fisher noted, that means a generation of money-managers are about to losae their security blankets!
And that’s why Gundlach is long gold:
“I turned bullish on gold in the summer of 2018 on my Total Return webcast when it was at 1190. And it just seems to me, as I talked about my Just Markets webcast, which is up on DoubleLine.com on a replay, that the dollar is going to get weaker.
And the dollar getting weaker seems to be a policy. And the Fed cutting rates, slashing rates is clearly going to be dollar negative. And that means that gold is going to go higher.“
The royal family in the UK is having its very foundations shaken by both the controversial departure of Prince Harry and Meghan and now startling new revelations which compromise Prince Andrew even further, since his “car crash” interview with BBC, over his alleged relationship with a sex-trafficked child prostitute working for Jeffrey Epstein.
Andrew had always denied any link whatsoever with the then named Virginia Roberts who was in just 17 when the main allegation – that Epstein flew her to London in March 2001 for her to have sex with the British royal – was brought against him. Central to that allegation was a photo taken by Ghislaine Maxwell in her London home on the same night in question which Andrew claims is fake.
Roberts claims that she was forced into the act by Epstein and Maxwell and has gone on the record to talk about the intimate details of the incident, but her case have been light on witnesses or those who can corroborate her allegations. Until now.
Her shocking claims are that Maxwell and Epstein were running a high class sex trafficking organisation which targeted powerful, influential individuals, which some might speculate was part of a Mossad run ‘honey trap’ – a blackmail ring which made Epstein hugely powerful and in a position to ask from the same targets favours, or for highly valuable information which could support its agenda.
In just a few days in mid February, Prince Andrew already feeble case which he was clinging on to – that he had no link whatsoever with Roberts – was shattered though, which in itself raises a number of questions over who is protecting the British royal. And at what price?
First off came the accusation by a palace security guard in London who has challenged Andrew’s claim to be in another part of the country (far from the capital) on the night of the alleged sexual incident. According to the security officer, Andrew returned to Buckingham Palace in the early hours and shouted at the top of his voice at the palace gates for them to be opened.
But far more damning is the testimony of a telecoms man who was employed by Epstein on his private Caribbean island who a British tabloid interviewed days later, who identifies both Prince Andrew and Roberts being intimate with one another and how she appeared to be like a child “hiding behind an adult” sometime around 2001 or thereafter.
There is nothing quite so powerful in a legal case which Roberts (now Giuffre) is preparing than eye witnesses who can stand in the witness box. And the emergence of Steve Scully will be seen as a massive blow to Andrew’s claims now. The FBI too will find it hard to ignore Scully’s allegations.
Or will it?
The notion supported by conspiracy theorists that Andrew is somehow being protected just got ratcheted up ten fold. The FBI interviewed Scully earlier but Prince Andrew’s name, curiously, was never mentioned.
Given that Epstein and Maxwell were almost certainly being bankrolled by Mossad and that Trump’s relations with Israel are unfathomable one has to ask if there is a deliberate plot in the US to not take Virginia Giuffre’s allegations seriously. Add to that Britain and the US forging stronger links post Brexit with a new trade deal in the air and Trump’s double state visit to the Queen and a reasonable question would be is there a ruse on both sides of the Atlantic to keep Andrew out of an FBI investigation? Or perhaps more worryingly, is Andrew part of a bargaining chip from Trump’s side to nail a more advantageous trade deal which benefits America more, given Trump’s style of blackmailing those he wished to secure deals with, which we have seen with other countries he tackles?
It is hard to imagine how many days left Andrew has as a British royal and a possible heir to the throne, given how tough the Queen was with Meghan and Harry, both stripped of their ‘royal’ titles as they bolt to the US to shamelessly cash in their fame. Andrew may well have to flee the UK and find a Caribbean island himself to escape the reach of both the FBI and Giuffre’s lawyers. But for the moment, he seems secure in the UK, protected by that oh-so special relationship between Trump and Buckingham palace.
After Purell Sells Out, Titos Says Stop Using Vodka As Hand Sanitizer
Americans have been panic buying masks, Purell, and food in the last several weeks as pandemic fears soar. We showed over the weekend how thousands of people rushed to Costco stores across the country to load up on supplies.
The latest run on products started with Purell last week. Brick and mortar and e-commerce stores ran out of the hand sanitizer made of an ethyl alcohol solution. As a result of surging demand and now shortages, it forced many people to experiment at-home in concocting their own hand sanitizer blend with vodka.
Austin-based Tito’s Vodka noticed Twitter users in the last 24 hours were using their spirits to make at-home sanitizers. Tito’s social media team was quick to inform anyone who was experimenting with Tito’s products that the concentration of alcohol in the products wasn’t high enough to be rated as an effective sanitizer. “Per the CDC, hand sanitizer needs to contain at least 60% alcohol. Tito’s Handmade Vodka is 40% alcohol, and therefore does not meet the current recommendation of the CDC,” Tito’s Vodka tweeted.
Per the CDC, hand sanitizer needs to contain at least 60% alcohol. Tito’s Handmade Vodka is 40% alcohol, and therefore does not meet the current recommendation of the CDC. Please see attached for more information. pic.twitter.com/DtpfsAHZKJ
“As soon as we saw the incorrect articles and social posts, we wanted to set the record straight,” a spokesperson for Tito’s said in a statement provided to The Dallas Morning News. “While it would be good for business for our fans to use massive quantities of Tito’s for hand sanitizer, it would be a shame to waste the good stuff, especially if it doesn’t sanitize (which it doesn’t, per the CDC).”
Per the CDC, hand sanitizer needs to contain at least 60% alcohol. Tito’s Handmade Vodka is 40% alcohol, and therefore does not meet the current recommendation of the CDC. Please see attached for more information. pic.twitter.com/QNEFOXxYPQ
Per the CDC, hand sanitizer needs to contain at least 60% alcohol. Tito’s Handmade Vodka is 40% alcohol, and therefore does not meet the current recommendation of the CDC. Please see attached for more information. pic.twitter.com/J5ifkV3Jah
Per the CDC, hand sanitizer needs to contain at least 60% alcohol. Tito’s Handmade Vodka is 40% alcohol, and therefore does not meet the current recommendation of the CDC. Please see attached for more information. pic.twitter.com/96uldE8uMe
As the fast-spreading virus infects America, what products will people hoard this coming weekend? We’re sure more videos will surface on social media of runs on stores.
It is not uncommon to encounter political theorists and pundits who insist that political centralization is a boon to economic growth. In both cases, it is claimed the presence of a unifying central regime – whether in Brussels or in Washington, DC, for example – is essential in ensuring the efficient and free flow of goods throughout a large jurisdiction. This, we are told, will greatly accelerate economic growth.
In many ways, the model is the United States, inside of which there are virtually no barriers to trade or migration at all between member states. In the EU, barriers have been falling rapidly in recent decades.
The historical evidence, however, suggests that political unity is not actually a catalyst to economic growth or innovation over the long term. In fact, the European experience suggests that the opposite is true.
Why Did Europe Surpass China in Wealth and Growth?
A thousand years ago, a visitor from another planet might have easily overlooked European civilization as a poor backwater. Instead, China and the Islamic world may have looked far more likely to be the world leaders in wealth and innovation indefinitely.
Why is it, then, that Europe became the wealthiest and most technologically advanced civilization in the world?
Indeed, the fact that Europe had grown to surpass other civilizations that were once more scientifically and technologically advanced had become apparent by the nineteenth century. Historians have debated the question of the origins of this “European miracle” ever since.
consists in a simple but momentous fact: It was in Europe—and the extensions of Europe, above all, America—that human beings first achieved per capita economic growth over a long period of time. In this way, European society eluded the “Malthusian trap,” enabling new tens of millions to survive and the population as a whole to escape the hopeless misery that had been the lot of the great mass of the human race in earlier times. The question is: why Europe?
Across the spectrum of historians, theories about Europe’s economic development have been varied, to say the least. But one of the most important characteristics of European civilization—ever since the collapse of the Western Roman Empire—has been Europe’s political decentralization.
Raico continues:
Although geographical factors played a role, the key to western development is to be found in the fact that, while Europe constituted a single civilization—Latin Christendom—it was at the same time radically decentralized. In contrast to other cultures—especially China, India, and the Islamic world—Europe comprised a system of divided and, hence, competing powers and jurisdictions.
Although modern EU centralizers are attempting it, at no point has European civilization ever fallen under the dominion of a single state as has been the case in China. Even during the early modern period, as some polities managed to form absolutist states, much of Europe — such as the highly dynamic areas in the Low Countries, Northern Italy, and the German cities — remained in flux and highly decentralized. The rise of the merchant classes, banking, and an urban middle class — which began as early as the Middle Ages and were so essential in building the a future industrial Europe — thrived without large states.
After all, while a large polity with few internal borders can indeed lead to large markets with fewer transaction costs, concentrating power in one place brings big risks; a state that can facilitate trade across a large empire is also a state that can stifle trade through regulation, taxation, and even expropriation.
The former vast kingdoms and empires of Asia may have once been well positioned to foster the creation of a wealthy merchant class and middle class. But the fact is this didn’t happen. Those states instead focused on stifling threats to state power, centralizing political control of markets, and extorting the public through the imposition of fines and penalties on those who were disfavored by the ruling classes.
The Benefits of “Anarchy”
In contrast, Europe was relatively anarchic compared to other world civilizations and became the home of the great economic leap forward that we now take for granted. This isn’t “anarchy” in the sense of “chaos,” of course. This is anarchy as understood by political scientists: the lack of any single controlling state or authority. In key periods of the continent’s development—as now—there was no ruler of “Europe” and no European empire. Thus, in his book The Origins of Capitalism, historian Jean Bachler concludes:
The first condition for the maximization of economic efficiency is the liberation of civil society with respect to the state….The expansion of capitalism owes its origins and raison d’être to political anarchy. (emphasis in original)
For many years, economic historians have attempted to find correlations between this political anarchy and Europe’s economic success. Many have found the connection to be undeniable. Economist Douglass North, for instance, concludes:
The failures of the most likely candidates, China and Islam, point the direction of our inquiry. Centralized political control limits the options—limits the alternatives that will be pursued in a context of uncertainty about the long-run consequences of political and economic decisions. It was precisely the lack of large scale political and economic order that created the environment essential to economic growth and ultimately human freedoms. In the competitive decentralized environment lots of alternatives were pursued; some worked, as in the Netherlands and England; some failed as in the case of Spain and Portugal; and some, such as France, fell in between these two extremes.
Competition among Governments Means More Freedom
But why exactly does this sort of radical decentralization “limit the options” for ruling princes and kings? Freedom increases, because under a decentralized system, there are more “alternatives”—to use North’s term—available to those seeking to avoid what E.L. Jones calls “predatory government tax behavior.” Thus, historian David Landes emphasized the importance of “multiple, competing polities” in Europe in setting the stage for
private enterprise in the West possess[ing] a social and political vitality without precedent or counterpart. This varied, needless to say, from one part of Europe to another…And sometimes adventitious events like war or a change of sovereign produced a major alteration in the circumstances of the business classes. On balance, however, the place of private enterprise was secure and improving with time; and this is apparent in the institutional arrangements that governed the getting and spending of wealth.
It was this “latent competition between states,” Jones contends that drove individual polities to pursue policies designed to attract capital. More competent princes and kings adopted policies that led to economic prosperity in neighboring polities, and thus “freedom of movement among the nation-states offered opportunities for ‘best practices’ to diffuse in many spheres, not least the economic.” Since European states were relatively small and weak—yet culturally similar to many neighboring jurisdictions—abuses of power by the ruling classes led to declines in both revenue and in the most valuable residents. Rulers sought to counter this by guaranteeing protections for private property.
This doesn’t mean there were never abuses of power, of course, but as Landes observed:
To be sure, kings could, and did, make or break men of business; but the power of the sovereign was constrained by the requirements of states…and international competition. Capitalists could take their wealth and enterprise elsewhere and even if they could not leave, the capitalists of other realms would not be slow to profit from their discomfiture.
Nor was decentralization limited to the international system of separate sovereign states.
Thanks to the longtime tug-of-war between the state and the church, and between kings and nobles, decentralization was common even within polities. Raico continues:
Decentralization of power also came to mark the domestic arrangements of the various European polities. Here feudalism—which produced a nobility rooted in feudal right rather than in state-service—is thought by a number of scholars to have played an essential role….Through the struggle for power within the realms, representative bodies came into being, and princes often found their hands tied by the charters of rights (Magna Carta, for instance) which they were forced to grant their subjects. In the end, even within the relatively small states of Europe, power was dispersed among estates, orders, chartered towns, religious communities, corps, universities, etc., each with its own guaranteed liberties.
Over the long term, however, it was the system of international anarchy that appears to have ensured that states were constrained in their ability to tax and extort the merchant classes and middle classes, who were such a key component of Europe’s rising economic fortunes.
We Need a Return to Smaller Polities
Even today, we continue to see these factors at work. Small states—especially in Europe and the Americas—tend to have higher incomes and have greater openness. We can see this in the microstates of Europe and in the Caribbean. Small states, seeking to attract capital, often undercut larger neighbors in terms of taxes.
It is true that one of the most economically successful polities in the world today is a large one: the United States. The US’s success, however, can be attributed to the enduring presence of political decentralization internally—especially during the nineteenth century—and to the latent, albeit receding, economic liberalism esteemed by much of its population. Europe, of course, was already rich—and relatively politically free compared to the despotic regimes of the East—long before it began to centralize political power under the banner of the European Union.
Today, however, we are seeing the impoverishing downside of decades of political centralization in both the US and Europe. Government regulations decreed from Brussels and Washington continue to stifle innovation and entrepreneurship. The EU has sought to crack down on low taxes in smaller member states. Both the EU and the US are erecting trade barriers to producers outside their trading blocs.
The antidote to all of this is to decentralize. Decentralization, after all, has never been a true barrier to economic growth. If anything, the rise of mobile capital and global trade has made economic success more attainable for small states than ever before. Moreover, the implosion of the Soviet Union provides yet another example of how the disintegration of a large state can lead to far more economic progress than had been thought possible.
Unfortunately, those in power, who benefit from the status quo and from holding the reins of large states, are unlikely to relinquish their power without a fight.
Bloomberg Launching New Group To Support Democratic Nominee, Attack Trump
‘Mini’ Mike Bloomberg is forming a new organization which will support the Democratic nominee and attack President Trump, according to the Washington Post.
This type of stuttering, mental impairment and overall cognitive decline is frequently seen in patients who suffer from a neurological disease like dementia. pic.twitter.com/WpjErGaS96
To take on President Trump in November – in the midst of a potentially (some would say unavoidably) serious coronavirus outbreak blanketing the country.
Bloomber’s new group – which has yet to disclose its name while it’s in teh trademark application process – will absorb hundreds of the billionaire’s presidential campaign staffers in six swing states.
One major hurdle is the fact that Bloomberg’s ‘meme team’ is the best money can buy, and they’re still not funny.
Bloomberg’s meme team is sure to do wonders for Joe Biden.
“I’ve always believed that defeating Donald Trump starts with uniting behind the candidate with the best shot to do it,” Bloomberg said Wednesday after suffering a staggering defeat during Super Tuesday. “After yesterday’s vote, it is clear that candidate is my friend and a great American, Joe Biden.”
Bernie Sanders’s advisers, meanwhile, say they want no help from Bloomberg’s crack team of electioneers.
Bloomberg’s advisers have identified Wisconsin, Michigan, Pennsylvania, Arizona, Florida and North Carolina as the six states that will decide the electoral college winner this year. Staffers in each of those states have signed contracts through November to work on the effort.
The new group also could serve as a vehicle for Bloomberg to support Democratic candidates for the House and Senate. In 2018, Bloomberg gave $20 million to Senate Majority PAC to support Democratic senatorial candidates. A separate group he founded, Independence USA, spent $38 million to help Democrats retake the U.S. House. –Washington Post
In addition to Bloomberg’s new organization, he will continue to fund Hawkfish – a political data company which is supporting Democratic campaigns, according to a person familiar with the discussions. The company has signed a long-term lease in the same building in Times Square which has been home to Bloomberg’s presidential campaign.
Suppose that a government has a trillion dollars that it wishes to use to subsidize private spending toward some objective. For example, it might want to launch a massive campaign against the spread of COVID-19. There might be many ways to spend the money, on items large and small–say, research, education, salary for sick people who skip work, quarantine centers, ventilators, hand soap, and so on. The government could create a large administrative agency, writing rules about who is entitled to government checks and performing claim adjudication. But it would be challenging to scale such an agency even under the best of circumstances to handle processing of tens of millions of claims. The challenge is especially acute if we assume that the core goal is difficult to translate into rules, for example because a large number of factors are relevant to assessing the social utility of particular spending projects. If the process is to be governed by standards, there will be inconsistency based on who makes the decision.
In a new article, I describe and defend a novel approach that the government can use to distribute money at scale, without creation of a large bureaucracy and without enacting extensive rules. The paper provides applications focused on climate change rather than on COVID-19, but the approach can be applied to any massive governmental spending program. Here’s how it would work: Anyone who claims to have contributed to the specified goal could file a claim. To discourage frivolous claims, a small fee might be applied. Rights to payment on claims could be sold. The government would commit to randomly select a small number of claims, say 1,000. An agency would then estimate social benefits produced for each of these claims, using panels of multiple decisionmakers and considering expert evidence where appropriate. It would then distribute the entire trillion dollars to the claims’ owners, in proportion to the measurement of social value for the corresponding claims.
Because claims are transferable and only a tiny percentage of claims will be eligible for reimbursement, intermediaries would aggregate diverse portfolios of claims. This will allow intermediaries to bear the risk associated both with the random selection of only a small percentage of claims and with the unpredictability of the government’s assessment of claims randomly selected. An intermediary will pay more for a claim that it expects will be worth more on average, if randomly selected for consideration. A claim is thus worth what it will fetch in the market. An individual or entity might perform actions to meet the government’s objective and then create a claim, or it might sell a claim via a contract in which it promises the intermediary that it will invest the money provided by the intermediary in a particular way.
The principal virtue of the system is that it requires very little bureaucratic infrastructure, even if the government is distributing an enormous sum of money to a very large pool of claimants. All the government needs to do is randomly select a very small number of claims and perform adjudications where it estimates the associated social benefits. Moreover, the government need not create detailed rules. The adjudications can be based on a vague standard, such as “estimated social benefits in reducing the spread of COVID-19.” Use of a standard means that there will be uncertainty, and this is the primary drawback of the system. But diversified intermediaries can bear the risk of that uncertainty relatively cheaply. Standards should be much more tolerable than in a typical administrative regime, because uncertainty will not impose risk on regulated individuals (who may offload the risk onto intermediaries), and because uncertainty will not increase adjudication costs (because the same number of claims will be adjudicated regardless of the total number filed). As usual, a standard avoids the overinclusiveness and underinclusiveness of rules, thus reducing the danger that funds will be spent inefficiently.
My claim is not that this system is necessarily better than traditional approaches to distributing government funds. My claim is simply that this is a new approach and that it might have advantages in certain contexts. Whether this makes sense for COVID-19 prevention or for any other application depends on how good a job one thinks the government can do with a more traditional, centralized system for spending money directly or choosing private projects to receive government money. This evaluation depends in part on whether one believes that the government can make its assessments relatively free of political considerations, and in part on how expensive it will be for the government to make these determinations. A more traditional system will be preferable when there are relatively few claims so achieving scale is not an issue, and when the purposes of the program can be efficiently translated into rules.
Emergency spending (whether of a trillion dollars or a mere eight billion) is potentially a good application of the market-based approach, because the government may not be equipped to make large numbers of high quality decisions extremely quickly. Eventually, government decisionmakers will need to evaluate spending in a few cases, and bad decisions ex post are possible. The system’s performance, however, must be evaluated not based on the actual ex post valuations that the agency will produce, but on the market’s ex ante expectations of these ex post valuations. Even if the agency is likely to make many errors ex post, the ex ante expectations might track social value reasonably well. The market process itself will impose costs, as intermediaries will seek to make a profit, but competition will tend to reduce these by driving up the amount that intermediaries offer. Because intermediaries do not need to provide due process, their costs of assessing claims may be less than the costs of relatively formal governmental adjudicative processes. Even if the government is slow, claimants will be able to receive payment quickly from intermediaries, instead of queuing while awaiting administrative determinations.
The law review article describes the functioning of the market and of the government agency in much more detail and responds to objections. I’ll look at the comments for the strongest and most recurrent objections and will address these in a subsequent post.
from Latest – Reason.com https://ift.tt/3axPOaM
via IFTTT