Authored by Sven Henrich via NorthmanTrader.com,
Yesterday’s announcement by the Trump administration to delay some of the new tariffs on China it just announced a few weeks ago was initially greeted with relief by equity markets across the globe. This proved to be mistake as reality is dawning and global stock markets are selling off hard just a day later on ever weakening economic data in Europe and Asia and further yield curve inversions.
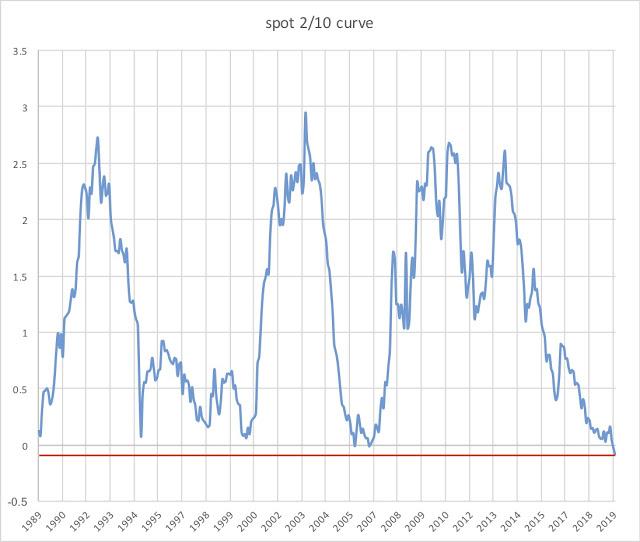
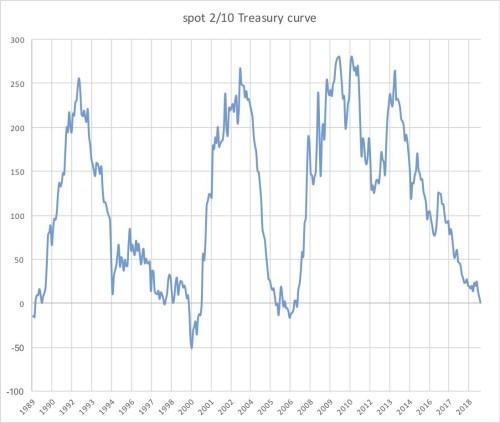
Call it a major hangover as the reversal in tariffs was not coming from a position of strength, it was coming as a result of global economic reality sinking in, a reality that is making its way rapidly to US shores as well. The collapse in global yields has been a theme since October of 2018 with the US 10 year dropping to 1.6% from its October 2018 high of 3.25%, but only now that the 2 year/10 year yield curve has inverted are the official recession alarm bells ringing. Why? Because every single recession in the past 45 years has seen a 2 year/10year yield curve inversion preceding it.
To believe no recession is coming is to argue that this inversion is defying history. And indeed let’s look at history, because it is now used to argue that this yield curve inversion leaves room for further market rallies to new highs. Does it?
If history is a guide, then the answer is yes but market relevant timing can vary quite a bit and depending on how the data is framed up you can get different conclusions.
The calmer interpretation comes via Credit Suisse:
“A recession occurs, on average, 22 months following a 2-10 inversion. The S&P 500 is up, on average, 12% one year after a 2-10 inversion. It’s not until about 18 months after an inversion when the stock market usually turns and posts negative returns”.
Yet via BAML we can see history suggesting scenarios that offer precious less time:
“For the ten [2/10] inversions back to 1956, the S&P 500 topped out within approximately three months of the inversion six times (1956, 1959, 1965, 1973, 1980, and 2000). The S&P 500 took 11 to 22 months to peak after the other four inversions (1967, 1978, 1989, and 2005).”
Three months versus 22 months? That’s quite a big gap.
Now both of these historic time windows suggest there is room for markets to make new highs in the next few months. In fact one can imagine several scenarios on how these new highs could come about.
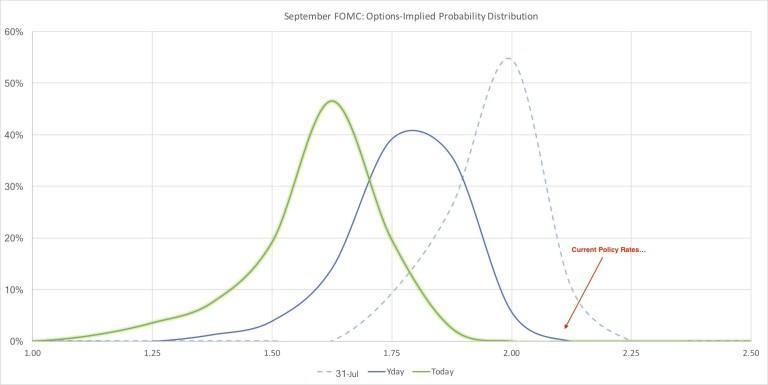
Central banks could embark on emergency rates cuts and re-introduce quantitative easing programs and hope to force more cash into equities again.
The Trump administration, eager to avoid a recession ahead of the 2020 election, may find themselves in a position to end the trade war sooner rather than later. As it turns out the Trump administration is faced with several historic miscalculations of their own making. The massive tax cuts of 2017 have produced little in the form of growth other than a temporary sugar high. Growth is slowing and has been slowing. Long gone are the promises of 4% GDP growth. Rather growth is looking to drop below 2% in lieu of a trade deal. The only thing that has been growing are deficits on pace to hit $1 trillion this year already.
Turns out trade wars are not easy and the global growth picture is accelerating to the downside. Last week the UK announced negative GDP growth for the past quarter. This week it’s Germany announcing shrinking GDP with its 10 year hitting a record negative 0.62% yield and European industrial production having gone negative and China announcing its lowest industrial production growth in 17 years.
All of these are signs that the risk of a global recession is a clear and present danger and hence a sudden end to a trade war, with a attempt at face saving by both sides, could certainly spark a sustained global relief rally that may end up averting a recession at this stage as uncertainty would be alleviated and investment decisions, currently on hold, could be made again.
Indeed the most powerful combination of factors setting the stage for a coming market rally of size would be rate cuts first and then a sudden end to the trade deal. It could prove to be a liquidity bonanza.
That’s the upside, the downside is also current context versus history:
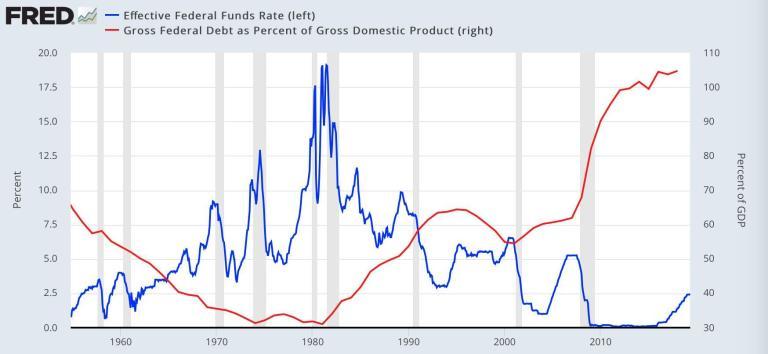
We’ve never faced a recession with so much debt and so little Fed ammunition available and with negative rates still in effect in many places
There’s no playbook for this.
Historic data will be of little use.— Sven Henrich (@NorthmanTrader) August 14, 2019
And this is where I caution everyone to rely on history exclusively believing we have time. Do we have time?
We’ve never been in this situation before. Ever. Hence there is no economic model that can predict what will happen next. In fact no economist saw this coming:
Hi I’m a professional Wall Street economist with a PhD . Now let me tell you where the 10 year is going. I’m here to help.
h/t @pcordway pic.twitter.com/8H10Bntu83— Sven Henrich (@NorthmanTrader) June 10, 2019
If nobody saw this coming, then why take comfort in what everybody is saying at this stage?
This is what we’re faced with:
This is not to fear monger, but to state objective facts.
A prolonged decline in equities would certainly bring about a recession and if labor markets were to suddenly turn it may happen a lot sooner than anyone can imagine. Hence an end to the trade war may be absolutely mission critical. Yet big structural disagreements remain with no clear path to a resolution.
The system will aim to defend itself and it will do so with further rate cuts, currency interventions, and perhaps with a surprise end to the trade war. But reality is dawning and the bond market has been signaling this reality all year.
This is a very tricky environment for investors to navigate through. History suggests there is time to take advantage of future rallies to prepare for the next recession and raise cash before a major market downturn does unfold. But global incoming data suggests that a global recession may be coming a lot sooner than anyone can previously anticipated and we’re finding ourselves in a situation where policy makers have a lot less ammunition at their disposal than during previous downturns. A sudden end to the trade deal may be imperative, without it there may be a lot less time than history suggests.
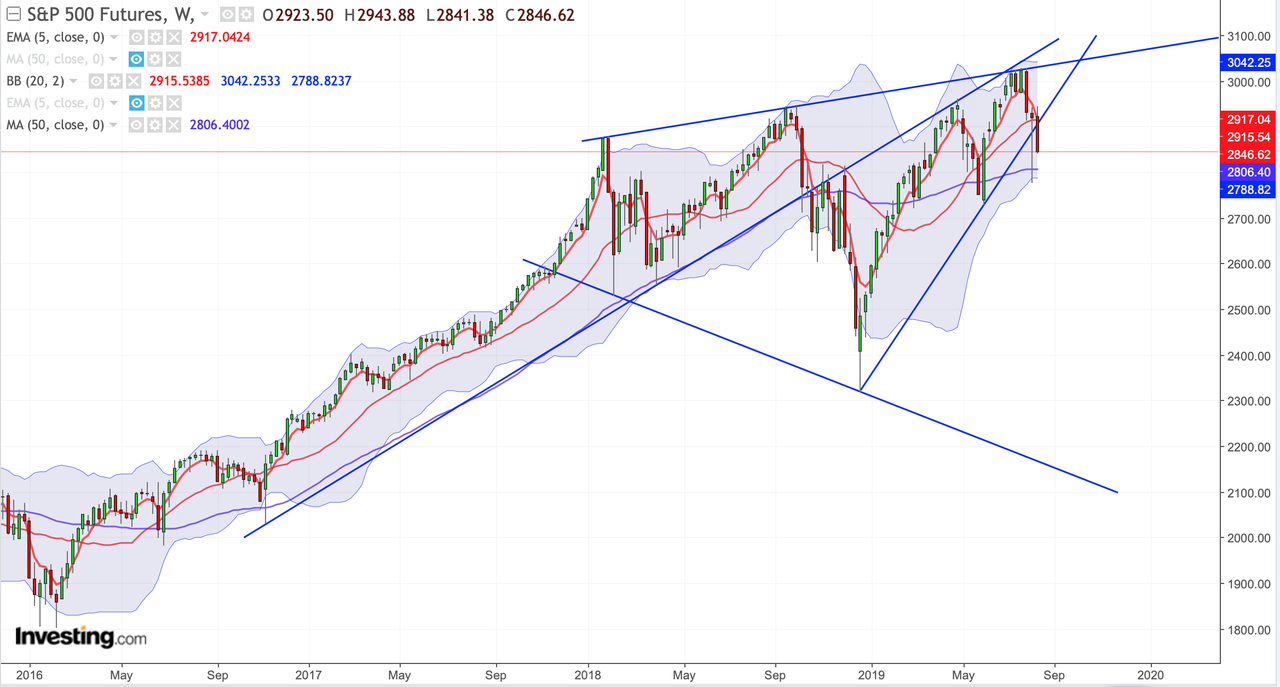
As it stands markets remain above last week’s lows, but have now again broken their 2019 up trend:
Will another magic rescue tweet or headline save the week again? To soon to tell, but technically the following can be noted:
The 2009 trend line remains broken. The 2016 trend line remains broken. The 2019 trend line appears broken. And the larger market continues to reside inside the range of a broadening top formation. As long as $ES can maintain a hold above the weekly 50MA bulls can take comfort in future oversold rallies to come. See a sustained break of the weekly 50MA and the bull thesis is in serious technical trouble and perhaps only a China trade deal can save it.
* * *
For the latest public analysis please visit NorthmanTrader. To subscribe to our market products please visit Services.
via ZeroHedge News https://ift.tt/33zmyO9 Tyler Durden

