Newly published antibody test results from half a dozen parts of the country confirm that COVID-19 infections in the United States far outnumber confirmed cases. The ratio of estimated infections to known cases in these studies, which the U.S. Centers for Disease Control and Prevention (CDC) reported on Friday, range from 6 to 1 in Connecticut as of early May to 24 to 1 in Missouri as of late April.
These results confirm something we already knew: The infection fatality rate—deaths as a share of all infections—is much lower than the crude case fatality rate—deaths as a share of known cases. That is bound to be true when testing is limited and a virus typically produces mild or no symptoms. At the same time, the CDC’s antibody studies imply that efforts to control the epidemic through testing, isolation, quarantine, and contact tracing will not be very effective, since they reach only a small percentage of virus carriers.
The CDC analyzed blood samples drawn for routine tests unrelated to COVID-19 from patients in New York City, Connecticut, South Florida, Missouri, Utah, and western Washington state. Although these samples may not be representative of the general population, they provide a clearer picture of virus prevalence than screening limited to people who sought virus tests because they had symptoms consistent with COVID-19 or because they were in close contact with known carriers.
In New York City, where the samples were drawn from March 23 through April 1, nearly 7 percent tested positive for COVID-19 antibodies, implying that infections outnumbered reported cases during that period by 12 to 1. The prevalence estimated by a state-sponsored antibody study conducted from April 19 to April 28 was three times as high, although the ratio of estimated infections to known cases (about 11 to 1), was similar. The difference in estimated prevalence can be at least partly explained by the spread of the virus between early and late April.
The gap between the two estimates may also be partly due to differences between the samples used in the studies. The CDC study was based on patients whose doctors ordered routine blood tests, while the New York State Department of Health study used blood drawn from randomly selected shoppers. Infections might have been unusually common among people who ventured out to stores during the study period, either because they were more likely to encounter carriers or because they had already recovered from COVID-19 and therefore felt safe leaving their homes. (Then again, the health department study might have missed people who were self-isolating because they had symptoms or because they had close contact with people who had COVID-19.)
In South Florida, where the samples were collected from April 6 through April 19, almost 2 percent tested positive. That is just one-third the prevalence that University of Miami researchers found in a random sample of Miami-Dade County residents about a week later. As with New York City, some of the difference might be due to rising infections, and some of it might be due to differences in sampling methods. The CDC study did not use a random sample of the local population, and it included patients from Broward, Martin, and Palm Beach counties as well as Miami-Dade. It is also possible that the antibody test used by the University of Miami researchers, which has relatively low specificity, generated more false positives than the test used by the CDC.
The CDC put the ratio of infections to confirmed cases in South Florida at 11 to 1, which is the same as the ratio it estimated in Utah, where the samples were collected from April 20 through May 3, and in western Washington, where the samples were collected from March 23 through April 1. Connecticut, where the blood was drawn from April 26 through May 3, had the lowest ratio of estimated infections to confirmed cases: 6 to 1. Missouri, where samples were collected from April 20 through April 26, had the highest ratio: 24 to 1.
What do these findings imply about the infection fatality rate (IFR) in these places? New York City had recorded 2,580 COVID-19 deaths as of April 1, when the CDC estimates 641,800 residents had been infected, which implies an IFR of 0.4 percent. (The IFR implied by the state health department’s study, by contrast, was around 0.6 percent.) The COVID-19 death toll in Connecticut was 2,495 as of May 3, when the CDC estimates the state had 176,700 infections. That implies a much higher IFR: 1.4 percent.
Utah had recorded 57 COVID-19 deaths as of May 3, when the CDC estimates the state had 47,400 infections, implying an IFR of just 0.1 percent. Missouri’s death toll was 388 as of April 26, when the state had an estimated 161,900 infections. That implies an IFR of about 0.2 percent.
These are just snapshots, and the IFRs in Utah and Missouri may have risen as the epidemic progressed in those states, especially if people infected in May were more vulnerable to the disease. But even now, there is a striking gap between the crude case fatality rates in New York City and Connecticut (8.4 percent and 9.3 percent, respectively) and the crude CFRs in Utah and Missouri (0.8 percent and 4.9 percent, respectively). That suggests COVID-19 patients have fared worse in New York and Connecticut than they have in Utah and Missouri, for reasons that may include the prevalence of preexisting medical conditions, the stress that the epidemic put on local health care systems, and policies regarding high-risk people such as nursing home residents.
It is plausible that the IFR for COVID-19, as well as the crude CFR, would vary from one part of the country to another, depending on local conditions. Based on the CDC’s “best estimates” of the death rate among all Americans who develop COVID-19 symptoms (whether or not they are tested for the virus) and the percentage of infections that are asymptomatic, the nationwide IFR is something like 0.26 percent.
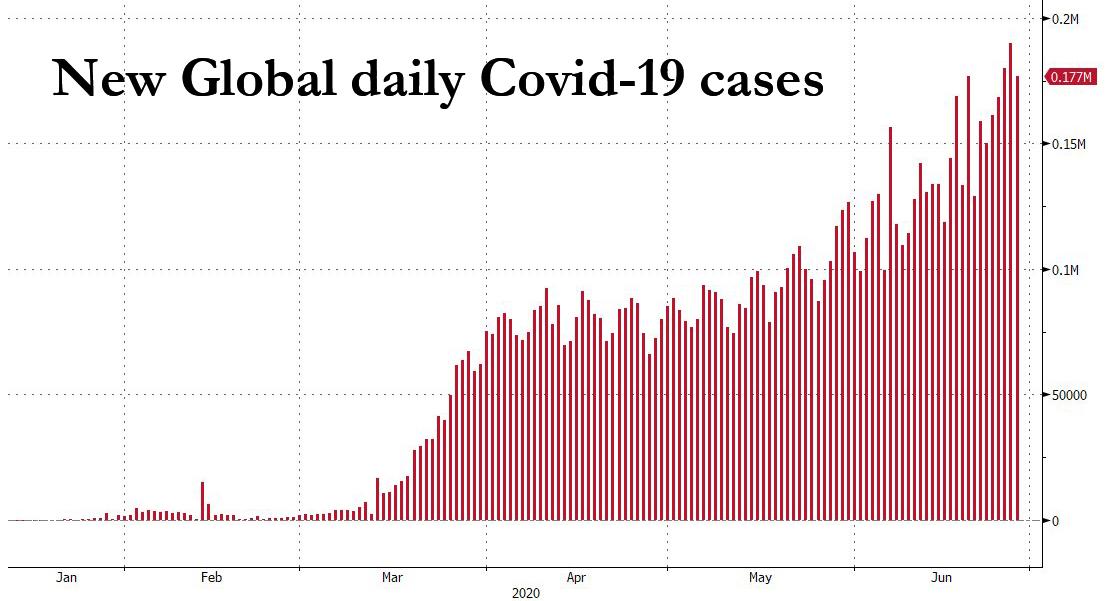
Virus testing in the United States has expanded considerably since early May, which helps explain why the nationwide crude CFR has been falling, from more than 6 percent on May 16 to less than 5 percent today. As more people with mild or no symptoms get tested, the denominator includes more low-risk cases, driving down the apparent death rate. The gap between confirmed cases and total infections also could shrink as testing is expanded, but that depends on the pace of new infections, which have been rising at a fast clip in several states.
In Texas, where newly confirmed cases rose 10-fold between May 26 and June 25 before falling slightly, the share of virus tests that were positive rose from 4.3 percent on May 26 to 13.2 percent on June 26, which indicates that expanded testing is not keeping pace with rising infections. It looks like the gap between confirmed cases and infections is growing in places like Texas, while it is shrinking in places like New York City, where the test positivity rate (based on a three-day average) plummeted from 70 percent on March 30 to 2 percent on June 25.
When the ratio of infections to confirmed cases is high, there is little hope of containing transmission by identifying and quarantining carriers and their contacts, even if a state has the capacity to do contact tracing. The CDC’s antibody study “underscores that there are probably a lot of people infected without knowing it, likely because they have mild or asymptomatic infection,” CDC scientist Fiona Havers told The New York Times. “But those people could still spread it to others.”
The light gray lining of this dark cloud is that newly infected people in states such as Texas, Florida, Arizona, and California are substantially younger now than they were earlier in the epidemic, which means the death rate in those places should be falling. The seven-day average of newly reported COVID-19 deaths in Texas fell from 58 on April 30, when the statewide lockdown was lifted, to 20 on June 13. It has since risen to 29 and is apt to climb more as recently contracted cases progress. But the outcome would be far worse if new COVID-19 patients in Texas were older.
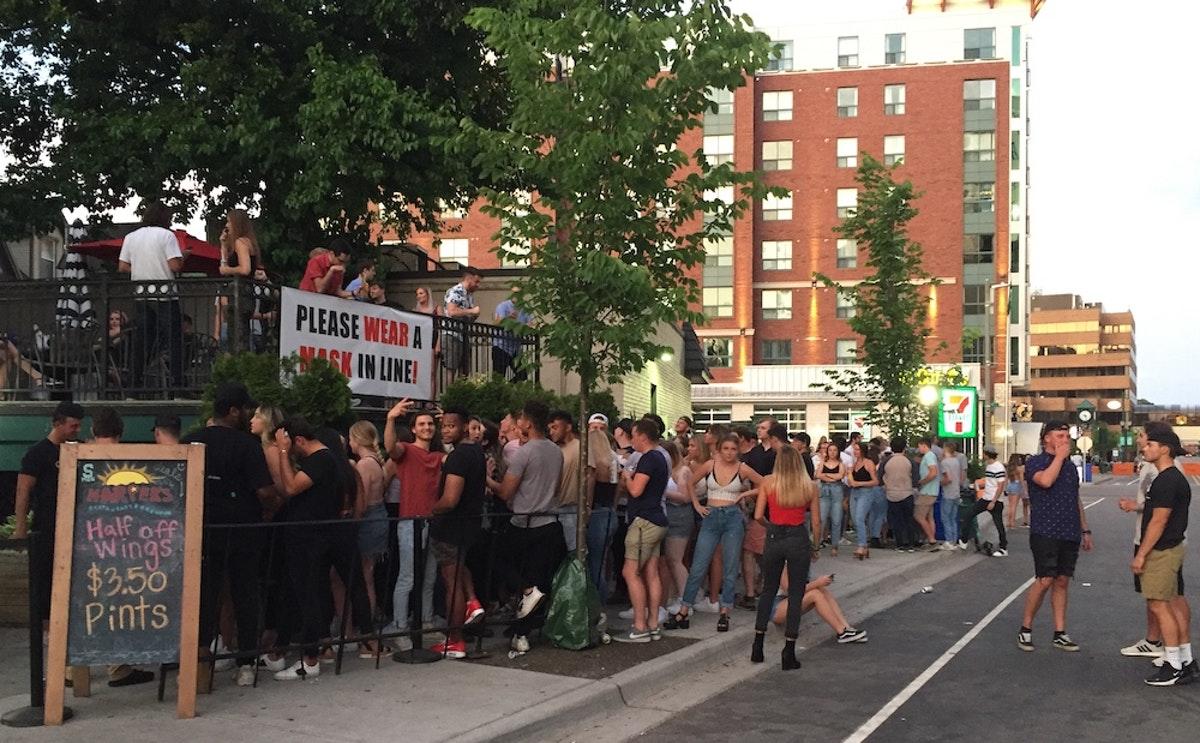
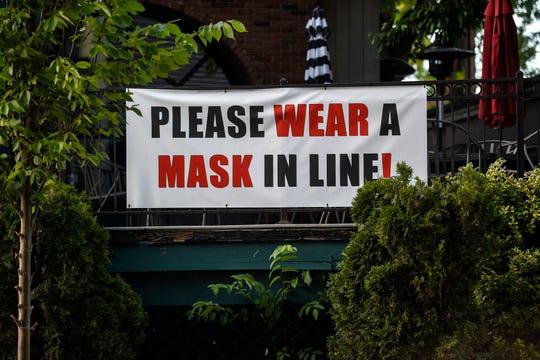
Since neither contact tracing nor a vaccine is likely to save high-risk Texans, the ultimate death toll will depend largely on precautions aimed at protecting them. Gov. Greg Abbott has responded to the new wave of infections, which he says is driven largely by young people who have been getting together for drinks in close proximity, by closing bars. But if young Texans are increasingly disinclined to follow social distancing rules, that step may not accomplish much. They can still get together in private, and their risk of exposure will in any case be higher as they return to work. Nor can those people, whose own risk of dying from COVID-19 is very low, necessarily be counted on to avoid contact with Texans who are much more vulnerable to the disease.
The onus for preventing contact between potential carriers and high-risk individuals seems to be shifting, fairly or not, from the first group to the second. Minimizing COVID-19 deaths will require adapting to that reality.
from Latest – Reason.com https://ift.tt/3dC8kzH
via IFTTT


