BofA: Here Comes The Recession Panic

As we await for Goldman to throw in the towel and admit its forecast of one rate hike in 2020 (and no cuts in 2019), was overly… optimistic, moments ago Barclays had a “hold my beer” moment, and just hours after JPMorgan changed its forecast, and as a result of an economic slowdown resulting from the escalating trade war now expects 2 rate cuts in 2019, Barclays has one-upped the largest US bank, and moments ago revised its FOMC forecast, now expecting 3 rate cuts in 2019.

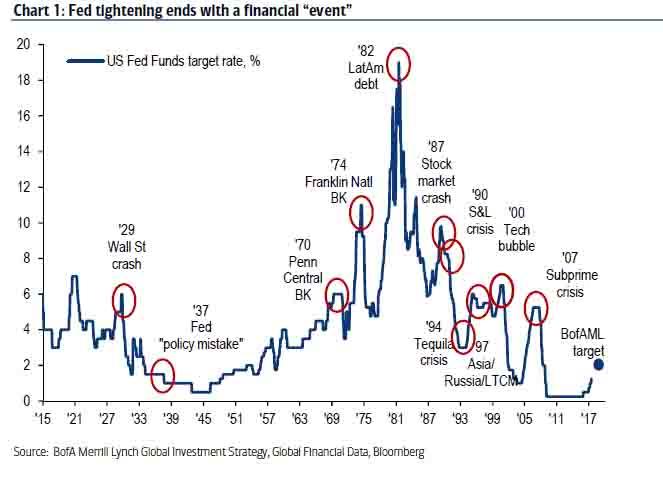
Now, while some may debate whether a curve inversion begins the clock on an upcoming recession, one things is undisputable: while many analysts will caution that it is the Fed’s rate hikes that ultimately catalyze the next recession and that every Fed tightening ends with a financial “event”, the truth is that there is one step missing from this analysis, and it may come as a surprise to many that the last three recessions all took place with 3 months of the first rate cut after a hiking cycle!

In other words, if JPM and Barclays are right, the US economy will enter a recession some time around January 2020.

It is this historic inflection point that Wall Street and traders will be focusing on, because after what now appears set to be the longest economic expansion in history starting at midnight tonight, the recession now appears inevitable. Although don’t assume for a minute that Wall Street won’t fight tooth and nail to delay this admission.

Case in point, as BofA’s Michael Hartnett writes, in the next few days we have a barrage of data which will prompt a “recession panic”, including last night’s dismal China manufacturing PMI <49, next week's US ISM new orders (watch for a <50 print) and the June 7 payrolls report (flashing alert if NFP is <100k). However, as Hartnett writes, while the data would likely initially cause markets to gap lower, they would then stabilize in anticipation of policy response; while if data better-than-expected, yields could rise & bearish positioning would allow risk assets to bounce in June.

That may be optimistic, because if Pimco’s unprecedented warning that the Fed is about to lose control of markets, going forward bad news will no longer be bad news. Instead they will be terrible news, and a coming recession would have devastating consequences on the market and global economy.

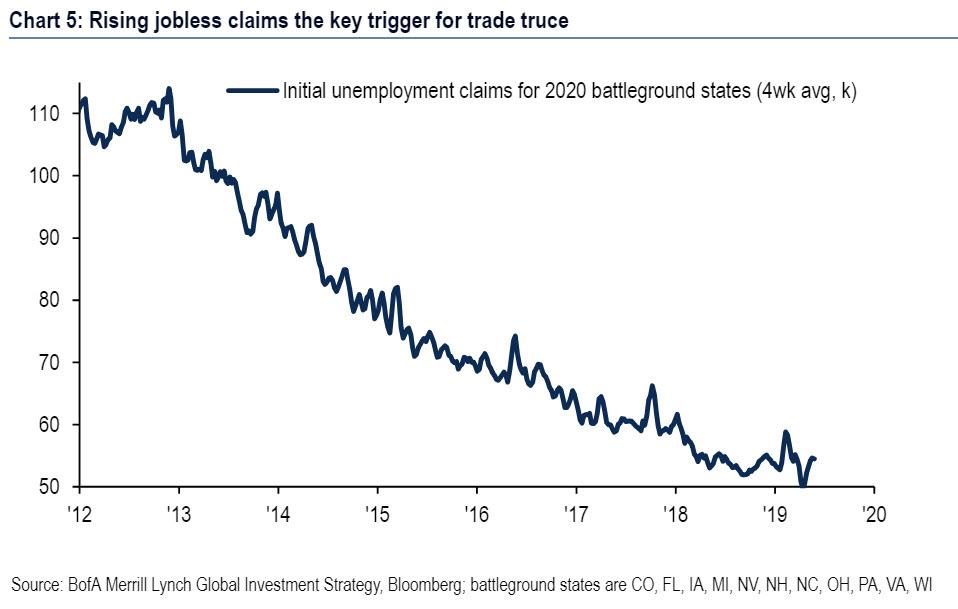
That said, there is one potential way to short-circuit the process. As Hartnett claims, the 8.3% SAAR plunge in exports over the past 6 months will soon negatively impacts jobs, and BofA expects a quick trade resolution as Trump folds as since the last election initial unemployment claims in 11 most important battleground states are down from 66k to 49k (week of Apr 13th); but since then are up to 54k, “indicating job losses in key “swing states”; further rise >60k could cause White House policy panic.”

Whether or not both Trump and the Fed fold, as BofA expects, stabilizing the market and preventing a contraction in the economy, has yet to be seen. However, in what is a note from BofA that will be very useful in the coming months, the bank writes that with recession concerns again on the rise, it is updating its recession FAQ guidebook with the bank’s latest views.

And while the bank writes that its “analysis continues to suggest that near-term recession risks are limited but some financial indicators are flashing red” and that “the trade war is the clear risk to the outlook. Slowing global growth and low potential growth increases the vulnerabilities.”

Here are the rhetorical Q and A’s from the BofA report:

Q: What do recession models say?

Recession risk still contained

In February, we introduced a composite recession model to consolidate signals from both economic and financial market data. Here we provide an update to our model.

  • Risks of a recession over the next 12-months remain contained. The latest reading of our model shows a 19.5% chance of a recession occurring within the next 12 months (Chart 1). Looking at the history of the model, we identify 30% as the threshold where we become concerned of an impending recession. To evaluate the signal of the inputs of our model we take z-scores of each. A higher z-score suggests that the indicator is showing a greater risk of a recession and is represented by a darker shade of red in Table 1.
  • Some concerning signs in financial data. Although the aggregate measure from our model sends a relatively sanguine signal, there are some areas of financial markets that are more worrisome. In particular, the slope of the yield curve continues to send a fairly strong warning. However, as we have noted in the past, there are reasons to discount the signal from the yield-curve despite its proven track-record. Additionally, despite the inverted yield curve, other financial market signals are not flashing red yet.
  • Economic data continue to say “no” to recessions.  Economic data, although much more of a coincident indicator than financial data, continue to show an economy that is on solid footing. The Philadelphia Fed manufacturing index has recovered after a brief turn negative in February and labor market data continues to signal an economy that has more room to run.

Bottom line: Despite some worrying signals to start the year, both financial and economic data continue to suggest that near-term recession risks are not yet elevated. However, our model likely does not fully capture the threat of US-China trade tensions spiraling into a more severe trade war, which we view as the biggest downside risk for the US economy.

Q: What are the data to watch?

The Business Cycle Dating Committee from the National Bureau of Economic Research officially calls peaks and troughs of business cycles. However, the Committee waits until there is sufficient data available to call turns in the business cycle, meaning it is many months after a peak or a trough for the referees to make an official ruling on the economy. Financial markets don’t have the luxury of time.

To get a sense of how the NBER may rule on the business cycle in the future, we look to the past. We apply a Markov switching model-a popular nonlinear framework to characterize asymmetrical signals like expansions and recessions- to all major economic indicators in the US. The model gives us two bits of information: 1) we can see which economic indicators most accurately follow the NBER’s recession dating, allowing us to monitor the most relevant indicators. 2) The latest reading of the Markov switching model gives us a real time assessment of the business cycle (i.e. a “nowcast” probability of a recession, similar to the St. Louis Fed recession probability measure(*)). Here is what we find:

  • Watch labor markets and factories: The top 5 economic indicators that track the NBER’s recession dating are initial jobless claims, auto sales, industrial production, Philly Fed index, and aggregate hours worked. This is consistent with NBER’s definition of a recession: “a significant decline in economic activity spread across the economy, lasting more than a few months, normally visible in real GDP, real income, employment, industrial production, and wholesale-retail sales.”
  • Look for the data to rollover: These top 5 economic indicators usually deteriorate heading into recessions. In the last seven recessions, the 6-mo growth rate of initial claims have, on average, jumped double digits while the 6-mo growth rate of auto sales declined. The level of the Philly Fed index is usually near or in negative territory and the 6-mo growth rates of industry production and aggregate hours have generally fallen below trend.
  • Currently flashing green: What are the data telling us about today? There’s little sign that we are headed into an imminent downturn. With the exception of auto sales, these measures are well off their levels seen at the start of prior recessions (Table 2). Initial jobless claims are worth close scrutiny when looking for recession risks because it is timely and released weekly. Currently, growth of initial claims is subdued and starting to reverse (Chart 2).

Q: What does big data tell us about this cycle?

Last year we took a big-data view of the business cycle. Specifically, we applied a machine-learning algorithm to more than 55 years of monthly data spanning over 120 variables in order to identify the phases of the cycle. Recently we updated our work.

  • Does 2019 look like 2016? Yes and no. The algorithm identifies three phases of the business cycle: economic booms, soft patches and recessions. We find that the economy is still stuck in the soft patch that started at the beginning of the current expansion. However, the data have deteriorated in recent months, moving further away from the “boom” phase of the cycle and closer to the “recession” phase.

Chart 3 shows that in terms of where we are in the cycle, February 2019 looks a lot like February 2016. There are distinct differences in the drivers, however. Today, equity-market variables are stronger and indicators related to money and credit are weaker. According to our classification though, in terms of the overall state of the economy these differences almost perfectly net out.

  • Boring isn’t always bad. The 2016 slowdown did not lead to a recession and our work does not point to an imminent recession this time either. We tweak our approach by running the algorithm on a shorter sample that excludes older boom-bust cycles. This helps pick up smaller variations in recent cycles. Specifically, with a shorter sample we find that the current expansion saw a brief boom period in 2017-18, when the US economy benefited first from the synchronized pickup in global growth and then from tax cuts. Although we would not rule out another brief boom period in the spring, the cycle is probably past its peak (Chart 4).

But there is good news as well. While much has been written about the weakness of the ongoing recovery, our work suggests it has actually been very durable. The data in past cycles mostly flip-flop between the boom and downturn clusters. Yet not even one of the 116 months in this expansion falls into our algorithm’s downturn cluster. In this sense it might be more appropriate to refer to this cycle as “flat” rather than “weak.” This is one reason why we expect a soft landing back to trend-like growth rather than a recession in the medium term. In other words, we are likely back in a “no boom, no bust” paradigm, which is supportive for carry trades.

Q: How do consumers feel?

Consumer demand is the key driver of the US economy, making up 70% of real GDP. As such, consumer confidence is an important indicator to watch when looking for cracks in the economy. Consumer confidence usually deteriorates during downturns. Here we take a look at where things stand:

  • Consumer sentiment is at cyclical highs: Confidence deteriorated at the turn of the year due to the equity market selloff and the federal government shutdown. Since then confidence has creeped back higher with both the Conference Board’s consumer confidence and the University of Michigan’s consumer sentiment indexes only a several points below their cyclical highs (Chart 5).
  • Consumers see a strong job market: Labor market conditions remain tight, according to the worker. The labor market differential index (the % of respondents reporting that jobs are plentiful less % of respondents reporting that jobs are hard to find) from the Conference Board is at 36.3 in the latest reading, reaching a cyclical high (Chart 6). Indeed, the latest JOLTS data show there are more job openings than unemployed workers.
  • Expectations are still strong: Concerns around a downturn remain subdued. The mean probability of the unemployment rate being higher in one year tracked higher in December and January but has receded since likely due to the recovery in financial markets and solid job numbers in recent months. Similarly, percent of respondents who think their financial situation will be worse off one year from now remain at low levels (Chart 7 & Chart 8).

Q: What about global factors?

The two major global risks facing the US economy right now are the US-China trade war and the (related) slowdown in global growth.

  • Trade tensions rising. The latest round of tariffs between the US and China was a major escalation. Our base case is that there will be further brinkmanship for a few more weeks, followed by a deal that walks back some of the measures currently in place. In this scenario, which is baked into our GDP forecasts, we expect only a muted impact on US growth due to slightly-weaker consumption, investment and exports (because of retaliatory tariffs). One reason we do not see a big impact on the US economy is that FX moves will likely mitigate the impact on import prices: as Chart 9 shows, periods of trade war escalation have been accompanied by a much weaker renminbi.

However the risks to our outlook are skewed firmly to the downside. If the US imposes 25% tariffs on all remaining Chinese goods, we would find ourselves in a full-blown trade war. In this scenario real domestic demand would slow significantly as higher tariffs cut into the purchasing power of the consumer. Elevated uncertainty would weigh on business investment and the Chinese retaliation would likely deal a huge blow to US exports. Tightening of financial conditions would amplify the shock. This would leave the economy much more likely to fall into a recession.

  • Broad-based global growth slowdown. While the US economy has remained relatively robust, many other major economies have slowed; some for reasons unrelated to the trade war. We expect ex-US global growth to fall from 4.0% last year to 3.5% in 2019. Assuming there is no further trade-war escalation, will the US import a recession? Probably not. Compared to other large economies the US has limited exposure to global demand (Chart 10). Recent undulations in the global backdrop, from the soft patch of 2015-16 to the coordinated pickup in 2017, suggest that a slowdown in demand for US exports would not be large enough to cause a recession.

That said, a global slowdown could also weigh on US growth indirectly via a weakening in financial conditions and business confidence. This channel is perhaps more concerning, particularly since risk-off sentiment usually strengthens the dollar and thus amplifies any weakness in external demand. This indirect effect is harder to quantify, although history still suggests a recession is unlikely.

Q: What can we learn from the profits cycle?

We can look at corporate profits and equity markets for signals of building excesses or a turning point in the economy.

  • In previous work, we noted that corporate profits are a reliable leading indicator as they tend to peak prior to that of GDP by an average of four quarters during expansions dating back to 1953. We show a log-level time series in order to gain the historical comparison (Chart 11). However, they are not the best predictor of a coming recession as a simple probit model that uses the two-quarter change in profits to predict recessions yields several false positives (Chart 12).
  • Our equity strategists note that the share of non-earners in the Russell 2000 has continued to climb and remains at levels typically only seen during or prior to a recession (Chart 13). Additionally, the latest reading of their regime indicator-an aggregation of earnings, economic growth expectations, inflation, credit conditions and other variables-has crossed into the “recession” or “downturn” phase (Chart 14). However, this indicator has often entered the “downturn” phase outside of economic recessions. We therefore think it is consistent with a slowing in the economy where there are increased vulnerabilities, as we are forecasting.

Q: Should we pay attention to housing?

Buying a home is one of the biggest investment decisions a consumer can make and is highly sensitive to interest rates and the overall business cycle. As we learned during the financial crisis, housing can be a crippling source of economic pain and instability. Will history repeat in the current cycle? Can we once again look to housing as a harbinger of imminent doom and gloom? We don’t think so. In our view, housing is unlikely to be front and center in the next downturn.

  • A laggard this cycle: Housing was slow to turn and has been slow to pick up. Residential investment’s share of GDP remains subdued, as is the pace of housing starts, suggesting little sign of excess in housing-related real activity (Chart 15). In fact, the data suggest the pendulum has swung into a housing shortage.
  • Households have deleveraged: Households have reduced the amount of mortgage debt (as a share of disposable income) in the system (Chart 16). Low rates have also led to historically low debt service ratios (Chart 17). It is unlikely that leverage picks up meaningfully given that purchase mortgage demand will be constrained by lean housing supply and turnover, as well as tighter lending standards post crisis.
  • Less dependent on housing wealth: The housing wealth effect has diminished over time as households have become more reluctant to spend from rising home valuations (Chart 18). Consistent with this, outstanding home equity lines of credit (HELOC) have declined over time. If home prices weaken going forward, the effect on consumption should be muted.

Q: Which sectors are vulnerable?

There are growing concerns that higher borrowing costs will impair those who are most highly indebted. Therefore, we take a look at leverage measures for the household, corporate and government sectors for signs of concern (Chart 19).

  • Household. The good news is that household balance sheets are very healthy. Household outstanding debt as a % of total GDP has been on a downward shift since the beginning of the expansion and is currently at around 75% compared with the 2008 peak level of 98%. Additionally, both the household debt service ratio and financial obligation ratio are near historically low levels.
  • Corporate. The corporate sector shows mixed signals. On one hand, the nonfinancial business debt to GDP ratio is currently well above its historical average amid the favorable interest rate environment. Across loan types, non-bank lending saw the biggest increase (Chart 20). On the other hand, there is evidence that corporates are well positioned for shocks. For example, as the US Treasury pointed out in their Financial Stability report, improvements in earnings during the past few years have allowed firms to enhance their ratio of cash to assets.
  • Government. Contrary to household debt, government debt has increased significantly during the current expansion, to around 100% of GDP compared with just around 79% in 2009. Although high level of government debt alone is unlikely to trigger a recession, its long term impact on crowding out private investment and increasing interest rates can create headwinds for growth. It also may imply that there is less capacity for countercyclical policy support once the recession hits.

Q: How do recessions usually start?

Expansions don’t die of old age; rather they die from excesses that lead to economic shocks such as:

  • Overheating in cyclical sectors of the economy which can manifest itself in an asset bubble. Two recent examples are the credit/housing bubble and the dot-com boom which were major factors in the two most recent recessions. As Chart 21 shows, residential investment is still below the historical average as a share of the economy, showing no sign of concern. Nonresidential investment is near levels seen prior to the Great Recession, which could be an area of concern. Similarly the cyclically adjusted PE ratio is elevated but not at the 2001 peak levels (Chart 22).
  • Commodity price shocks. Oil prices have spiked prior to most of the recessions dating back to the 1980s (Chart 23). This was even the case for the Great Recession which might not have been as dire absent the oil price shock (Hamilton 2008). Following President Trump’s decision to remove the Iran oil waivers, there is a greater risk for an upward shock to oil prices in the near-term. That said, an increase in oil prices this time around may not be as damaging as the US has become a much bigger producer of oil and, in turn, less reliant on crude oil imports.
  • Monetary policy mistakes. In previous expansions, the Fed has acted aggressively to fight inflation by quickly tightening policy which has often been followed by a recession. Today, the Fed seems set on holding pat at neutral (Chart 24).

Q: Is this recovery too long?

Here, we take a close look at the current business cycle and some of its characteristics. Specifically, the current expansion is the second longest in history. However, the pace of recovery has been particularly weak compared with prior cycles with annual GDP growth averaging 2.3%.

  • Lengthy recovery. The current recovery has been 119 months long, the second longest in history and only behind the 1991-2001 cycle which lasted 120 months (Chart 25). We are on track to reach a new record in July 2019.
  • Weak recovery. Despite the length of recovery, the level of growth has been weak for the current cycle (Chart 26). Real GDP growth has only averaged around 2.3% for the current expansion, compared with 2.9% for the last expansion and 3.6% for the 1991-2001 expansion. As a result, the output gap was closed at a much later stage in this cycle (Chart 27).
  • Government spending is partially to blame. Government spending, which accounts for almost one fifth of GDP, has shrunk by roughly 0.4pp as a share of GDP per year since 2Q 2009 due to fiscal austerity measures implemented during the recovery, consequently dragging down overall growth. This contrasts with other recoveries where government spending was a notable contributor.

via ZeroHedge News http://bit.ly/30ZzQSM Tyler Durden

New Car Crash Study Highlights the Irrationality of DUI Laws Based on THC in Drivers’ Blood

A new study of Canadian drivers who were injured in car crashes shows once again how difficult it is to measure marijuana’s impact on road safety and how misguided it is to use THC blood levels as a legal standard for impairment. The study, reported in the journal Addiction, found no statistically significant relationship between testing positive for THC and driving that contributes to accidents.

The researchers, led by Vancouver emergency physician Jeff Brubacher, looked at crashes in British Columbia that injured about 3,000 drivers whose blood was tested for marijuana, alcohol, and other drugs. They used police reports, which were available in about 2,300 cases, to determine which drivers bore responsibility for the accidents.

Among drivers with THC blood concentrations of less than five nanograms per milliliter, they report, “there was no increased risk of crash responsibility.” Drivers above that threshold were 74 percent more likely to be responsible for crashes than drivers who did not test positive for potentially impairing substances, but the difference was not statistically significant.

By contrast, drivers with blood alcohol concentrations of 0.08 percent or more—the current cutoff for driving under the influence (DUI) in almost every U.S. state—were six times as likely (i.e., 500 percent more likely) to be deemed responsible. The additional risk was 82 percent and 45 percent, respectively, for recreational drugs other than marijuana and for sedating medications such as Benadryl or Xanax. All those differences were statistically significant.

These findings, Brubacher et al., conclude, “suggest that the impact of cannabis on road safety is relatively small at present time.” They caution that the results might have been different if they had looked at fatal crashes and that the picture could change if marijuana legalization in Canada leads to a substantial increase in stoned driving.

Two important factors help explain the failure to find a statistically significant crash risk associated with cannabis consumption.

First, marijuana’s impact on driving ability, as measured in laboratory studies, is much less dramatic than alcohol’s. In fact, as a recent report from the Congressional Research Service (CRS) notes, “Levels of impairment that can be identified in laboratory settings may not have a significant impact in real world settings, where many variables affect the likelihood of a crash occurring.”

Second, people can test positive for THC, even above the five-nanogram level that several states have incorporated into their DUI laws, when they are not impaired. “The body can store THC in fat cells, so that traces of THC can be found up to several weeks after consumption,” the CRS report notes. Yet in laboratory studies, the impairment caused by smoking marijuana can no longer be detected after two or three hours.

The implication is that it makes no sense to assume that drivers who test positive for THC are impaired. Yet that is what 18 states, including several that have legalized marijuana, continue to do.

As the CRS report notes, a dozen states—including Michigan, which legalized marijuana last year—have “zero tolerance” laws that treat any amount of THC as conclusive DUI evidence. Nine of those states go even further, making people automatically guilty of DUI when inactive THC metabolites can be detected in their blood.

Five states—including Michigan, Nevada, and Washington, where marijuana is legal, and Illinois, where it probably will be soon—define DUI based on a specified THC blood level, ranging from one to five nanograms per milliliter. Colorado, another state that has legalized marijuana, allows juries to infer impairment based on a blood test showing five or more nanograms per milliliter, although defendants can argue that they were not actually impaired.

“There is as yet no scientifically demonstrated correlation between levels of THC and degrees of impairment,” the CRS report notes. “Tests that show the amount of THC in the subject’s body are poor indicators of impairment, how recently a person has used marijuana, or whether the person used marijuana or was simply exposed to second-hand smoke. Moreover, tests can show the presence of metabolites of THC, which themselves are not impairing, for weeks after consumption. Also, studies indicate that individuals can adapt to the impairing effects of marijuana, such that a level of THC that could indicate impairment in an occasional marijuana user may not have the same impairment effect on an experienced user.”

In short, it is plainly unscientific and unjust to convict people of DUI based on nothing more than THC (or, even worse, THC metabolites) in their blood. States that continue to take this approach even after legalizing marijuana are in effect telling regular cannabis consumers they can never legally drive.

What’s the alternative? I consider that question in my recent feature story about marijuana-impaired driving.

from Latest – Reason.com http://bit.ly/2IcNfy5
via IFTTT

Illinois Passes Constitutional Amendment to Allow a Progressive Income Tax

Voters in Illinois will have a chance to raise taxes next year. Indeed, they’ll be able to fundamentally alter the state’s tax code.

Before Monday, the state constitution prevented the government from taxing different levels of income at different rates. But on Monday, the Illinois House of Representatives amended the document to allow a progressive income tax. Voters will choose whether to implement such a tax in 2020.

This tax increase would come on the heels of major state tax hikes in 2017, when the legislature raised income taxes from 3.75 percent to 4.95 percent and corporate income taxes from 5.25 percent to 7 percent.

The proposal on the ballot would replace the existing single 4.95 percent rate with a six-bracket progressive income tax. Gov. J.B. Pritzker’s plan would raise taxes on income over $250,000 to 7.75 percent, income over $500,000 to 7.85 percent, and income over $1 million to 7.95 percent. People at the bottom of the income scale would receive a small tax cut: The first $10,000 in income someone earns would be taxed at a 4.75 percent rate instead 4.95, and income between $10,000 and $100,000 would be taxed at a 4.9 percent rate.

The simple, flat personal income tax of 4.95 percent has remained a rare bright spot of Illinois’ tax code. The Tax Foundation, a nonpartisan tax policy think tank, has ranked the state’s personal income tax the 13th most competitive in the country; Illinois’s tax code generally is ranked 36th.

The tax’s supporters argue that it will address Illinois’ budget shortfall of $3.4 billion in fiscal year 2021, stabilizing a jurisdiction that the libertarian-leaning Mercatus Center has ranked the least fiscally healthy state in the nation. But the Illinois Policy Institute, a free market think tank, argues that the Pritzker administration has overestimated the revenue the tax would raise. Even if the higher tax rates do not slow down economic growth, IRS data indicate that the tax would raise roughly $2.4 billion, not the $3.4 billion promised. 

Another defense of the law points out that it will not raise taxes for the 97 percent of taxpayers that make less than $250,000. Yet given the size of Illinois’ long-term fiscal problems, a progressive tax system could mean future tax increases on the middle class once the rich have been soaked.

Another concern is that high-income earners will respond by leaving the state, a phenomenon known as tax flight. Advocates of tax increases have proclaimed that tax flight is a myth, citing a study by the Stanford sociologist Cristobal Young that found a 10 percent increase in the tax rate would produce an exodus of 1 percent of millionaires. Young’s work doesn’t debunk the concept of tax flight so much as suggest it’s a fairly marginal phenomenon with few implications for public policy.

But more recent research suggests otherwise. A National Bureau of Economic Research study published in April found that high-income individuals’ migratory responses to high taxes can be quite high, depending on the proximity of lower-tax jurisdictions, individuals’ roles in the labor market, and the level of human capital. Given Illinois’ location, that means tax flight could be a real concern. Many of the states surrounding Illinois have enacted significant tax reforms recently. Missouri lowered its corporate and top individual taxes last year, as did Kentucky and Iowa, while Indiana’s tax code is already among the most competitive in the country.

And it would be a mistake to focus on millionaire out-migration alone. The personal income tax isn’t just paid by rich individuals—it’s also a tax on businesses whose profits are passed through to their owners’ individual tax returns. Pass-through businesses employ over 57 percent of private sector workers in Illinois. The state already suffers from slow private-sector job growth, and layering on an additional major tax won’t help.  

The elephant in the room is Illinois’ fiscal crisis. This is mainly driven by pensions, which take up over a quarter of state government spending and are projected to rise to more than half of state revenue over the next 30 years. As Illinois Policy Institute budget and tax research director Adam Schuster says, “the only path towards prosperity in this state is to reform the state’s largest cost drivers, not dive further into taxpayers’ wallets.” While a tax increase might plug the fiscal hole for a few years, pension costs will continue to grow.

from Latest – Reason.com http://bit.ly/2WgYlfk
via IFTTT

Jim Grant: Who’s Buying All The Sub-Zero Debt?

Excerpted from Jim Grant’s Barron’s op-ed: “The World Created By Upside-Down Interest Rates”,

The quoted value of negative-yielding debt the world over hit $11 trillion the other day, the highest such total since September 2016 and almost double the volume in place last October.

These are remarkable facts. You can as easily imagine a five-pawed St. Bernard or a suitable candidate for public office as you can the situation of a lender paying a borrower for the privilege of extending a loan.

The institution of negative yields serves to remind us that radical monetary policy only begets more radical monetary policy.

But the central bankers misjudged the human animal. Confronted with a novelty unprecedented in 4,000 years of interest-rate history (negative money-market interest rates are nothing new, but substantially negative note and bond yields are a post-2000 B.C. first), people not unreasonably suspected that something was wrong. And when something is wrong, you save more, not less.

Five years into the negative rate experiment, and a decade on in radical monetary improvisation, the central bankers are looking for a way back to normalcy…

But as Grant asks and answers: Do you wonder who’s buying all of the subzero debt?

Peter Chiappinelli, a portfolio strategist at GMO, Boston, says he has given it considerable thought. In a sense, the buyer is the aforementioned Global Agg index, though the index hardly buys itself.

The mystery buyer, Chiappinelli says he has come to see, “is anybody who owns a passive mutual fund tied to the Global Agg. Or anyone who might now own a passive ETF tied to a global bond index. Or anyone who owns a popular target-date fund that has passive exposure to global bond indexes. In other words, millions of Americans.

Ten-year Treasurys may not yield much, but they deliver something like 240 basis points more than nothing. For that matter, gold bullion, yielding only nothing, nonetheless yields more than $10.6 trillion of notes and bonds that yield less than nothing. It’s all about relative value.

Read more here…

via ZeroHedge News http://bit.ly/2Z2Sfwd Tyler Durden

Why The Creator Of The Bond Volatility Index Believes “This Will End In Tears”

The legendary creator of the MOVE bond volatility index and the iconic Merrill Lynch RateLab, Harley Bassman, has opined on the biggest inversion in the yield curve since the financial crisis (3M-10Y dipped as low as -22.5bps this morning), and his view is hardly favorable.

As Bassman notes in his latest note “Can you hear me Knocking”, he reminds his readers that in his February 6, 2019 commentary titled “Wall Street Jenga”, he noted that “December’s initial Yield Curve inversion flashed a signal for a market or economic disruption in Q2-2020 (Eighteen months ahead).” Fast forward to today when he cautions that “this week, these two rates finally inverted.” And in response to those “best and brightest who are bleating how “it is different this time”, Bassman has a one-word answer: “Puff!

But before being accused of becoming the “next headline seeking pundit calling for a crash” he explains that he is “just saying that important risk vectors are now in disequilibrium, and these cannot be excused by QE, Trump, or the proximity of MMT.

Additionally unlike skeptics who believe they know the next surprise will germinate; Bassman declines such as task as “such is the definition of a surprise.That said, well-heeled investment professionals are effectively willing to purchase five-year bonds to be issued in 2024 (five years hence) at a rate below today’s risk-free overnight rate.”

This, as he further notes, is “different than a low print on the VIX, which is a derivative of a derivative; these are two of the most heavily trafficked interest rates in the unfettered US Dollar market.”

As such, he adds, “unless this was a ‘quick kiss’ during the holiday shortened Hamptons summer kick-off, I am starting to prepare for a macro-political or -economic disturbance.

In short, one of the most respected men in financial analysis is bracing for chaos.

So what is he doing?

First, he urges readers “let’s keep out heads clear, it is not time to panic.” That said…

I am not explicitly reducing risk exposure, per se, rather I am adjusting the manner in which I touch it. I am covering (embedded) out-of-the-money option shorts and seeking ways to be long convexity–unbalanced risk in my favor.

What this means in English is that he is covering OTM puts, and instead of buying stocks – in case trade war gets resolved – he is buying some S&P calls with a 3,000 breakeven, noting that “yes, I will miss a small rally; but if the trade war is resolved I will participate in a break out to new highs.”

Bassman is also making levered investments on mid-grade Credit/MBS/Muni Closed-end Funds and Mortgage REITs, which have “taken a beating from the Yield Curve flattening…. Notice that many Muni CEFs trade at a 10% discount to NAVand some REIT’s trade at a discount to Book Value.” His argument for this trade is that if the curve signal is real, the Fed will cut rates next year (or even this year if JPMorgan is right, twice) and will jump the dividend payout. If he is wrong, he can lick his wounds while clipping a 9% coupon.

His proposed trade recos aside, if Bassman is right and there is indeed a full-blown “disruption” next year, this is what he would guess :

  1. It will not be Brexit or international Trade, these risks are too well trafficked to offer a surprise.  The markets may move to adjust, but likely not too abruptly.
  2. Enacting an ill-conceived immigration policy that substantially reduces the Labor Force Growth rate; however, this is a slow poison, not a quick-shot.
  3. The most unlikely, so clearly the most surprising, would be if the US Senate swings to the Democrats. If you want a truth stranger than fiction, imagine the President is re-elected but has to manage a unified Democratic congress.

In conclusion, Bassman has a simple warning that has become his mantra: “it’s never different this time“, because…

A P/E of 100 on the Nikkei in 1989 or the NASDAQ in 2000. No-doc 105% LTV home loans in 2006.  Pigs can fly if shot out of a large enough cannon; until they come down to earth as bacon.

His parting words take him full circle to the inversion in the product that made him a market legind: “I don’t know how or when it will resolve, but the Yield Curve has inverted in a half-dozen places, and eventually this ends in tears.”

* * *

For those wanting more, his full note is below.

“Can You Hear Me Knocking”, A commentary by Harley Bassman

A devout man was alone in his home when the flood warnings arrived. A police car drove up with an offer to take the man to a dry shelter; he declined saying that G-d would save him.

Soon the waters rose, and he ran up the stairs. Looking out the second story window he saw a Coast Guard skiff pull up with the offer to take him to an upstream dock; he declined saying that G-d would save him.

With the waters cresting, the man climbed to the roof of his house. Wet to his waist, a Navy helicopter hovered overhead dangling a rope and the airman yelled at him to grab a hold; he declined saying that G-d would save him.

The man drowns and was soon elevated to heaven. Upon meeting G-d he asked why such a devout man as he was not saved? G-d replied: I sent you a car, a boat, and a helicopter – wasn’t that enough?

My January 29, 2018 commentary titled “It’s Never Different This Time” highlighted that the projected reduction in G-7 Central Bank balance sheets in Q1-2019 should be a concern since the infusion of liquidity seemed to be well correlated to calming and elevating financial markets.

A year later, in my February 6, 2019 commentary titled “Wall Street Jenga”, I noted that December’s initial Yield Curve inversion flashed a signal for a market or economic disruption in Q2-2020 (Eighteen months ahead).

I also offered a special notice that I was keeping an eye on the spread between the Federal Funds rate and the  5-year forward 5-year swap rate (5yr-5yr). While there are many Yield Curve combinations, I like this one since the 5yr-5yr rate is a bit more insightful than the spot Curve and is also a half-step removed from the impact of Quantitative  Easing/ Tightening (QE/QT).

This week, these two rates finally inverted on a closing basis.

The best and the brightest are bleating how “it is different this time”: Puff !

I will state for the record that the basic human impulses of Fear, Greed, and Ego (Hubris) have not changed too much since (wo)mankind resided in caves. Moreover, I will NOT be the next headline seeking pundit calling for a crash; rather I am just saying that important risk vectors are now in disequilibrium, and these cannot be excused by QE, Trump, or the proximity of MMT.

Let’s keep our heads clear, it is not time to panic. The S&P 500 is not rich; rather it is on the high side of fair relative to interest rates. Additionally, low Sovereign rates in conjunction with the demographic demand for coupon (retired Boomers need income) will allow most maturing debt to be rolled over. Truth be told, I cannot point to where the surprise will germinate; such is the definition of a surprise.

That said, well-heeled investment professionals are effectively willing to purchase five-year bonds to be issued in 2024 (five years hence) at a rate below today’s risk-free overnight rate. This is different than a low print on the VIX, which is  a derivative of a derivative; these are two of the most heavily trafficked interest rates in the unfettered US Dollar market.

Unless this was a ‘quick kiss’ during the holiday shortened Hamptons summer kick-off, I am starting to prepare for a macro-political or -economic disturbance.

What am I doing ?

I am not explicitly reducing risk exposure, per se, rather I am adjusting the manner in which I touch it. I am covering (embedded) out-of-the-money option shorts and seeking ways to be long convexity – unbalanced risk in my favor. Volatility is still relatively cheap; a six-month out-of-the-money call option on SPY has an Implied Volatility of about 13%. So instead of being outright long equities, I might buy the K = 295 call at ~5 points with a break-even of 300 (SPX = 3000). Yes, I will miss a small rally; but if the trade war is resolved I will participate in a break out to new highs.

I love mid-grade Credit/MBS/Muni Closed-end Funds and Mortgage REITs.

These assets have taken a beating from the Yield Curve flattening. There may still be some dividend trims as cheap legacy funding debt is renewed at higher rates, but that is already priced in. Notice that many Muni CEFs trade at a 10% discount to NAV and some REIT’s trade at a discount to Book Value. If the Curve signal is real, FED rate cuts next year will jump the dividend payout. And if I am wrong, well, I can lick my wounds while clipping a 9% coupon. To be clear, this is a levered investment; but it is linear, not convex risk.

For the professionals, I am still long the five-year Yield Curve option I recommended in “Catch a Wave” – June 27, 2018. These options now cost a bit more, but not enough to skip this ticket. This option cannot be re-created by a combination of vanilla options, and it has a terrific Vega-kicker since Volatility will increase significantly when the Yield Curve steepens.

As noted, by definition a surprise cannot be anticipated; but if the traditional signals ring true and we have a disruption next year, what might I guess ?

1) It will not be Brexit or international Trade, these risks are too well trafficked to offer a surprise. The markets may move to adjust, but likely not too abruptly.

2) Enacting an ill-conceived immigration policy that substantially reduces the Labor Force Growth rate; however, this is a slow poison, not a quick-shot.

3) The most unlikely, so clearly the most surprising, would be if the US Senate swings to the Democrats. If you want a truth stranger than fiction, imagine the President is re-elected but has to manage a unified Democratic congress.

It’s never different this time. A P/E of 100 on the Nikkei in 1989 or the NASDAQ in 2000. No-doc 105% LTV home loans in 2006. Pigs can fly if shot out of a large enough cannon; until they come down to earth as bacon.

I don’t know how or when it will resolve, but the Yield Curve has inverted in a half-dozen places, and eventually this ends in tears.

Are you listening ?

via ZeroHedge News http://bit.ly/2W6YT2G Tyler Durden

Godzilla: King of the Monsters Is a Reminder That Eco-Terrorists Make Effective Movie Villains

Godzilla: King of the Monsters is, on the one hand, a mindless, goofy B-movie about giant lizards fighting each other while humans look on helplessly, and, on the other hand, a mystical ecological parable, in which a band of committed eco-terrorists unchain forces of destruction in order to cleanse the planet of the plague of humanity. It thus poses a question: Who is the real monster—man or megalizard?

The eco-terrorists’ plan is pure nonsense, but it has the virtue of being simple and direct: Release a handful of mountain-sized beasts from the bowels of the planet, then let them stomp around murdering everything and everyone in their path. Monsters + destruction = planet saved. 

The monsters, we come to understand, are actually ancient Titans who serve as “nature’s defense,” which sounds suspiciously like the name of an environmental non-profit. These Titans are tasked with preserving the planet’s integrity. In this case, that appears to mean wiping out much of human civilization. To make a planet-sized omelet, I suppose, you have to break a few billion eggs.

Like so many presidential campaign policy proposals, this preposterous idea is debated with a seriousness and solemnity it doesn’t merit. What about all the people who will die as a result? “The mass extinction has already begun,” explains one proponent of the release-the-monsters strategy, “and we are the cause.” In other words, think of all the people who will die if we don’t set loose the flying fire demon. 

“You’re murdering the world!” cries one of the movie’s pro-human heroes, agog at the deadly havoc the monsters will wreak. Thus, the movie is staged not only as a series of monster-on-monster brawls, but as an ideological battle between the rival factions of “Actually, Mass Murder By Monster Is Objectively Good,” and “Are You Freaking Kidding Me?” In this way, and only this way, the film rather accurately captures the lopsided character of many real-world political debates.

King of the Monsters isn’t a very good movie. The script is filled with clunky dialogue. (“Serizawa got that lizard juiced up!” exclaims Bradley Whitford, in a line that makes exactly as much sense in context.) And like so many modern blockbusters, it’s larded with unconvincing computer-generated effects that would feel more at home in a video game. Finally, it’s disappointing, though understandable, that the film couldn’t be titled Remember the Titans.

But it does offer yet another data point supporting my friend Sonny Bunch’s contention that radical environmentalists make effective movie villains because they want to make life worse for humans, in this case by allowing a bunch of CGI lizards to destroy Boston, Washington, and a host of other cities around the globe. Municipal governance is often frustrating, it’s true, but the presence of a roving troop of skyscraper-sized murder lizards in major world cities, I am fairly certain, counts as worse.

The human culpability in the movie’s urban destruction, however, seems to suggest an answer to the larger question it raises: Are people worse? Or are the giant monsters? As President Obama might have said: That’s a false choice.

from Latest – Reason.com http://bit.ly/2MzTG43
via IFTTT

Godzilla: King of the Monsters Is a Reminder That Eco-Terrorists Make Effective Movie Villains

Godzilla: King of the Monsters is, on the one hand, a mindless, goofy B-movie about giant lizards fighting each other while humans look on helplessly, and, on the other hand, a mystical ecological parable, in which a band of committed eco-terrorists unchain forces of destruction in order to cleanse the planet of the plague of humanity. It thus poses a question: Who is the real monster—man or megalizard?

The eco-terrorists’ plan is pure nonsense, but it has the virtue of being simple and direct: Release a handful of mountain-sized beasts from the bowels of the planet, then let them stomp around murdering everything and everyone in their path. Monsters + destruction = planet saved. 

The monsters, we come to understand, are actually ancient Titans who serve as “nature’s defense,” which sounds suspiciously like the name of an environmental non-profit. These Titans are tasked with preserving the planet’s integrity. In this case, that appears to mean wiping out much of human civilization. To make a planet-sized omelet, I suppose, you have to break a few billion eggs.

Like so many presidential campaign policy proposals, this preposterous idea is debated with a seriousness and solemnity it doesn’t merit. What about all the people who will die as a result? “The mass extinction has already begun,” explains one proponent of the release-the-monsters strategy, “and we are the cause.” In other words, think of all the people who will die if we don’t set loose the flying fire demon. 

“You’re murdering the world!” cries one of the movie’s pro-human heroes, agog at the deadly havoc the monsters will wreak. Thus, the movie is staged not only as a series of monster-on-monster brawls, but as an ideological battle between the forces of “Actually, Mass Murder By Monster Is Objectively Good,” and “Are You Freaking Kidding Me?” In this way, and only this way, the film rather accurately captures the lopsided character of many real-world political debates.

King of the Monsters isn’t a very good movie. The script is filled with clunky dialogue. (“Serizawa got that lizard juiced up!” exclaims Bradley Whitford, in a line that makes exactly as much sense in context.) And like so many modern blockbusters, it’s larded with unconvincing computer-generated effects that would feel more at home in a video game. Finally, it’s disappointing, though understandable, that the film couldn’t be titled Remember the Titans.

But it does offer yet another data point supporting my friend Sonny Bunch’s contention that radical environmentalists make effective movie villains because they want to make life worse for humans, in this case by allowing a bunch of CGI lizards to destroy Boston, Washington, and a host of other cities around the globe. Municipal governance is often frustrating, it’s true, but the presence of a roving troop of skyscraper-sized murder lizards in major world cities, I am fairly certain, counts as worse.

The human culpability in the movie’s urban destruction, however, seems to suggest an answer to the larger question it raises: Are people worse? Or are the giant monsters? As President Obama might have said: That’s a false choice.

from Latest – Reason.com http://bit.ly/2MzTG43
via IFTTT

US Is Dependent On China For Almost 80% Of Its Medicine

Experts are warning that the U.S. has become way too reliant on China for all our medicine, our pain killers, antibiotics, vitamins, aspirin and many cancer treatment medicine.

Fox Business reports that according to FDA estimates at least 80 percent of active ingredients found in all of America’s medicine come from abroad, primarily from China. And it’s not just the ingredients, China wants to become the world’s dominant generic drug maker. So far Chinese companies are making generic for everything from high blood pressure to chemotherapy drugs. 90 percent of America’s prescriptions are for generic drugs.

Rosemary Gibson says that this is all part of China’s plan.

“In five to ten years we are at risk of losing our generic drug industry, because China will use the same playbook and undercut our own producers and drive them out of business,” says Gibson who is author of “China Rx – Exposing the risks of America’s dependence on China for medicine.”

So what would happen if China wants to cut the supply for our medicine or alter its quality.

“Imagine if China turned off that spigot,” said Rosemary Gibson, author of “China RX: The Risks of America’s Dependence on China for Medicine.”

“China’s aim is to become the global pharmacy to the world — it says that. It wants to disrupt, to dominate, and displace American and other Western companies.”

Many medicine used on our troops and veterans can also be sourced to China, reports Fox Business.

Click here for more from Fox Business…

via ZeroHedge News http://bit.ly/2ENLarD Tyler Durden

Mnuchin, Lighthizer Reportedly Opposed Trump’s Mexico Tariffs

This shouldn’t surprise anybody with even a glancing familiarity with the policy-making dynamics in the West Wing, but WSJ and CNBC are reporting that Robert Lighthizer and Steve Mnuchin opposed President Trump’s plan to slap new punitive tariffs on Mexico.

It’s yet another example of Trump overruling senior administration officials on policy issues.

Mnuchin

The senior administration officials feared the tariffs could jeopardize USMCA, the ‘Nafta 2.0’ trade deal that the administration negotiated with Mexico and Canada. But in the end, Trump’s frustration with the border crisis won out.

According to WSJ, Trump’s frustration with the border situation led to the tariffs (though we could have told you that). Since Mexico responded when Trump threatened 25% tariffs and a possible border closure, he felt like giving it another try might produce a similar result.

In recent days the president lost his patience, according to one of the people who spoke about Mr. Lighthizer’s concerns and a senior administration official. He had listened to his advisers for months, who told him not to take action against President Andrés Manuel López Obrador’s new administration while it was forming its government, they said.

“He got tired of waiting for the new government to settle in,” one of the people familiar with the situation said.

“The last time he did tariffs on Mexico, Mexico responded, so he wanted to try again in the context of border security,” the senior administration official said.

There was a meeting with the president’s trade team on Wednesday and again on Thursday, when the president phoned in from Air Force One, according to one of the people.

“In both meetings, the president made very clear that he wants to do this,” one of the people said.

The motivation behind this latest ‘leak’ is pretty transparent: It looks like an effort by Lighthizer’s camp to salvage his ‘working relationship’ with Pelosi.

U.S. officials, including Mr.  Lighthizer, have stressed to Congress the importance of enacting USMCA, meant to replace the North American Free Trade Agreement, in part to show other trading partners that high-pressure talks with Mr. Trump can lead to a win for all sides.

One of the officials noted that Mr. Lighthizer has a particularly good working relationship with House Speaker Nancy Pelosi, and behind closed doors, he has managed to leverage that relationship to make progress in advancing the USMCA through Congress. Some in the administration now fear that the president’s latest move may derail any progress Mr. Lighthizer has made, the people familiar with the situation said.

Goldman said in a note published Friday that it still expects USMCA to pass eventually – though not until after the 2020 election.

via ZeroHedge News http://bit.ly/2ELeVcq Tyler Durden

Elizabeth Warren Goes On Breakfast Club; Gets Slammed As “Original Rachel Dolezal”

Elizabeth Warren’s appearance on popular New York radio show “The Breakfast Club” probably didn’t go as she expected, after the hosts slammed her for lying about being a Native American

Adopting an accent we’ve never heard before, Warren retreated to her talking points, namely that she was told by “muh mama and muh daddy’ that she was a genuine Indian. She then tried to segue – pandering to the audience over what she plans to do for the black community. 

Host ‘Charlamagne tha God’ didn’t let it go, however, asking if Warren’s fake Indian routine benefitted her at all, to which Warren replied: “Boston Globe did a full investigation. It never affected nothin’ about my family, it never affected any job I ever got.” (Fake Native American Adopts Fake Accent, News At 11)

Kinda like the original Rachel Dolezal” shot back Charlamagne, referring to the former NAACP Chapter President for Spokane Washington, who instigated a public uproar when she was exposed for claiming to be African-American, even though she was born to two white parents.

Watch: 

via ZeroHedge News http://bit.ly/2W3Qyww Tyler Durden