Via SchiffGold.com,
Gold looked very strong through mid-November. Recent trends in September and October had been pointing to a breakout. The market delivered sending gold up through $1870. Unfortunately, hard resistance kept the bulls in check, despite repeated attempts to breakthrough. The previous price analysis presumed that a Brainard nomination at the Fed would be the catalyst needed to break through $1880. It also assumed that a Powell nomination, though expected, would bring gold back down some.

Unfortunately, the gold market took the Powell news harder than expected. It dropped like a rock. The announcement occurred prior to market open which is when liquidity is lighter. This caused the price to fall quickly. Newly formed and fragile support was shattered and by the time the market opened, gold was falling quickly. Eventually, it settled back into the $1750-$1800 range where it has been trapped for months.
Late this week, gold made another attempt to break through but failed to hold gains in the face of a rising dollar and closed the week just a shade under $1800 at $1798 (note: official Comex close was $1804). Will gold regain its footing and finally put $1800 in the rearview mirror or will it stay range-bound in the near term?
Current charts are fairly neutral. This could be the quiet before the storm really hits in 2022!
Resistance and Support
Gold
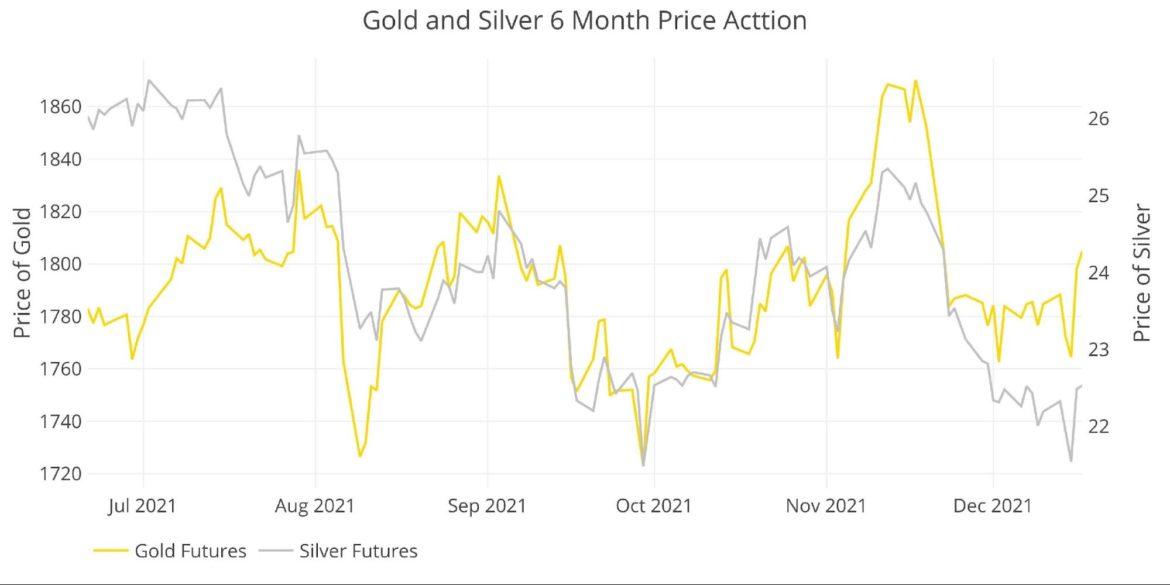
As mentioned, gold has been stuck around $1800 for months. A “buy the rumor sell the fact” unfolded this week as the Fed had its most hawkish meeting in years. Gold bounced hard off the $1750 area but has now gotten trapped at $1800. It needs to break through soon or will face selling pressure. Hedge Funds are driving the price, but will only make so many attempts before retreating and closing longs.
Outlook: Neutral
Silver
Silver is lagging gold and is at the lower end of the consolidation pattern between $22 and $25. The current downside looks limited, but there is nothing that is showing strength. Aside from a sharp rebound off the Fed meeting. The market must build on this move or see the gains lost.
Outlook: Neutral
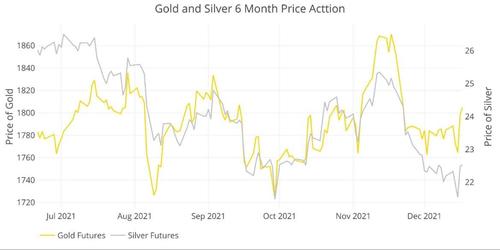
Figure: 1 Gold and Silver Price Action
Daily Moving Averages (DMA)
Gold
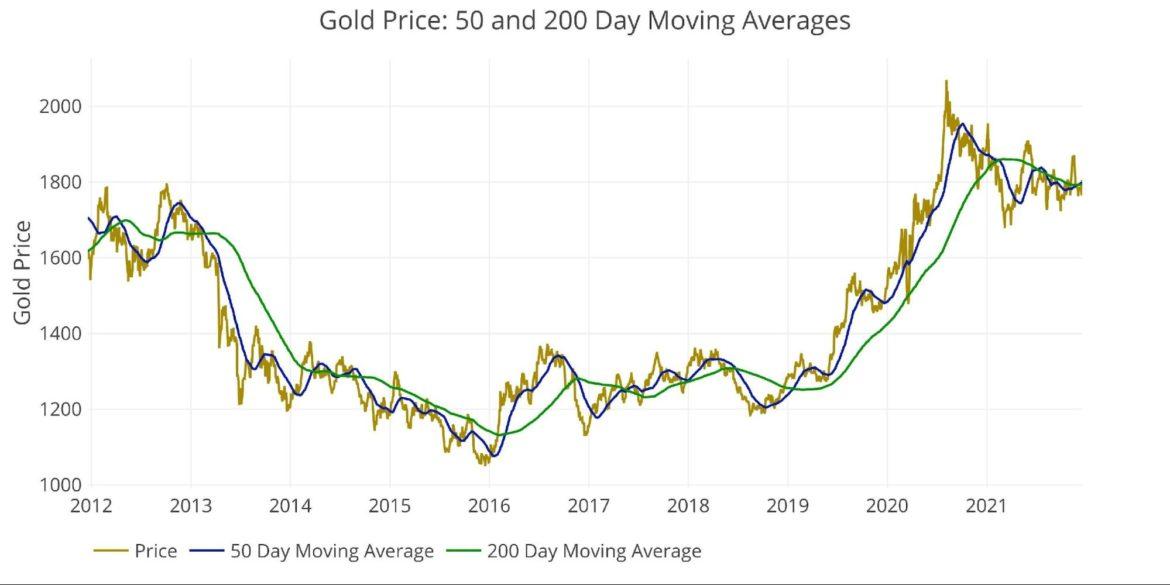
A golden cross formed on Dec 3 as the 50 DMA crossed above the 200 DMA. While this is technically bullish, it lacks conviction. The chart below also shows the current range-bound period. The blue and green lines haven’t been this close for this long since 2014. At the time, gold was consolidating from a big down move before another leg lower. It’s possible the opposite is occurring now (consolidation before an up move) but needs confirmation.
Outlook: Slightly Bullish

Figure: 2 Gold 50/200 DMA
Silver
Silver has an uglier chart. The 50 DMA is still trapped well below the 200 DMA. The 200 DMA is now following the 50 DMA lower, which is not usually a good sign based on history (2011, 2013, 2014, and 2017).
Outlook: Bearish
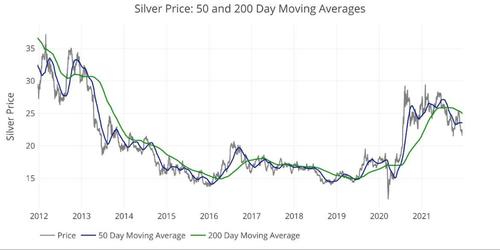
Figure: 3 Silver 50/200 DMA
Comex Open Interest
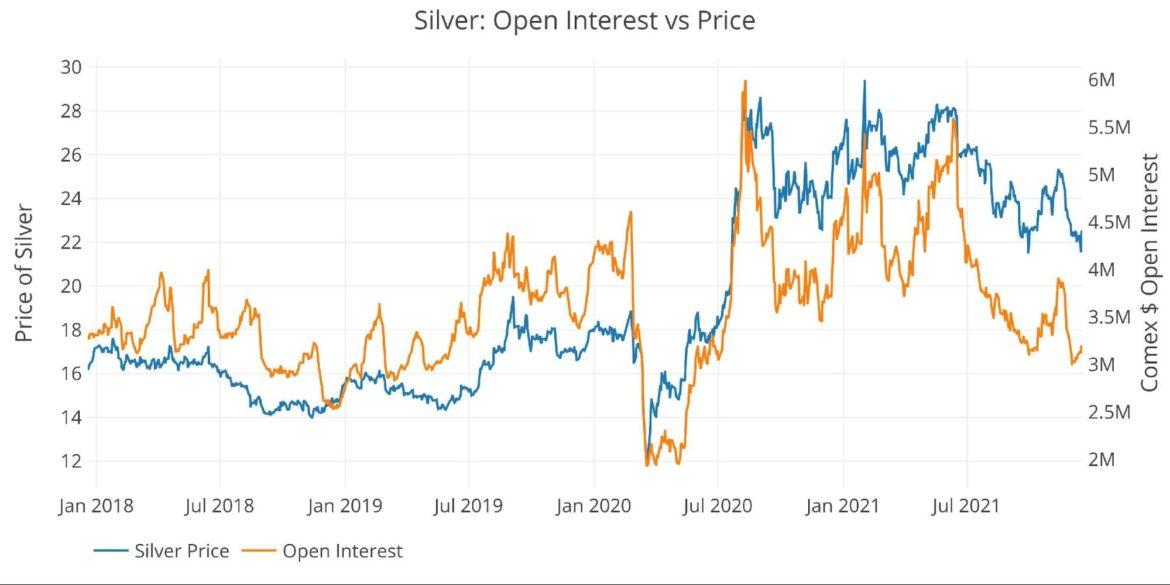
The two charts below show the open interest compared to the price in both gold and silver. The overlap is not perfect, but major moves in one generally occur in tandem with the other as speculators push and pull the price around with paper contracts.
Gold
Traders got excited about gold, but then bailed at the first sign of trouble. Now open interest sits at the lower range compared to recent history. This would indicate there are more longs on the sidelines waiting for the right moment to jump in.
Outlook: Bullish, if gold regains momentum traders will be ready to follow
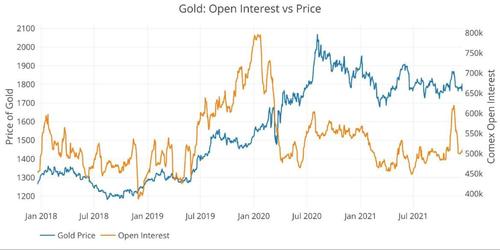
Figure: 4 Gold Price vs Open Interest
Silver
Silver open interest is much lower than its recent history. Some of this is due to the higher price. The chart below has been modified to show notional open interest (accounts for price). As shown, it’s hovering right around the 4-year average but well below the more recent average. Based on the pattern, it looks more likely the market sees an increase in OI that could push the price higher.
Outlook: Slightly Bullish

Figure: 5 Silver Price vs Open Interest
Margin Rates
Most traders use margin to maximize their leverage. When Comex margin requirements are lower, it means the same dollars can get greater exposure. This tends to create more contracts and drive the price higher. Conversely, when requirements are raised, it forces traders to liquidate their positions which keeps a lid on prices. Generally, when margin is low, it can be assumed that any rally will be met with higher margin requirements to slow down a price advance.
This can be seen in the chart below, specifically in 2016 and 2020. As the gold price moved up, margin requirements increased which prompted a sell-off. Margin requirements are currently higher than the 10-year average but have come down quite a bit from recent highs and sit at $7,500. Recent drops in margin have not been enough to push gold higher, but it has come down enough that any big price move up could be met with higher margin requirements, keeping a lid on prices.
Outlook: Neutral

Figure: 6 Gold Margin Dollar Rate
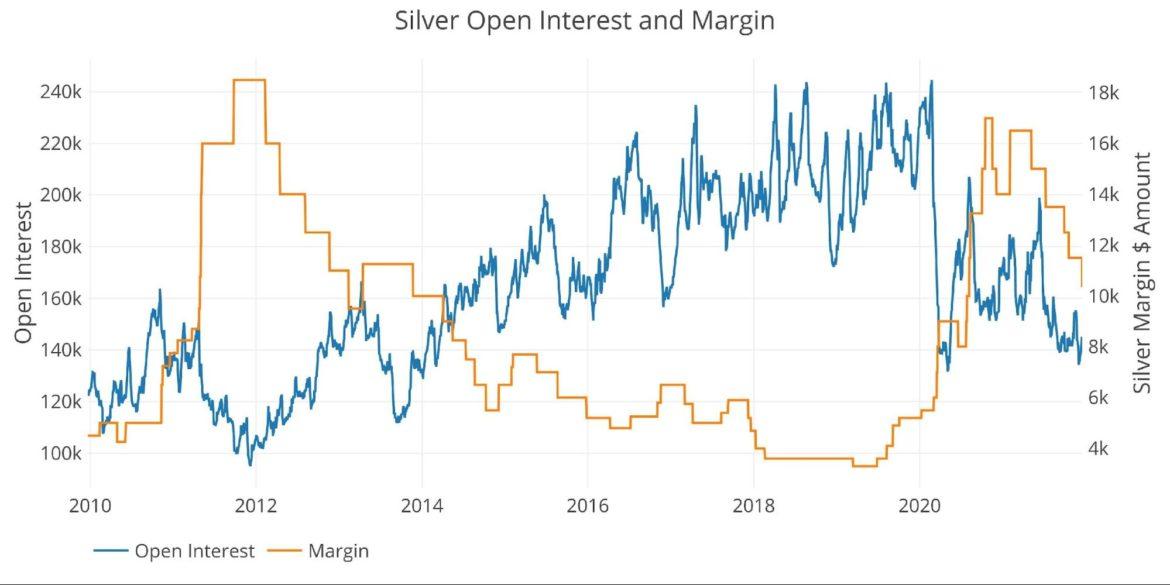
The situation in silver is similar to gold, but the negative correlation looks much stronger. Margin requirements spiked again in February of this year which took the wind out of silvers sail during the Q1 silver squeeze. Requirements have come down some, giving ample room for them to be raised again in the face of a big move (see 2011). If margin requirements continue falling though, it should support silver prices.
Outlook: Neutral

Figure: 7 Silver Margin Dollar Rate
Gold Miners
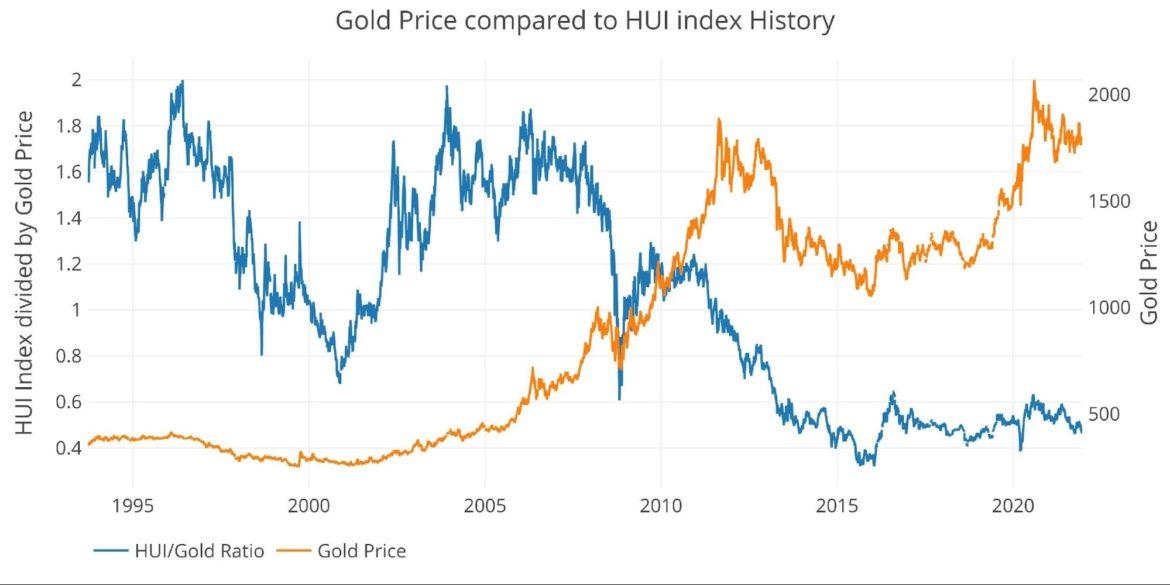
The price movement in mining companies tends to precede a move in the metal itself. Stocks are forward-looking and the sell-off or price spike in the miners indicate the market anticipating the future movement in gold. Below are two charts showing the historical and more recent trends.
Historically, the HUI is extremely undervalued. The HUI would have to increase 4x to reach the highs seen in the 1990s and 2000s. The sector has never really recovered from the gold price sell-off in 2008.
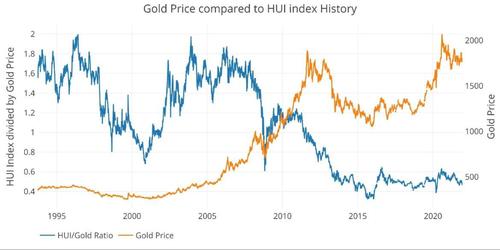
Figure: 8 HUI to Gold Historical Trend
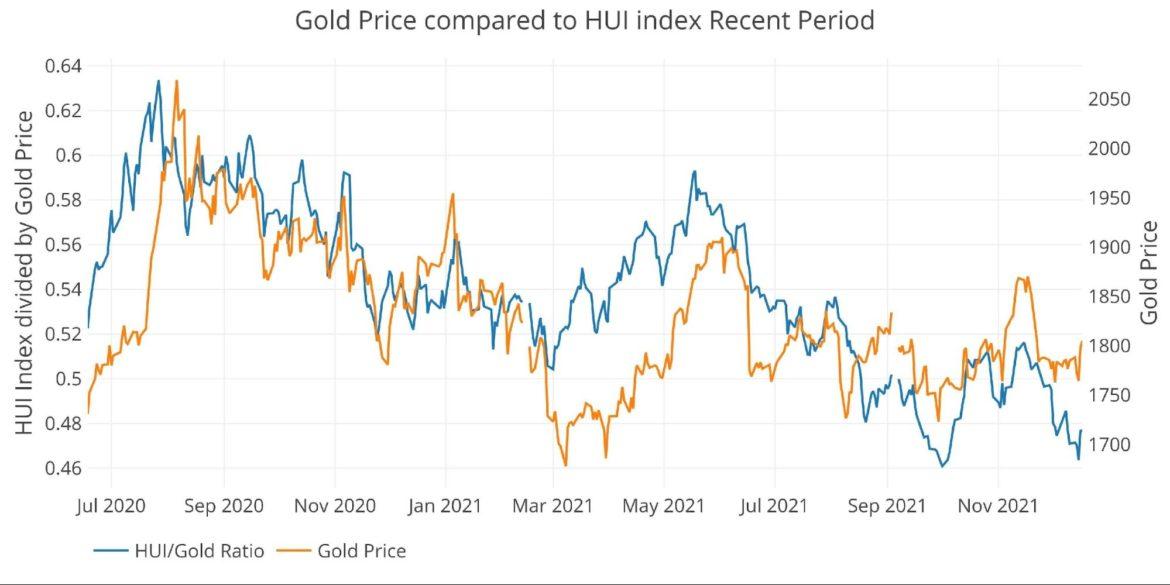
Looking at the more recent trend shows how the miners typically lead the price movement in gold (e.g., Mar 2020, July 2020, Mar 2021, May 2021, Aug 2021, Oct 2021). There are exceptions such as April 2020, but lately the gold stocks are front-running the price moves in gold.
The current ratio has recovered some in recent days after a big move down. Perhaps the miners were a bit too bearish going into the Fed meeting. That being said, if the miners cannot recover in the coming weeks, it could mean momentum in gold is stalling.
Outlook: Bearish until the ratio improves more
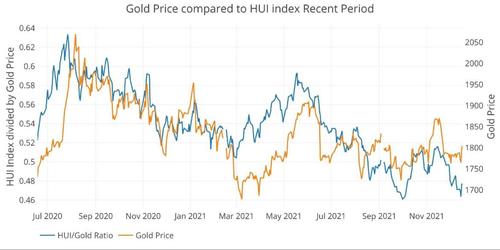
Figure: 9 HUI to Gold Current Trend
Trade Volume
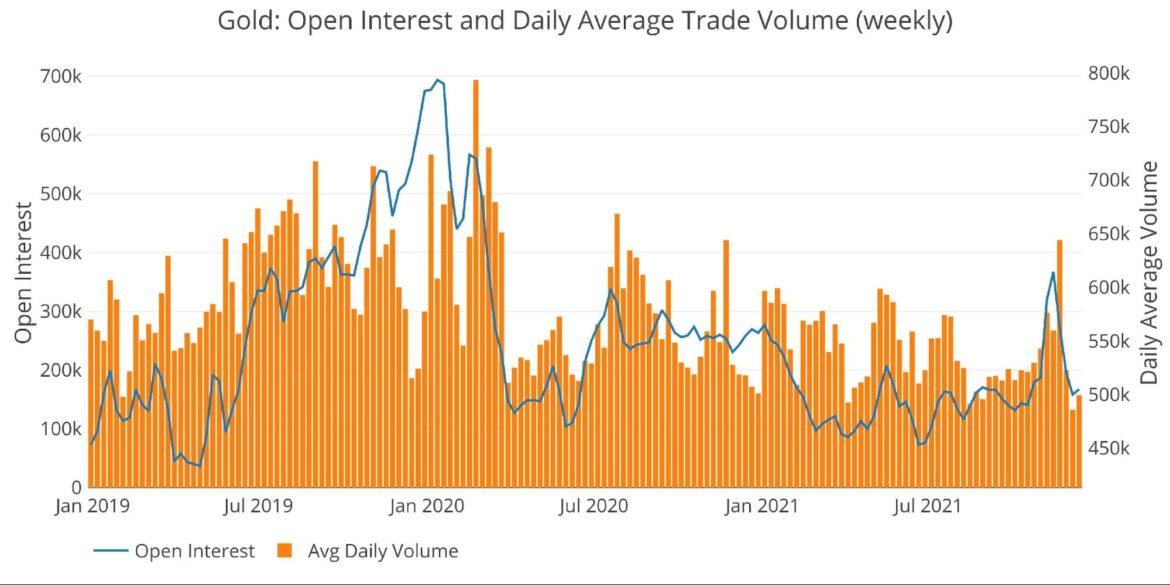
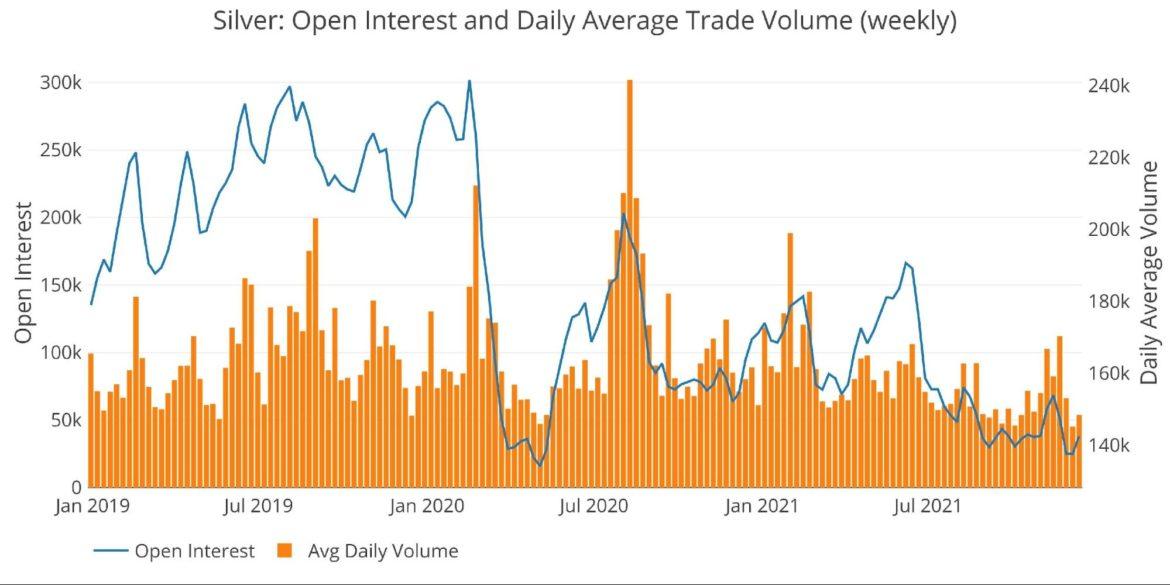
Love or hate the traders/speculators in the paper futures market, but it’s impossible to ignore the impact they have on price. The charts below show that the more active they are, the more prices tend to move up.
After the November run-up, trade volume spiked down hard and fast. It now sits back at the lower range over the past two years. This is the case in both gold and silver. Given there is less room to go down, it means there is more room to go up.
Neutral to slightly bullish in both
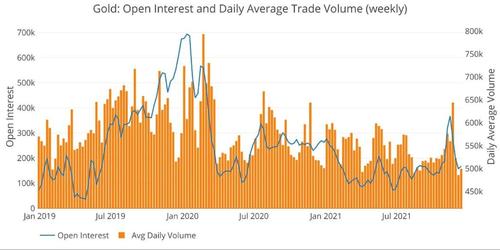
Figure: 10 Gold Volume and Open Interest
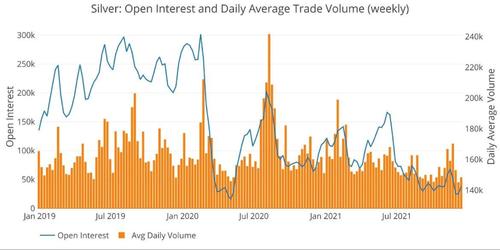
Figure: 11 Silver Volume and Open Interest
Other drivers
USD and Treasuries
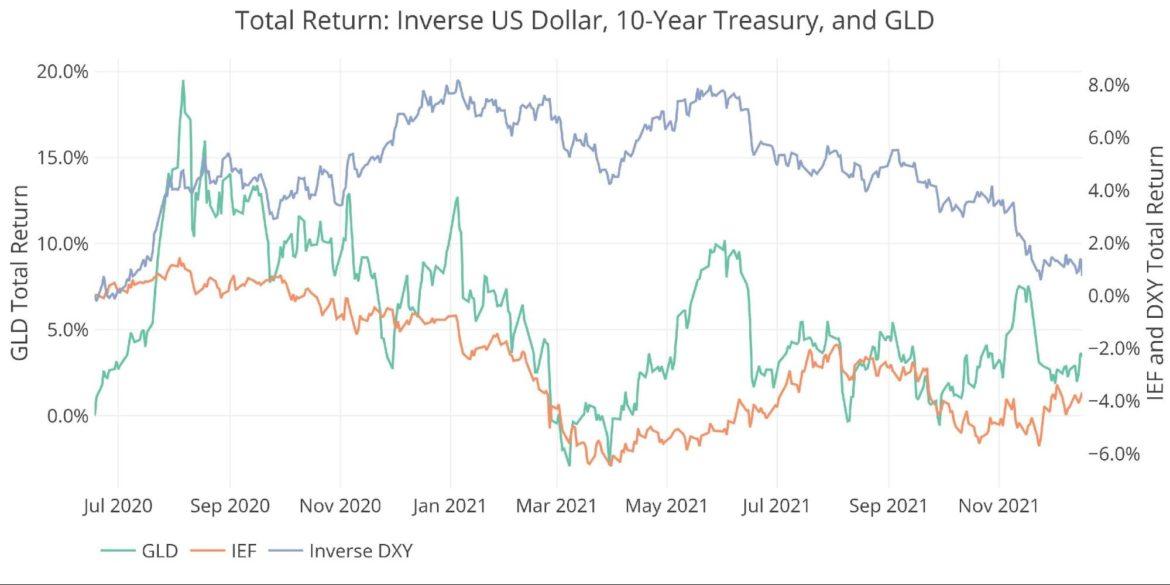
Price action can be driven by activity in the Treasury market or US Dollar exchange rate. A big move up in gold will often occur simultaneously with a move down in US debt rates (a move up in Treasury prices) or a move down in the dollar. This relationship can also be seen over longer time periods as the chart below demonstrates. While gold magnifies the move, the pops and dips tend to move in the same direction.
Please note: IEF is the 7–10-year iShares ETF (a move up represents falling rates) and the Dollar return is inverted in this chart to show a positive correlation. They are also plotted on the right y-axis to better show the price movement.
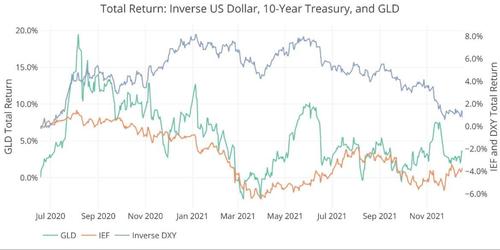
Figure: 12 Price Compare DXY, GLD, 10-year
Last month highlighted how the dollar and gold were moving together (shown above as the blue and green lines converge in November). This was raised as the biggest area of caution across all the metrics because it was more likely the currency markets were correctly pricing the next move. The two are now back in sync which means if the dollar weakens further in the aftermath of the December Fed meeting, gold should benefit.
Outlook: Neutral
Gold Silver Ratio
Gold and silver are very highly correlated but do not move in perfect lockstep. The gold/silver ratio is used by traders to determine relative value between the two metals. Historically, the ratio averages between 40 and 60, so outside this ban can indicate a coming reversion to the mean.
Silver closed the gap some in the November run-up but has since given up all its gains relative to gold. On Dec 15 (Fed meeting day), the ratio (81.9) was the highest it had been since the silver price spike last July. Silver still has more ground to make up relative to gold.
Outlook: Silver Bullish relative to Gold
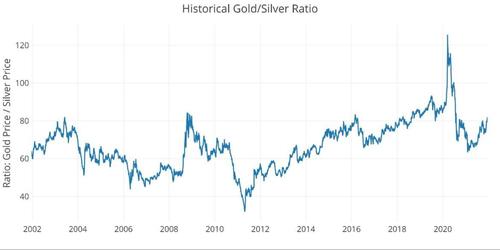
Figure: 13 Gold Silver Ratio
Bringing it all together
The table below shows a snapshot of the trends that exist in the plots above. It compares current values to one month, one year, and three years ago. It also looks at the 50 and 200 daily moving averages. While DMAs are typically only calculated for prices, the DMA on the other variables can show where the current values stack compared to recent history.
Almost all the charts above painted a neutral picture. Not bearish, but not immediately bullish either. Below, the one-month and one-year views show nearly every variable as being worse in the current period. Given that gold has held up relatively well and is still challenging $1800 is a good sign. It means there is dry powder on the sidelines should gold and silver regain their momentum.
Other takeaways:
- Gold and silver prices are down 3.5% and a massive 10.5%
- Silver led the sell-off in gold which differed from last month
- The HUI gold ratio collapsed by 6.6% this month and is off 12.7% from one year ago
- Either the miners need to catch up or gold needs to fall
- Volume is down by 23% in gold and 40% in silver compared to last month
- The open interest ratio in silver actually increased. This is because OI only fell by 7.8% but the price fell by 10.5%
- Gold only fell 3.5% compared to a fall of 17.7% in open interest
- Most current values are also below the 50 day and 200-day averages
- In gold, the 50 DMAs are all above the 200 DMAs. The opposite is true in silver.
Figure: 14 Summary Table
The analysis last month concluded noting that the bullish setup was so extreme it could almost be viewed as bearish. Looking back, it appears the market was hoping for a big move higher on an unexpected Brainard nomination. Trades were unwound when this failed to materialize.
This month is very different. Almost all metrics look neutral. Does this mean gold will continue its range bound moves around $1800? Or is this the quiet before the storm? The data shows a market looking for a catalyst. The new year should bring an abundance of new catalysts (Inflation/Jobs data, USD, Fed meetings, etc.) The market has become entirely Fed-dependent, and the Fed is beating a hawkish drum now. Thus, upside action may be limited in gold until the market realizes the Fed will not actually be hawkish.