Having uber-dovishly over-delivered on his promises for future easing (without actually doing anything), Mario Draghi is kicking the patient can down the road and into the hands of Christine Lagarde.
The question for the press conference is simple – if shit’s so bad that you needed to promise all that future easing, why not start now?
Watch live feed here (starts at 0830ET):
via ZeroHedge News https://ift.tt/2ZeazTI Tyler Durden
When Southwest reported its earnings Thursday morning, it also made a stunning announcement that shows just how badly the 737 MAX 8’s best customer has been hurt by the grounding.
Just as Boeing warns that it could halt production of the troublesome 737 MAX 8 if the plane’s return to the skies is delayed any longer, Southwest Airlines, the 737 MAX 8’s best customer, is reportedly planning to cease operations at Newark Airport. The decision is a direct result of the 737 MAX 8’s grounding.
A representative for the airline said the decision is a “necessary step” to mitigate damages from the “extensive delays” in the recertification process for the MAX. The airline is planning to consolidate its New York-area presence at LaGuardia Airport in Queens, WSJ reports.
The airline is planning to cease operations in Newark on Nov. 3. The airline launched service out of Newark in 2011 and was recently offering 20 daily departures to 10 cities.
At the time of the Ethiopian Air Crash, the second of two crashes involving the 737 MAX 8 that killed a combined 346 people, Southwest had received 31 737 MAX 8s, more than any other airline, and it had orders in for nearly 250 more.
Southwest said its Newark operations have been performing below expectations, while customer demand for more flights out of LaGuardia is “strong.” Customers will be offered options to change their travel plans, and Southwest employees will have the opportunity to relocate to other locations, including LaGuardia.
Because of the 737 MAX 8’s grounding, Southwest expects its available seat miles, a widely watched airline industry metric of passenger-carrying capacity, to decline by 1% of 2% YoY in 2019. Before the grounding, it had anticipated capacity growth of nearly 5%.
As revealed following yesterday’s earnings report, Boeing now expects the 737 MAX 8 will return to the skies either late this year, or in January 2020. According to CEO Dennis Muilenberg, Boeing expects to submit its “final certification package” to the FAA in September.
Shares of the airline tumbled 5% on Thursday in premarket trading after the low-budget carrier said it doesn’t plan to fly the 737 MAX 8 again until next year. It has removed the MAX 8 from its schedules through Jan. 5. Its Q2 revenues came in slightly below estimates.
via ZeroHedge News https://ift.tt/2ZeCpiw Tyler Durden
As expected, the ECB did not cut rates at today’s rate cut, but in a move that was widely expected, the ECB did hint that rate cuts are coming, by adding the “or lower” language, when saying that “Governing Council expects the key ECB interest rates to remain at their present or lowerlevels at least through the first half of 2020.”
Translation: a 10bps rate cut is now assured.
But wait, there was more, with the central bank noting the “need for a highly accommodative stance of monetary policy for a prolonged period of time, as inflation rates, both realised and projected, have been persistently below levels that are in line with its aim.” As a result, the Governing Council noted that it was “determined to act, in line with its commitment to symmetry in the inflation aim. It therefore stands ready to adjust all of its instruments, as appropriate, to ensure that inflation moves towards its aim in a sustained manner.”
In other words, if the Fed is cutting the ECB will also be cutting, and since the Fed launched “symmetric” inflation targeting, i.e. overshooting inflation to the upside, so will the ECB (how it will get there is another matter entirely).
Finally, the ECB also hinted that QE may be coming as soon as September, noting that the Governing Council “has tasked the relevant Eurosystem Committees with examining options, including ways to reinforce its forward guidance on policy rates, mitigating measures, such as the design of a tiered system for reserve remuneration, and options for the size and composition of potential new net asset purchases.”
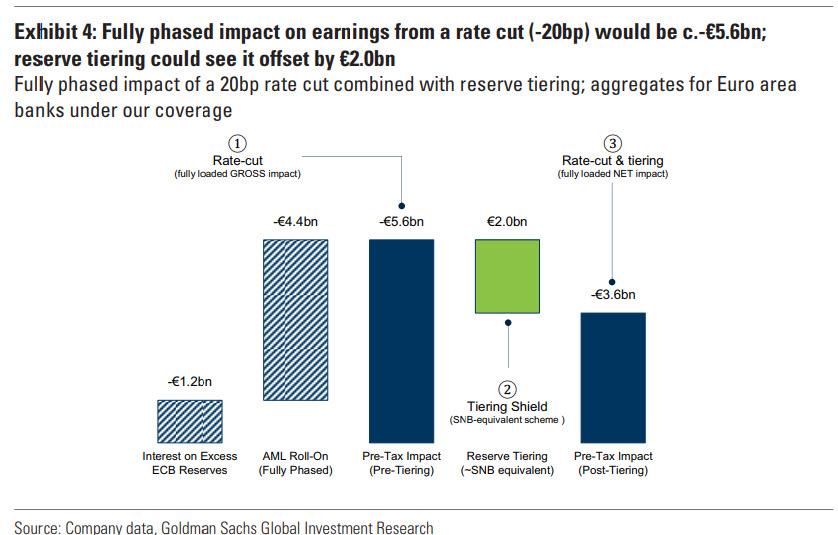
As a reminder, earlier this week we noted an analysis from Goldman, explaining why cutting rates without tiering would be disastrous for European banks, which is why – lo and behold – Draghi (formerly of Goldman) announced just that – tiering is coming, which is good news for Europe’s bank and is the reason why they have jumped on the news of even lower rates.
In short, the race to the currency bottom has arrived.
At today’s meeting the Governing Council of the European Central Bank (ECB) decided that the interest rate on the main refinancing operations and the interest rates on the marginal lending facility and the deposit facility will remain unchanged at 0.00%, 0.25% and -0.40% respectively. The Governing Council expects the key ECB interest rates to remain at their present or lower levels at least through the first half of 2020, and in any case for as long as necessary to ensure the continued sustained convergence of inflation to its aim over the medium term.
The Governing Council intends to continue reinvesting, in full, the principal payments from maturing securities purchased under the asset purchase programme for an extended period of time past the date when it starts raising the key ECB interest rates, and in any case for as long as necessary to maintain favourable liquidity conditions and an ample degree of monetary accommodation.
The Governing Council also underlined the need for a highly accommodative stance of monetary policy for a prolonged period of time, as inflation rates, both realised and projected, have been persistently below levels that are in line with its aim. Accordingly, if the medium-term inflation outlook continues to fall short of its aim, the Governing Council is determined to act, in line with its commitment to symmetry in the inflation aim. It therefore stands ready to adjust all of its instruments, as appropriate, to ensure that inflation moves towards its aim in a sustained manner.
In this context, the Governing Council has tasked the relevant Eurosystem Committees with examining options, including ways to reinforce its forward guidance on policy rates, mitigating measures, such as the design of a tiered system for reserve remuneration, and options for the size and composition of potential new net asset purchases.
The President of the ECB will comment on the considerations underlying these decisions at a press conference starting at 14:30 CET today.
And now we await Draghi’s press conference in just over half an hour.
via ZeroHedge News https://ift.tt/2JQSMfN Tyler Durden
S&P futures struggled for direction on Thursday, with Nasdaq futs down following a plunge in Tesla following dismal guidance, even as European stock were modestly higher ahead of what many expect will be an easing signal by the ECB as a bevy of earnings reports again pointed to a slowing global economy, while holding up in the face of already reduced expectations.
The S&P 500 and Nasdaq hit a new all-time high once again on Wednesday after Texas Instruments hinted that a global slowdown in microchip demand would not be as long as feared, which countered bleak earnings from bellwether companies Boeing and Caterpillar.
The mood was more subdued on Thursday, when Tesla stock tumbled 12.3% and pressured Nasdaq futures after the electric carmaker pushed back its profit timeline once again after missing its quarterly financial targets. On the other hand, 3M rose 4.5% after the manufacturing conglomerate reiterated its full-year earnings forecast despite slowing growth in high-profile markets such as China. Facebook gained 1%, after the social media giant reported quarterly revenue that beat estimates, but said new rules and product changes aimed at protecting user privacy would slow its revenue growth into next year. Ford Motor dropped 4.6% after the automaker reported a lower-than-expected profit, weighed down by charges to restructure its units in Europe and South America, and gave a disappointing full-year earnings forecast.
Two weeks into the second-quarter earnings season, Reuters reports that about 77% of the 138 S&P 500 companies that have reported so far have topped earnings estimates. Overall earnings are now expected to fall 0.1%, compared with a prior estimate of a rise of about 1%.
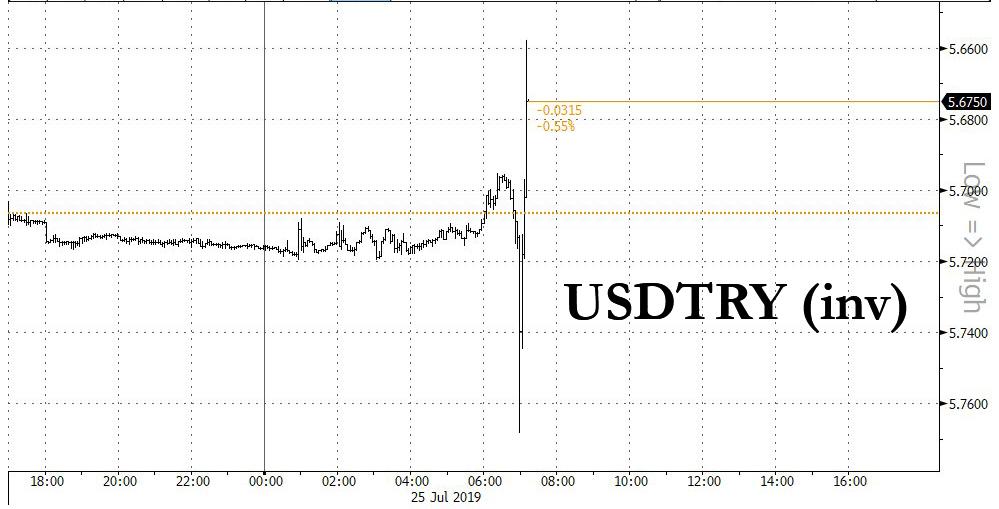
Meanwhile, hopes that key central banks would take monetary measures to impede the impact of a protracted U.S.-China trade war has helped Wall Street’s main indexes hit record highs this month; moments ago Turkey became the latest country to join the easing bandwagon when its central bank cut rates by a whopping 425bps to 19.75%, in line with Erdogan’s demands.
In Europe, the Stoxx Europe 600 pared some of its earlier gains, with health care shares the top performers after earnings for AstraZeneca and Roche beat estimates. AEX (-0.1%) lagged peers, pressured by Unilever (-0.8%) post-earnings. Meanwhile, France’s CAC 40 (+0.5%) benefited from its largest weighted stock LVMH (+1.5%) which rose after the company posted a 20% Y/Y LFL sales increase in leather goods and fashions. Sectors are mixed with outperformance in Pharma names as heavyweight Roche (+1.3%) raised its 2019 revenue growth outlook. On the flip side, energy names lag on the back of the decline in oil prices yesterday. Individual movers include UK-listed Cobham (+34.7%) was bolstered to the top of the Stoxx 600 as the Co. is expected to be acquired for GBP 4.0bln including debt. Other interesting movers on the back of earnings, with Nokia (+6.3%), AstraZeneca (+5.6%), Kion (+4.6%) all at the top of the pan-European index. On the downside, JC Decaux (-5.2%) slid on the back of disappointing numbers whilst SMI-listed Clariant (-9.9%) fell to the foot of the Stoxx 600 after the Co. suspended talks with Sabic over the proposed JV.
Earlier in the session, Asian stocks advanced, heading for a third day of gains though Korean stocks declined for a second day, after U.S. equities climbed to record highs. Communications and technology were among the best-performing sectors. Most markets in the region were up, with the Philippines leading gains. The Topix added 0.2%, supported by chemical firms, as investors gauged a raft of mixed corporate results. Shin-Etsu Chemical Co. and Advantest Corp. jumped after reporting first-quarter operating profits above estimates. The Shanghai Composite Index rose 0.5%, with banks and Kweichow Moutai Co. among the biggest boosts. Beijing gave the green light for some companies to buy U.S. soybeans free of retaliatory import tariffs in a goodwill gesture amid trade negotiations with Washington. India’s Sensex gained 0.3%, set to end a five-day losing streak, as investors sought out value with equities near a two-month low. Most Nifty companies that have reported earnings so far have either met or exceeded analyst estimates.
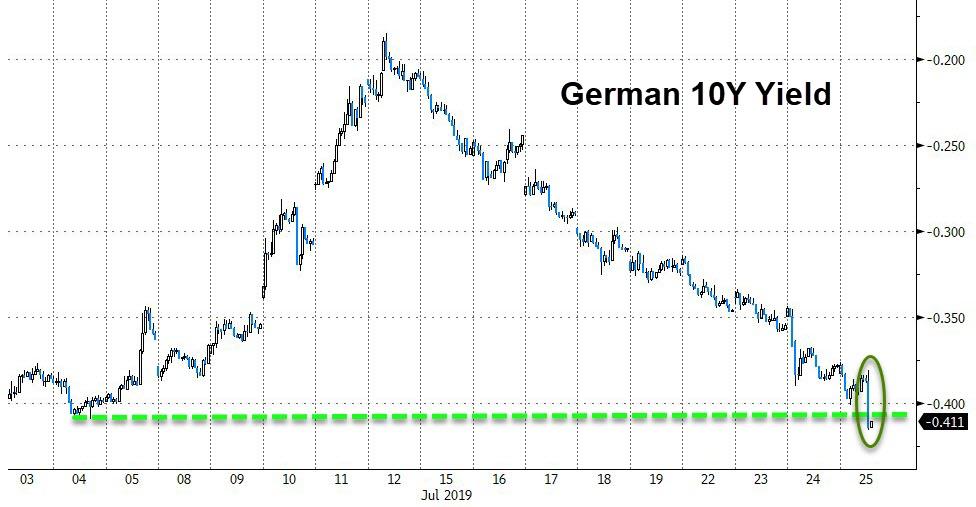
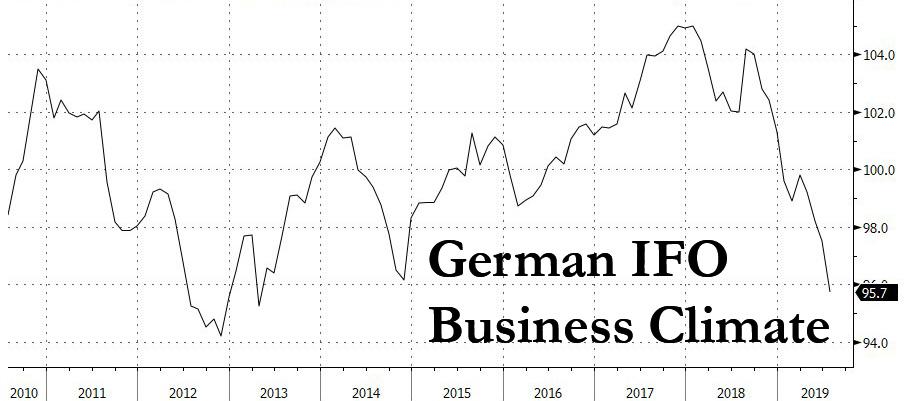
In Rates, Germany’s 30-year bond yield fell to a record on deteriorating business confidence:
German Ifo Business Climate New (Jul) 95.7 vs. Exp. 97.1 (Prev. 97.4, Rev. 97.5).
German Ifo Current Conditions New (Jul) 99.4 vs. Exp. 100.4 (Prev. 100.8, Rev. 101.1)
German Ifo Expectations New (Jul) 92.2 vs. Exp. 94.0 (Prev. 94.2, 94.0)
Ifo economists said that the German economy faces a turbulent time ahead. He sees a slightly positive growth rate in H2, although recession is spreading in all important sectors of German industry. Business Climate has deteriorated in key sectors except for the auto industry.
In FX, the euro fell for a fifth day and Treasuries gained along with European government bonds as the market braced for an easing signal from the European Central Bank’s latest meeting. The dollar was little changed, with the yen gaining ground and the Aussie dollar falling to a two-week low after the RBA said policy makers are prepared to lower interest rates again. The pound steadied as new U.K. Prime Minister Boris Johnson picked a pro-Brexit government team. The Turkish Lira first tumbled, then surged after the CBRT cut rates by more than expected 425bps to 19.75%, its biggest rate cut on record.
In geopolitics, North Korea fired 2 projectiles which flew 430km but did not reach Japan’s exclusive economic zone. Following news of the launch, South Korea Defence Ministry spokesperson urged North Korea to stop acts which are not helpful in easing military tensions, while Japanese PM Abe suggested the North Korea missile launch poses no threat.
Expected data include durable goods orders and wholesale inventories. Amazon, American Airlines, Alphabet, Intel, Starbucks, and T-Mobile are among companies reporting earnings.
Market Snapshot
S&P 500 futures little changed at 3,022.50
STOXX Europe 600 up 0.2% to 392.51
MXAP up 0.2% to 161.31
MXAPJ up 0.3% to 530.23
Nikkei up 0.2% to 21,756.55
Topix up 0.2% to 1,577.85
Hang Seng Index up 0.3% to 28,594.30
Shanghai Composite up 0.5% to 2,937.36
Sensex up 0.1% to 37,884.49
Australia S&P/ASX 200 up 0.6% to 6,818.03
Kospi down 0.4% to 2,074.48
German 10Y yield fell 1.4 bps to -0.392%
Euro down 0.07% to $1.1132
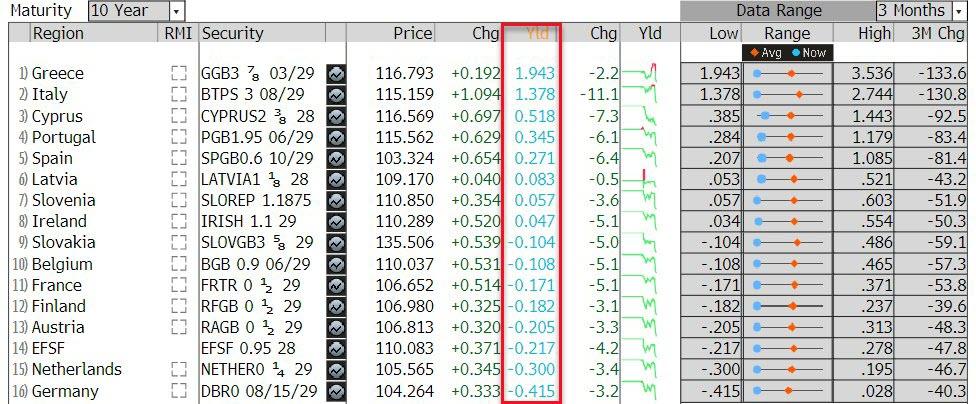
Italian 10Y yield fell 10.7 bps to 1.143%
Spanish 10Y yield fell 3.1 bps to 0.316%
Brent futures up 0.7% to $63.62/bbl
Gold spot up 1% to $1,427.32
U.S. Dollar Index little changed at 97.76
Top Overnight News from Bloomberg
Boris Johnson executed a brutal clear-out of more than half of his predecessor’s top team, installing supporters in key roles as the new prime minister signaled his intent to deliver Brexit in 98 days. Sajid Javid picked to steer the British economy through Brexit
The European Central Bank is set to signal that it is once again preparing to step in to support the euro zone. On the eve of the seventh anniversary of President Mario Draghi’s landmark “whatever it takes” speech, policy makers will decide how to confront an economic slowdown amid risks from U.S. protectionism to Brexit
German companies’ business outlook tumbled to the lowest in a decade, adding to signs that Europe’s largest economy is getting dangerously close to a recession
Treasury Secretary Steven Mnuchin said a strong dollar is good for the U.S. economy in the long term and that he wouldn’t advocate for a weak-dollar policy in the near future
North Korea launched at least two short-range missiles into the sea east of the Korean Peninsula, stepping up pressure on the U.S. as it tries to resume nuclear disarmament talks with Pyongyang
Former Federal Reserve Chairman Alan Greenspan endorsed the idea that the U.S. central bank should be open to an insurance interest-rate cut, to counter risks to the economic outlook, even if the probability of the worst happening was relatively low
Oil held its biggest loss in a week as signs that growth is slowing in major economies overshadowed the longest run of declines in U.S. crude stockpiles since the start of 2018
Asian equity markets mostly traded with cautious gains after a similar performance on Wall St where strength in financials and tech fuelled the S&P 500 and Nasdaq to all-time record highs, although the DJIA underperformed on disappointing blue-chip earnings. ASX 200 (+0.6%) and Nikkei 225 (+0.2%) were higher but with gains capped by weakness in mining related sectors and with Tokyo trade also contained by an uneventful currency after source reports suggested a lack of consensus within the BoJ regarding additional easing measures at next week’s meeting. Elsewhere, the KOSPI (-0.4%) underperformed after North Korea conducted a short-range missile launch and with earnings also heavily in focus, while Hang Seng (+0.3%) and Shanghai Comp. (+0.5%) were choppy as another substantial liquidity drain by the PBoC was counterbalanced by trade optimism after suggestions that next week’s US-China trade meeting is to be held in Shanghai to allow the possibility of President Xi joining in and that the meeting will be followed up by talks in Washington. Finally, 10yr JGBs were relatively flat as they mirrored the rangebound trade in T-notes and with demand also dampened by the indecisive gains in the region, although prices later found mild support after the 2yr auction which attracted a higher b/c and narrower tail in price.
Top Asian News
Digger Giant Warns of ‘Dark Turn’ as Chinese Sales Start to Ebb
Hong Kong Names Eddie Yue as Next Monetary Authority Chief
More Chances to Get Rich Quick in China’s New Stock Venue
China’s Embattled Jinzhou Bank Courts Investors as Bonds Tumble
European equities are directionless with large-cap earnings dictating the state of play of thus far. AEX (-0.1%) lags its peers, pressured by Unilever (-0.8%) post-earnings. Meanwhile, France’s CAC 40 (+0.5%) is benefitting from its largest weighted stock LVMH (+1.5%) which rose after the Co. posted a 20% Y/Y LFL sales increase in leather goods and fashions. Sectors are mixed with outperformance in Pharma names as heavyweight Roche (+1.3%) raised its 2019 revenue growth outlook. On the flip side, energy names lag on the back of the decline in oil prices yesterday. Individual movers include UK-listed Cobham (+34.7%) was bolstered to the top of the Stoxx 600 as the Co. is expected to be acquired for GBP 4.0bln including debt. Other interesting movers on the back of earnings, with Nokia (+6.3%), AstraZeneca (+5.6%), Kion (+4.6%) all at the top of the pan-European index. On the downside, JC Decaux (-5.2%) slid on the back of disappointing numbers whilst SMI-listed Clariant (-9.9%) fell to the foot of the Stoxx 600 after the Co. suspended talks with Sabic over the proposed JV. Over in the States, Facebook (+1.2% pre-market) reported last night with miss on top line and a beat on bottom line. The Co. also noted that EPS would have been higher excluding the FTC legal fees of USD 5bln over privacy violations. Meanwhile, Tesla (-10.8% pre-market) missed on top and bottom line. Looking ahead, around 10% of the S&P 500 is reporting today, whilst DJIA component 3M is also on the docket, with a 4.5% weighting in the index.
Top European News
German Business Confidence Deteriorates as Factory Slump Deepens
Merkel Leaves Europe’s Sputtering Engine to Ride Out the Storm
ECB Is Set to Signal Rate Cut as Economy Slows: Decision Day Guide
ABB Beats Estimates as Activist-Driven Overhaul Bears Fruit
Wizz Air Jumps on Raised Growth Target at Expense of Rivals
In FX, EUR/TRY are not the biggest currency movers, but both certainly prone to big reactions and price action depending on Central Bank policy decisions as the ECB and CBRT both deliver verdicts today. Market pricing for the former is extremely tight between no change and -10 bp, even though the ‘consensus’ leans towards a tweak in guidance for easing in September rather than any adjustments this time, with the probability roughly 50-50. However, the latter is unanimously expected to lower its benchmark and the uncertainty rests on how much given a gaping range of forecasts, from -100 bp to -500 bp, while some observers also suggest that a loud -800 bp call exists. In the run up, the single currency and Turkish Lira are on the defensive, with Eur/Usd teetering above ytd lows in a 1.1145-23 range and capped by yet another bleak German survey in the form of Ifo that missed consensus across the board and compounded by a gloomy statement from the institute noting the spread of recession through all key industrial sectors. Meanwhile, Usd/Try is pivoting 5.7100 and also acknowledging a deterioration in manufacturing sentiment and a decline in cap u.
NZD/AUD – Dovish rate vibes are undermining the Kiwi and Aussie as well, with Westpac recalibrating its RBNZ outlook to match the RBA by pencilling in 2 more 25 bp eases from 1 previously. Nzd/Usd has retreated from 0.6700+ in response, but the Aud/Nzd cross remains anchored near 1.0400 as Aud/Usd slips a bit further from 0.7000 to 0.6965 in wake of comments from RBA Governor Lowe indicating further OCR reductions if demand disappoints and acknowledging that inflation will take time to hit target.
JPY/CAD/GBP/CHF – All narrowly mixed vs a solid Greenback, as the DXY continues to test a key Fib retracement level at 97.776 within a tight 97.778-679 band, with the Yen still stuck around 108.00 and embroiled in decent option expiries (1.7bn from 107.75 to 107.80 and 1.5 bn between 107.90-108.00) vs technical resistance at 108.31 (also a Fib). Meanwhile, the Loonie hugs 1.3128-44 ahead of Canadian wage data, Cable retains a recovery tone within 1.2450-1.2500 and the Franc remains underpinned around 0.9850 vs the Buck and over 1.1000 against the Euro, expecting the SNB to match or counteract any ECB moves.
ZAR – The Rand is underperforming after a stark warning from Moody’s that the latest state aid for Eskom will put further strain on the Government’s finances and threaten SA’s rating, with Usd/Zar nudging the top of 13.9750-8600 range.
In commodities, WTI and Brent futures are marginally firmer, albeit it seems to be more of a consolidation from yesterday’s DoE-induced decline and on the news that Kuwait and Saudi officials discussed resuming production from the neutral zone which had previously provided around 500k bpd of supply. WTI and Brent currently reside around the 56.00/bbl and 63.50/bbl levels with the former eyeing its 50 DMA at 56.87/bbl ahead of its 200 DMA at 57.11/bbl (with the psychological 57/bbl level in-between). News flow for the complex has been light thus far with traders eyeing the ECB’s latest monetary policy decision (full preview available in the Research Suite) for the next possible catalyst. Elsewhere, gold prices are relatively steady above the 1400/oz mark with Central Bank decisions very much in focus. Elsewhere copper is little changed amid the cautious/tentative risk tone whilst Shanghai lead climbed over 1% overnight amid revived supply concerns due to maintenance activity in China.
US Event Calendar
8:30am: Durable Goods Orders, est. 0.7%, prior -1.3%; Durables Ex Transportation, est. 0.2%, prior 0.4%
8:30am: Cap Goods Orders Nondef Ex Air, est. 0.2%, prior 0.5%; Cap Goods Ship Nondef Ex Air, est. -0.2%, prior 0.6%
8:30am: Wholesale Inventories MoM, est. 0.5%, prior 0.4%; Retail Inventories MoM, est. 0.2%, prior 0.5%
8:30am: Initial Jobless Claims, est. 218,000, prior 216,000; Continuing Claims, est. 1.69m, prior 1.69m
9:45am: Bloomberg Consumer Comfort, prior 64.7
11am: Kansas City Fed Manf. Activity, est. 2.8, prior 0
DB’s Jim Reid concludes the overnight wrap
Welcome to ECB day, and a meeting where we should move closer to what is likely to be a round of global policy easing in the months ahead. Mr Draghi paved the way at Sintra last month where he laid the foundations to make further policy easing feel less conditional. Our economists, in their preview note last week ( link ), believe that September is the natural occasion for the big decisions and details but expect some preparation today. They expect the “or lower” easing bias to be reintroduced into rates guidance and that this will be the prelude to a 10bp deposit rate cut and tiering in September. They also expect a further 10bp cut in December. They also believe we will see upgraded forward guidance used to underline the ECB’s “absolute commitment” to the price stability mandate. If the Council is unable to strengthen forward guidance sufficiently, a new wave of net asset purchases may be required in the not too distant future. If so, the team would not be surprised by new QE of EUR30bn per month for a minimum 9-12 months split equally between public and private assets and with a commitment to relax the limits if necessary.
Ahead of this, fixed income rallied across Europe yesterday as the European preliminary PMIs for July showed the manufacturing sector continuing to disappoint – something the ECB will have to acknowledge. The manufacturing PMI for the Eurozone fell to its lowest in over six years at 46.4 (vs 47.6 last month), the German figure fell to a seven-year low of 43.1 (vs. 45.0) and France recorded a flat 50.0 (vs. 51.9) reading. The services readings also fell, but were mostly in line with expectations, with the Eurozone figure at 53.5 (vs. 53.6 last month), Germany at 55.4 (vs. 55.8) and France at 52.2 (vs. 52.9). In response, ten-year bund yields closed down –2.3bps with the previous on the run hitting a fresh all-time low of -0.423%. BTPs fell -10.9bps to a fresh one-year low on news that auctions had been cancelled, while Greek ten-year yields fell -5.7bps to close below 2% for the first time ever. That takes their yield to -6.2bps lower than US treasuries, their lowest level versus the US benchmark since October 2007. Treasuries joined the European rally with 10-year yields ending -3.8bps lower at 2.043%.
Despite the rally for rates and the tepid manufacturing surveys, equities mostly rallied yesterday. The S&P 500 gained +0.47% to 3019.6, a new all-time high. The DOW (-0.29%) again lagged as Boeing (-3.12%) and Caterpillar (-4.48%) dragged on the index after their earnings reports. Boeing saw a net loss of -$2.94bn in the second quarter, paired with a -35% yoy drop in revenues, as the company continues to suffer from the grounding of the 737 MAX. Caterpillar is viewed as a global macro bellwether, and overall its guidance was soft, saying they expect profits “to be at the lower end” of their full-year outlook range. Digging into their results showed healthy sales growth in North America (+11%) and Latin America (+9%), but weakness in Europe, Africa, and the Middle East (-6% combined) and in Asia (-7%), which is consistent with the general trend of US macro outperformance.
Away from industrials, tech was also in focus yesterday. The NASDAQ and Philly semiconductor indexes advanced +0.85% and +3.10%, respectively, both to new record highs. The sector benefited from positive sentiment post Texas Instrument’s (+7.44%) strong earnings report from Tuesday night, plus further strong guidance from Taiwan Semiconductor Manufacturing co, the world’s biggest chipmaker. Facebook (+0.80% after hours) posted strong revenue and active users figures, which ended up trumping new regulatory headwinds for the company. Facebook announced that the Federal Trade Commission has opened an antitrust investigation of the company, which comes after Facebook said earlier that it had agreed to pay a $5bn settlement and accept new privacy restrictions on its social media platform, to address a separate investigation.
This morning in Asia markets are largely trading up with exception of the Kospi which is -0.60%. The Nikkei (+0.36%), Hang Seng (+0.26%) and Shanghai Comp (+0.29%) are all up. The Australian dollar is trading down -0.07% after the country’s central bank chief Philip Lowe said that he’s ready to ease policy further if his recent back-to-back cuts fail to revive economic growth and flagged “an extended period” of low interest rates. Elsewhere, futures on the S&P 500 are trading flat while those on the Nasdaq are down -0.26%. In terms of overnight data releases, South Korea’s preliminary Q2 GDP printed at +2.1% yoy (vs. +1.9% yoy expected and +1.7% yoy last quarter). In details it showed that private-sector investment shaved 0.5pp off quarterly growth, meaning government investment drove the expansion and underlines the fragility of the rebound in growth.
In other overnight news, India is considering an option to raise $10bn from its first sovereign foreign currency bond offering with bonds likely to be denominated in either the Japanese yen or euros to take advantage of lower yields. The proposed offering could come to markets in October. Elsewhere, North Korea launched at least two short-range missiles into the sea east of the Korean Peninsula, stepping up pressure on the US as it tries to resume nuclear disarmament talks with Pyongyang and bringing geopolitical risks back into some focus.
Back to yesterday and in the UK, Boris Johnson was appointed by the Queen as the prime minister yesterday, facing perhaps the most difficult set of circumstances of any incoming PM for decades. On the steps of Downing Street, Johnson struck an aggressive tone on Brexit, reiterating that the decision of the referendum in 2016 must be respected. He said he wanted to reach a “new deal” with the EU, with the backstop removed, and see the country leave on the October 31 deadline “no ifs or buts”. Johnson also said that he would prepare for a no-deal outcome and that “the doubters, the doomsters, the gloomsters are going to get it wrong again.” In a letter to the incoming Prime Minister, European Council President Donald Tusk said pointedly that “I look forward to meeting you to discuss – in detail – our cooperation.”
Johnson began assembling his cabinet after his appointment, and the clear signal is that committed supporters of Brexit are in the key positions, and also those who support his pledge to leave the EU without a deal if necessary by October 31. Former DB employee Sajid Javid was appointed as Chancellor of the Exchequer, while Dominic Raab was made foreign secretary. In terms of the market reaction, sterling was unaffected by Johnson’s speech, although it strengthened +0.33% against the dollar before Johnson’s meeting with the Queen.
Without a general election, Johnson faces much the same constraints as his predecessor, in that his party lacks a majority in the House of Commons and relies on the DUP’s 10 MPs in order to win key votes. With an upcoming parliamentary by-election next week in Wales, where pro-EU Liberal Democrats are favourites to take the seat off the Conservatives (per the Independent), that could shrink even further. So the honeymoon won’t last long.
In terms of other data released yesterday, the flash PMIs from the US also saw an increasing divergence between manufacturing and services, repeating the theme seen in Europe. The manufacturing reading fell to a flat 50.0 (vs. 50.6 last month), its lowest level since 2009, while the services reading rose to 52.2 (vs 51.5 last month). Elsewhere, the new home sales data disappointed, with the 646k reading for June below the 658k expected, while the previous month’s reading was revised down by 22k. In France, the Insee’s business climate indicator fell by one point to 105 in July (vs. 106 expected). The business climate indicators for both the manufacturing and services indicators also fell by one point, to 101 and 106 respectively, while the employment climate reading rose by one point to 107.
In terms of the day ahead, the aforementioned ECB policy decision and press conference will be the highlight, (along with Prime Minister Johnson’s first appearance as PM in the House of Commons). Looking at data releases, we have US durable goods orders, wholesale inventories, and weekly initial jobless claims. There’ll also be the Kansas City Fed’s manufacturing index, the German Ifo Survey, and the latest CBI data from the UK. Elsewhere, Amazon and Alphabet will be announcing earnings.
via ZeroHedge News https://ift.tt/2Yhj0QX Tyler Durden
“The temperature’s rising, it isn’t surprising.. “
Lots of stuff to think about this morning – will weakening European manufacturing and orders cause the ECB to make an early slice on European rates? What will a cut from -Ve 0.4% in European rates actually do? (Clue – what is the very smallest thing you can think of.) The market thinks the ECB might act – which is why European bond yields continue to spiral lower. I reckon it’s unlikely – the ECB likes to wait and see, then wait some more. I think the September meeting will be a much more dramatic moment; one meeting before Draghi’s last and Legarde takes over. Reopening the QE asset purchase programmes is more problematical – the shortage of Bunds and the EBC’s rules about proportionality means it is at its limits on some country debt!
Next week we have the Fed meeting to look forward to. Whoopee..
Boeing’s warning it may stop production of the B-737 Max is fascinating. Thus far the company has “burnt” some $1 bln plus in unsold plane costs. That’s the cost of building a plane, parking it on the apron, and not getting paid for it. That number is growing as each month it adds another 42 unsold but costly to build lumps of metal to the parking lot. The CEO says he “can’t foot the extra expenses indefinitely”. No S**t Sherlock. There is still no clear timeline to get the plane back in the air – assuming anyone will still want to fly it.
Boeing results yesterday were… “interesting” – confirming the new B777x is going to be delayed – which is exactly what we expected: the company has been forced to totally rethink branding completely new aircraft as “upgrades” to aid sales and cut regulatory costs. It’s a spectacular backfire – yet Boeing stock is only down some 14% since the second Max crash. I still think it could get worse as the market understands what a long-term technical and reputational hole the company has dug itself into. Fubar describes it nicely.
Back in Yoorp, Germany’s auto-industrial sector is not a happy place. They are still struggling with the legacy of falsified emission tests, and now its slumping China demand and the possibility their biggest external European market, the UK, will be closed to them. How bleak is the future for conventional Autos?
Which brings us to you know who… The best argument for buying Telsa is that they are clearly the leader in Electric Vehicles. Supporters of Tesla point to the fact it is now building more cars than ever, the smokestack petrol obsolescence of the leading car makers (including the German superbrands), and that none of them are catching Tesla. It is top of many car buying league tables in the US – best selling premium car! Should I be worried the demand charts all seem to be flat at the top of their respective S-Curves? Of course not – so I am told.
Tesla delivered nearly 100,000 cars in Q2, but it’s posted another set of poor results and a $400mm loss. Cutting the price and margin, and the lease cost on the Model 3 shifted cars. I’m told it doesn’t matter – its selling cars and will get to 400k cars per annum! Are you sure cutting margins and losing money doesn’t matter? It’s producing more of its cheaper, lower margin models, and it just got rid of the co-founder JB Straubel. It’s still struggling to build cars – production lines are still in tents at its Fremont factory – although it should open a new Shanghai plant by year end.
I’m told these production, margin and distribution problems are just growing pains, and Tesla’s Model 3 (because the S and the X are now very long toothed) is the future – a car the world and America wants. Once Tesla get’s production sorted, then it’s a screaming buy? If its selling lots of cars, and can charge premium prices for them.. Why not?
But what if it is not? My big doubt about Tesla is competition. It’s still in competition with conventional car makers. While stock market minnow Ford might make petrol-punk pick-ups and SUVs, it makes money. Tesla is also in competition for Electric vehicles – back in May, Tesla sold 1000 of its Model X in the US. Audi sold 856 of its more expensive e-Tron SUV. Even the Jag I-Pace (which I’ve driven) sold over 200. (And sure, the X is a very old car, but the e-Tron barely beats it.) Even the new Porsche SUV E-car the Taycan EV can’t beat the old Tesla S on speed – and its nearly twice the price!
How much longer can Tesla stay ahead of the opposition? Other car makers are not blind to the changing opportunity. Can Tesla stay ahead long enough for it to become a real, profitable car maker, and then deliver all the other distractions Musk focuses on? I am not utterly convinced.. but prepared to listen to the arguments. Tesla stock took a pounding last night on the losses..
Another problem facing the German car makers is logistics. Years and years ago I was exploring the Bloomberg and discovered it has the depth of the River Rhine somewhere in its base info. That’s a critical measure in Germany – as the Rhine gets lower because the extraordinary summer heat, the amount of “stuff” Germany ships around on it gets trapped. Great story on BBerg – well worth a read. Basically, its not just heat from Africa we should be worried about, but disappearing glaciers mean Europe’s major rivers are drying up. Last week I read the permafrost that holds the Alps together is melting, and iconic mountains like the Matterhorn are collapsing and becoming too dangerous to climb.
via ZeroHedge News https://ift.tt/30Tv7RI Tyler Durden
When Turkish president Erdogan sacked the now former Turkish central bank head Ceitnkaya two weeks ago because the latter refused to ease monetary policy despite the country’s surging inflation and tumbling currency, it was no longer a question if the central bank would cut rates but by how much.
We got the answer this morning, when the CBRT (and it new head) announced that it slashed the benchmark 1-week repo rate by a whopping 425bps, from 24% to 19.75%, almost double the 250bps consensus expectation of a Bloomberg survey, due to “a moderate recovery in the economic activity.”
This is how the CBRT justified its decision to follow Erdogan’s demands for lower rates for this massive cut which will make the TRY a far less attractive carry currency, and likely lead to a resumption of the TRY’s devaluation:
Recently released data indicate a moderate recovery in the economic activity. Goods and services exports continue to display an upward trend despite the weakening in the global economic outlook, indicating improved competitiveness. In particular, strong tourism revenues support the economic activity through direct and indirect channels. Looking forward, net exports are expected to contribute to the economic growth and the gradual recovery is likely to continue with the help of the disinflation trend and the partial improvement in financial conditions. The composition of growth is having a positive impact on the external balance. Current account balance is expected to maintain its improving trend.
Recently, weaker global economic activity and heightened downside risks to inflation have strengthened the possibility that advanced economy central banks will take expansionary monetary policy steps. While these developments support the demand for emerging market assets and the risk appetite, rising protectionism and uncertainty regarding global economic policies are closely monitored in terms of their impact on both capital flows and international trade.
The CBRT also saw little risk in runaway inflation accelerating from here, despite prices – especially food – still soaring:
Inflation outlook continued to improve. In the second quarter, inflation displayed a significant fall with the contribution from a deceleration in unprocessed food and energy prices. Domestic demand conditions and the tight monetary policy continue to support disinflation. Underlying trend indicators, supply side factors, and import prices lead to an improvement in the inflation outlook. In light of these developments, recent forecast revisions suggest that inflation is likely to materialize slightly below the projections of the April Inflation Report by the end of the year. Accordingly, considering all the factors affecting inflation outlook, the Committee decided to reduce the policy rate by 425 basis points.
And while the initial kneejerk reaction was one expecting even more rate cuts, the CBRT did note that it would remain data-dependent and cautious on monetary policy, which prompted some to anticipate less easing in the future.
The Committee assesses that maintaining a sustained disinflation process is the key for achieving lower sovereign risk, lower long-term interest rates, and stronger economic recovery. Keeping the disinflation process in track with the targeted path requires the continuation of a cautious monetary stance. In this respect, the extent of the monetary tightness will be determined by considering the indicators of the underlying inflation trend to ensure the continuation of the disinflation process. The Central Bank will continue to use all available instruments in pursuit of the price stability and financial stability objectives.
In response, the Turkish lira initially tumbled as low as 5.7681, but then promptly retraced all losses, and has since soared as high as 5.6579, on what some suspect was central bank intervention to prevent the initial momentum from being in a downward direction.
via ZeroHedge News https://ift.tt/2Y2d6nf Tyler Durden
The ECB will announce its monetary policy decision at 745am ET (1345 CET), with a press conference 45 minutes later.
Consensus looks for the ECB to leave its three key rates unchanged
Market pricing places the chances of a 10bps cut as a much tighter call
July seen as a staging meeting for a broader stimulus package to be unveiled in September
62 of 67 analysts surveyed by Reuters look for the Deposit Rate to be held at – 0.4%, with four looking for a 10bps cut, and one looking for a 20bps cut; Main Refi and Marginal Lending rates are unanimously expected to remain unchanged at 0% and 0.25% respectively. Note, markets currently price in 53.4% chance of a cut this week. With the ECB expected to stand pat on rates this week, participants will be eyeing any tweaks to the Bank’s forward guidance that would pave the way for a potential move in September, possibly as part of a broader easing package.
BACKGROUND
PREVIOUS MEETING: The latest policy announcement from the ECB saw policymakers stand pat on rates as expected, whilst unexpectedly (according to consensus) pushing back guidance on rates. Furthermore, the Bank unveiled details of the lending terms for TLTRO3 with the interest rate set at the MRO + 10bps, but eligible entities able to seek financing at the deposit rate +10bps. President Draghi noted that incoming data points to weaker growth in Q2 and Q3, whilst Euro Area risks remain tilted to the downside. During the Q&A, Draghi noted that there was a discussion on the ECB’s readiness to act in the event of an emergency with policymakers raising the possibility of lowering rates (deposit), restarting APP and a further extension of forward guidance. On the subject of forward guidance for rates, Draghi later stated that it is not correct to suggest that guidance is tilted towards rate hikes. Discussions on other measures included the prospect of a tiered rate system, however, the ECB President pushed back against such action.
ECB MINUTES: The account from the June meeting provided little in the way of surprises with the minutes largely reflecting the tone of the press conference. Policymakers stated that there should be no room for complacency over the fall of market expectations and as such, there was a broad agreement (interestingly, not unanimous) for the need to shift the Bank’s stance and demonstrate a determination to act. Elsewhere, the argument was made for TLTRO3 pricing to be in line with the prior round. From a guidance perspective, one interesting takeaway was that the “point was made that the value of calendar-element of guidance could seen to be diminished”, which appears to provide some concern over the Bank having pushed back their guidance multiple times. The account also showed policymakers continuing to push back on the need for a tiered deposit rate system by suggesting that the “costs of negative rates are outweighed by benefits,” however, there was an acknowledgement that “this might not hold for lower rates or longer horizons”.
ECB RHETORIC: The most noteworthy interjection of any policymaker since the last meeting came from President Draghi at the Sintra conference in June with Draghi noting that “In the absence of improvement, such that the sustained return of inflation to the Bank’s aim is threatened, additional stimulus will be required”. Adding that, “in the coming weeks, the Governing Council will deliberate how their instruments can be adapted commensurate to the severity of the risk to price stability”. Since his appearance at Sintra, other policymakers have followed suit with VP de Guindos noting that the ECB could opt for a combination of actions to restore inflation and QE is among the wide range of tools available. Whilst jostling for the top job at the Bank, Finland’s Rehn stated that the ECB is ready to adjust all of its instruments as appropriate, and with a symmetric approach, inflation in the short run may vary around the 2% mark. What is also telling, is that hawks Weidmann and Knot have also hinted a more dovish leaning to their policy view. Finally, the influential Coeure noted that the protracted period of low inflation has caused concerns among financial market participants that current subdued underlying price pressures will persist in the medium term, adding that the Governing Council is taking these concerns seriously.
SOURCE REPORTS: After Draghi’s appearance at Sintra, source reports suggested differing accounts surrounding the balance of views at the Bank, with an initial article suggesting that officials at the ECB view rate cuts as the primary tool for further stimulus, whereas a follow-up article a few hours later suggested policymakers were more divided between rate cuts and QE. Elsewhere, sources at the end of last month stated that a loophole may allow a way for the ECB to purchase more state debt via a bond clause, although it is yet to be discussed by policymakers. Another report in early July, suggested that policymakers see no rush for a rate cut this month, whilst more recently journalists revealed that policymakers are considering a potential revamp to their inflation goal in favour of a more symmetrical approach.
DATA: On the inflation front, CPI continues to reside well below the 2% mark even with headline inflation for June revised higher to 1.3% from the prelim 1.2% print. Core readings also remain subdued with the ‘super-core’ metric running at 1.1%. From a growth perspective, markets still await the release of Q2 growth metrics, next month, however, UBS suggest the bloc remains on track for growth of 0.2% Q/Q, 1.0% Y/Y. Survey data this week saw the July Eurozone Composite PMI slip to 51.5 from 52.2 (Manufacturing 46.4 vs. Prev. 47.6, Services 53.3 vs. Prev. 53.6) with IHS noting “the Eurozone economy relapsed in July, with the PMI giving up the gains seen in May and June to signal one of the weakest expansions seen over the past six years”. Subsequently, IHS concluded “the pace of GDP growth looks set to weaken from the 0.2% rate indicated for the second quarter closer to 0.1% in the third quarter”. Elsewhere, Eurozone Consumer Confidence rose to -6.6 from -7.2, whilst the latest Bank Lending Survey added to the evidence that the Eurozone economy will remain sluggish as concluded by Capital Economics.
CURRENT ECB FORWARD GUIDANCE (INTRODUCTORY STATEMENT)
RATES: We now expect them to remain at their present levels at least through the first half of 2020, and in any case for as long as necessary to ensure the continued sustained convergence of inflation to levels that are below, but close to, 2% over the medium term. (Jun 6th)
ASSET PURCHASES: We intend to continue reinvesting, in full, the principal payments from maturing securities purchased under the asset purchase programme for an extended period of time past the date when we start raising the key ECB interest rates, and in any case for as long as necessary to maintain favourable liquidity conditions and an ample degree of monetary accommodation. (Jun 6th)
GROWTH/TRADE: The risks surrounding the euro area growth outlook remain tilted to the downside, on account of the prolonged presence of uncertainties, related to geopolitical factors, the rising threat of protectionism and vulnerabilities in emerging markets. (Jun 6th)
INFLATION: Measures of underlying inflation remain generally muted, but labour cost pressures continue to strengthen and broaden amid high levels of capacity utilisation and tightening labour markets. Looking ahead, underlying inflation is expected to increase over the medium term, supported by our monetary policy measures, the ongoing economic expansion and stronger wage growth. (Jun 6th)
POTENTIAL ADJUSTMENTS TO ECB FORWARD GUIDANCE (INTRODUCTORY STATEMENT)
RATES: This part of the statement will likely garner the greatest source of market focus, particularly in the absence of a rate cut this week. With consensus looking for the ECB to stand pat on rates, analysts (66% of those surveyed by Reuters) suggest that instead, policymakers will likely tweak guidance on rates to include the option of “or lower rates”; a move that Danske Bank suggest would allow for the unveiling of a comprehensive easing package in September. Furthermore, the statement might also see the removal of the timeframe provided by forward guidance on rates with the minutes from the June meeting noting that the “point was made that the value of calendar-element of guidance could seen to be diminished”.
ASSET PURCHASES: Adjustments on this front are unlikely to be made at the June meeting with 60% of surveyed economists by Reuters not looking for the Bank to unveil a relaunch on QE this year. That said, the figure of 60% is down from around 85% seen in June and thus shows that an increasingly dovish ECB could tip the balance in favour of a resumption of bond purchases in 2019.
However, such a move is not expected to be made this month with some analysts suggesting that such a programme would likely follow any potential rate cuts, rather than precede them. Nonetheless, ABN AMRO suggest that if a tweak was to be made the statement could include a line stating that the Bank would “…re-start net asset purchases if necessary to ensure sustained convergence of inflation to levels that are below, but close to, 2% over the medium term”, with the Dutch bank noting that the current guidance only refers to re-investments.
GROWTH/TRADE: Risks surrounding the euro area growth outlook will likely remain classified as tilted to the downside with Citi highlighting that there are no signs of uncertainty dissipating.
INFLATION: This aspect of the statement will likely garner more attention than it has done in recent months given a recent source report suggesting that staff at the Bank are looking at a potential revamp of the ECB’s inflation goal in favour of a more ‘symmetrical’ approach. Such a move, could see policy set in a manner that would tolerate an above-target inflation rate in order to compensate for a prolonged period of persistently low inflation. Despite the current debate surrounding such a decision, the July meeting feels too premature for a move on this front; a view backed by Danske Bank who also make the point that it would need to be implemented on the basis that markets believe the ECB would be capable of such an over-shoot. Instead, this will like ly be afocus for the prospective Lagarde-era at the Bank.
PRESS CONFERENCE
In terms of the press conference (1330BST), the focus for Draghi’s opening remarks and line of questioning from journalists will likely centre around what measures (if any)/tweaks are unveiled at the policy announcement (1245BST). Note, this press conference will not be accompanied with ECB staff macroeconomic projections.
Rates – Should the ECB refrain from cutting rates (as forecast by economists) and as expected, tweak guidance to imply the possibility of lower rates, markets will be looking for any hints as to when such action could come with journalists likely to try and pin Draghi into naming a specific date (something which historically he has been keen to avoid) for an adjustment. In terms of a market outlook, 12bps worth of tightening is priced in by the September meeting and appears to very much be consensus amongst analysts. The September meeting, will allow policymakers to see what course of action the Fed takes, see how EZ data unfolds and the subsequent next round of ECB staff macroeconomic projections. Despite September being widely flagged as an opportune time
for the Bank to lower rates, Draghi will unlikely want to tie the hands of policymakers by being too suggestive of a reduction at the
end of Q3. Instead, the President could opt to hint that a discussion on the matter will take place at the September meeting (if it
hasn’t already), whilst overall conveying the message that policymakers stand ready to act as necessary to provide stimulus for the
Eurozone economy.
QE – Aside from potential easing via rate reductions, a resumption of the Bank’s QE programme will likely be used as another weapon in Draghi’s arsenal to reassure markets that the ECB has the tools to revive the Eurozone. As discussed above, this week’s meeting will likely be seen as too premature for the unveiling of such a programme. However, Draghi could hint that policymakers will not hesitate to act if needs be. In terms of an outlook, ABN AMRO expects policymakers to unveil a EUR 630bln QE package by December, to be implemented in January 2020 for a 9-month stretch (at a pace of EUR 70bln/month). Elsewhere, Citi suggest that QE of EUR 360bln over a 12-month period as part of a broader easing package, could have the support of a sizeable majority of Governing Council members. Any QE relaunch would likely draw scrutiny over purchase limitations, however, Citi suggest “…the self-imposed 33% issue/issuers share of government bonds that the ECB can hold is a matter of past preference, not a hard constraint for the future”. Finally, UBS suggest that such a programme could be unveiled at some stage but it is less of a done-deal than further rate reductions, with a decision on QE to likely be made on a more data-dependent approach which would require a deterioration in the Eurozone’s growth and inflation outlook.
Tiered rate system – With the Bank’s policy bias likely turning towards an easing one, the prospect of prolonged and deeper negative rates has seen increased focus on a potential tiered rate system. Over the past several months, policymakers have rebuffed the idea of implementing a tiered deposit rate system with the monetary policy case having seemingly not been made yet. Furthermore, a recent research piece by the ECB also concluded that the current system of negative rates has not impeded bank profitability. However, ahead of a potential impending rate cut at the Bank, this viewpoint will likely need to be revisited, as highlighted by the account of the June meeting which revealed “costs of negative rates outweighed by benefits, but this might not hold for lower rates or longer horizons”. With this in mind, some suggest that a tiered rate system is more a question of “when” rather than “if”. At this stage, there is very little evidence to suggest that the technical work on what such a system should look like or how it will be implemented has been carried out. However, looking ahead, Danske Bank look for a tiered system to be unveiled in September as part of a broader policy package which will aim to “ensure the average deposit rate paid by banks to the ECB remains close to the current level of just shy of -40bps”. Elsewhere, Rabobank believe “designing a tiered deposit rate is quite complex, and we are doubtful that the ECB would go through this trouble just for one or two rate cuts”. As such, once mitigating measures are in place, Rabo “see little obstacles in the way of further rate cuts”.
Overall, this week’s meeting is likely to be a staging exercise for Draghi et al with greater measures to come in September in the form of a broader easing package. Nonetheless, in the interim, the main message will likely be that policymakers will use all flexibility within their toolkit to fulfil their mandate. However, market participants must be cautioned that Draghi has had a tendency to try and over-deliver on market expectations and therefore investors should not discount the possibility of a more detailed announcement this week.
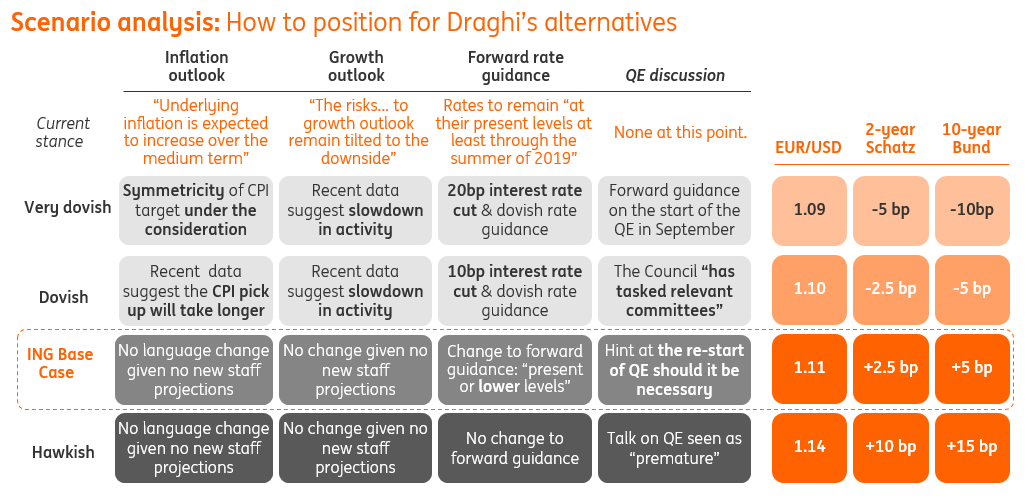
MARKET REACTION
Please see below for ING’s ECB Scenario Analysis
via ZeroHedge News https://ift.tt/2SD1jpw Tyler Durden
Once again, the federal district courts of Northern California are stymieing President Trump’s immigration agenda. This time, a San Francisco judge who was nominated to the bench by Obama has blocked President Trump from enforcing a new rule that would dramatically limit the number of migrants allowed to apply for asylum at the southern border.
Judge Jon Tigar issued a preliminary injunction blocking the rule, which would require asylum seekers to first pursue an asylum claim in a third country (and presumably be denied) before they can pursue asylum in the US. The rule would effectively force migrants from Central America to seek protection in Mexico before they can apply for asylum in the US. Earlier in the day, Washington DC district judge Timothy Kelly issued a different ruling where he declined to block the rule in a separate lawsuit brought by pro-immigration groups. But Tigar’s decision supersedes Kelly’s, Reuters reports.
Immigrants waiting to apply for asylum in Mexico
Tigar’s ruling doesn’t kill the Trump Administration’s rule outright – it’s simply suspended pending future rulings by succeeding federal judges. Much of the administration’s immigration agenda is still tied up in the courts.
While Trump and his administration were quick to celebrate Kelly’s decision, immigration groups and other groups like the SPLC that are challenging the ban praised Tigar’s ruling.
“Today’s ruling is an important victory for incredibly vulnerable individuals and families,” said Melissa Crow, an attorney from the Southern Poverty Law Center – one of the groups challenging the ban – in a statement.
The Trump Administration believes most of the asylum claims being made at the southern border are illegitimate, and that families use asylum as a way to gain entry to the country – then they disappear after they’re released to await their first immigration hearing. The vast majority – some 90% – never show up.
During a hour-long hearing on Wednesday, Tigar said he was struck by the dangers faced by people passing through Mexico – repudiating the Trump Administration’s argument that Mexico should be considered a ‘safe haven’
“The administrative record about the dangers faced by persons transiting through Mexico and the inadequacy of the asylum system there … is stunning,” Tigar said from bench.
This isn’t the first Trump immigration rule that Tigar has blocked. In November, he struck down a different asylum ban that attempted to stop all migrants crossing illegally into the US. But Trump has been ramping up his immigration policy efforts as the crisis at the border rages and immigration looks like it will be a critical factor in the 2020 race. Last week, the administration introduced another rule that would expedite deportations for immigrants who have crossed illegally into the US over the last two years.
Warren Buffett has dodged a bullet: the winner of this year’s “Lunch with Warren” charity auction has delayed the event – possibly indefinitely – after he and several of his employees were reportedly not allowed to leave mainland China. Justin Sun, the 29-yearr-old founder of the Tron Foundation, said he had come down with a ‘very painful’ case of kidney stones. But in a Weibo post published on Thursday that sounded like a forced apology, Sun apologized for “excessively” promoting the lunch, and for setting a “bad example” for the public.
In a lengthy post on Weibo, Sun, who turns 29 this month, said he acted immaturely and set a bad example for the public while “excessively” promoting the event. “It has produced a lot of consequences that I completely did not expect,” he said, without elaborating on what they were.
Hours earlier, Sun sent out public invitations to other crypto evangelists over social media. Perhaps Sun struck a nerve in a country which, only 30 years ago, might have condemned Buffett as a Western capitalist devil. But in modern China, where “to be rich is glorious” this seems unlikely, according to Bloomberg.
Instead, it’s more likely that Chinese authorities have uncovered some kind of fraud or other wrongdoing at Tron. Or, since Beijing has become increasingly hostile to the crypto industry over the pat year, the efforts to isolate Sun are part of a broader crackdown.
Rumors on Chinese social media suggest Sun and his team were denied permission to leave the country when they tried to travel to San Francisco, where this year’s lunch was slated to be held (in the past, the lunch has been held in New York). The Tron employees were reportedly only released when they promised not to attend the lunch with Buffett.
None of the parties involved – not Sun, Buffett or Beijing – responded to Bloomberg’s requests for comment.
The delay/possible cancellation is the first time in the history of ‘Lunch with Warren’ that the winning bidder has put off the lunch. Sun paid a record $4.57 million for his winning bid, and said he would use the opportunity to try and “educate” Buffett about crypto. Of course, Buffett has famously denounced cryptos as an asset class, calling bitcoin “rat poison squared”, a “delusion” and “a gambling device.” We joked at the time that Buffett was probably dreading this day – even though the Oracle of Omaha has softened his stance on the crypto space recently; he said at a conference not long ago that ‘blockchain’ was “ingenious” and would likely one day pay off for investors.
Sun, for his part, tried to calm the market’s nerves by posting video supposedly showing him in San Francisco. But few were convinced, and the price of a single Tron token weakened by 18% this week in response.
via ZeroHedge News https://ift.tt/2M7n8wi Tyler Durden