Authored by Elizabeth Vos via ConsortiumNews.com,
One year ago Thursday, Ecuador’s government under President Lenin Moreno silenced Julian Assange.
WikiLeaks wrote on Twitter Wednesday:
“… March 28, marks one year that WikiLeakspublisher Julian Assange has been illegally gagged from doing journalism – any writing that expresses a ‘political opinion’? even on his own treatment, after pressure from the U.S. on Ecuador.”
On this date in 2018 Moreno imposed on Assange what Human Rights Watch’s legal counsel Dinah Pokempner described as looking “more and more like solitary confinement.” Moreno cut off Assange’s online access and restricted visitors to the Ecuador embassy in London where Assange has had legal political asylum since 2012.
Moreno cited Assange’s critical social media remarks about Ecuador’s allies, the U.S. and Spain. Assange’s near-total isolation, with the exception of visits from legal counsel during week days, has been augmented by the Ecuadorian government’s imposition of a complex “protocol,” which, although eased slightly in recent months in respect of visits allowed, has not improved Assange’s overall status over the last 12 months. In some respects, it seems to have worsened.
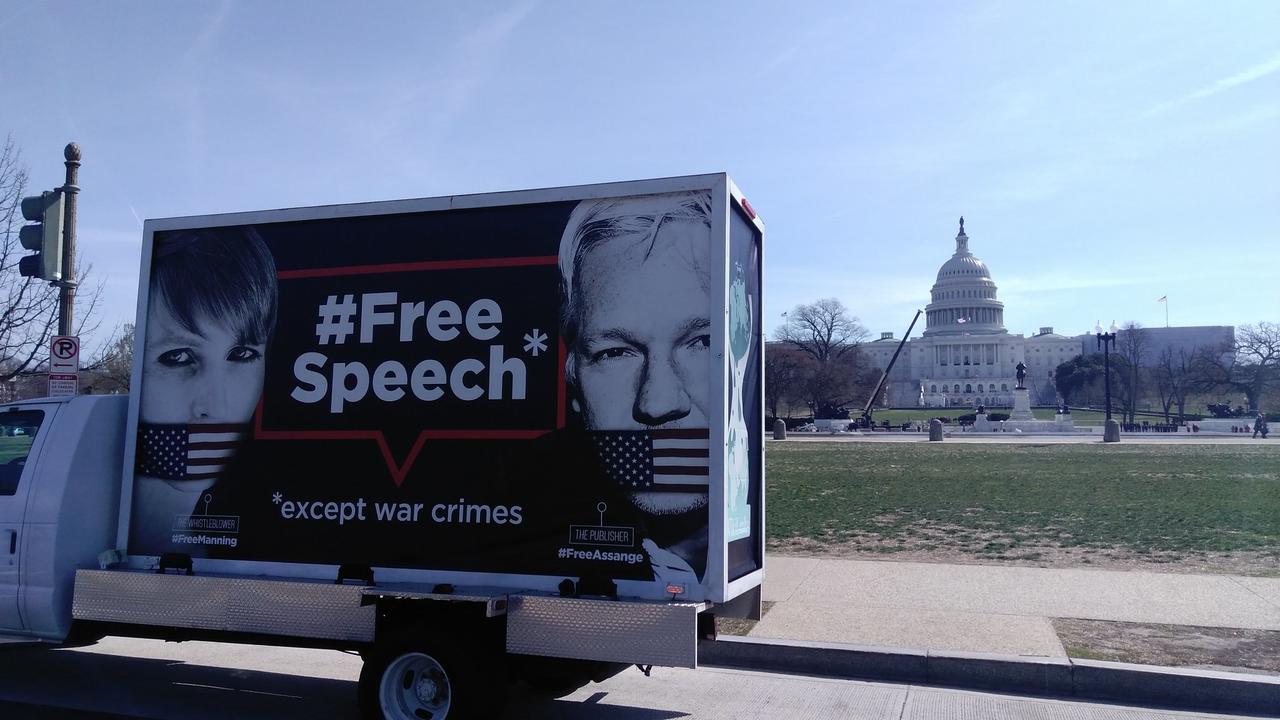
Truck in D.C.,March 28, 2019. (Pamela Drew, Twitter)
WikiLeaks’ Courage Foundation described the terms of the protocol:
“Explicit threats to revoke Julian’s asylum if he, or any visitors, breach or are perceived to breach, any of the 28 ‘rules’ in the protocol. The ‘protocol’ forbids Julian from undertaking journalism and expressing his opinions, under threat of losing his asylum. The rules also state that the embassy can seize Julian’s property or his visitors’ property and hand these to the UK police, and report visitors to the UK authorities. The protocol also requires visitors to provide the IMEI codes and serial numbers of electronic devices used inside the embassy, and states that this private information may be shared with undisclosed agencies.”
The protocol does not spell out all the restrictions imposed on Assange and his supporters over the last year. A bombshell report by Cassandra Fairbanks on Tuesday revealed Ecuador’s demand that Assange and his lawyer be scanned before entering a “highly bugged and monitored” conference room with a journalist.
Describing her experience, Fairbanks said she had been: “Locked in a cold, surveilled room for over an hour by Ecuadorian officials, as a furious argument raged between the country’s ambassador and Julian Assange.”
The argument reportedly centered on Assange’s refusal to submit to a body scan in order to enter the conference room, where Fairbanks waited. Fairbanks reported that Assange shouted at the Ecuadorian ambassador, accusing the latter of acting as an agent of the United States government. The ambassador then told Assange to “shut up,” she reported.
WikiLeaks, writing via social media, has confirmed the “factual elements” of Fairbanks’ story.
Subject to Body Scans
Assange and his lawyers are now subjected to body scans in addition to conditions that, in the opinion of Ecuador’s former President Rafael Correa, already amounted to torture. In his argument with the ambassador, Assange protested that he was being treated like “a prisoner” and not a political asylee.
Assange’s supporters have claimed that rather than risk a public-relations fallout by removing Assange from the embassy by force, the U.S., UK and Ecuador are acting to hasten Assange’s physical and mental demise in hopes he will be forced to leave the embassy or become incapacitated.
WikiLeaks’ new Editor-in-Chief Kristinn Hrafnsson told RT in a televised interview: “We, of course, know that Lenin Moreno in Ecuador is willing to sacrifice Julian Assange for debt relief, that was reported by The New York Times in early December.”
The Courage Foundation summarized Assange’s plight:
“Julian Assange is the only publisher and journalist in the EU formally found to be arbitrarily detained by the UN human rights system. He is in dire circumstances, faces imminent termination of his asylum, extradition and life in a US prison for publishing the truth about US wars, and has been gagged and isolated since 28 March 2018. He has been kept in the UK from his young family in France for eight years (where he lived before being arbitrarily detained in the UK), has not seen the sun for almost seven years, and has been found by the United Nations to be subjected to “cruel, inhuman and degrading treatment.”
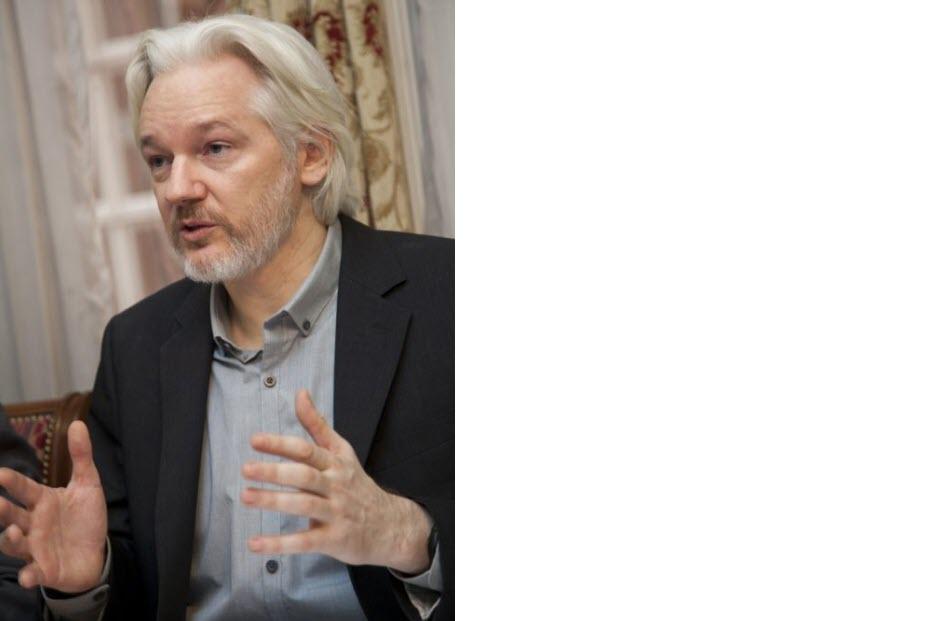
Julian Assange. (Wikimedia Commons)
On Thursday Ecuador’s foreign minister threatened additional “‘firm and sustained’ measures against Assange after@WikiLeaks reports on the@INAPapers offshore scandal involving the president and his brother,” WikiLeakstweeted.
Since Assange was cut off from the outside world, efforts by the United States to prosecute Assange and WikiLeaks have been exposed. That Assange had already been charged was inadvertently revealedby a cut-and-paste error by the U.S. attorney’s office of the Eastern District of Virginia. The prosecution of the publisher pertains to WikiLeaks’ Chelsea Manning-era publications, and possibly Vault 7, not to the 2016 U.S. presidential election.
Manning Back in Jail
Thursday also marks the passage of Manning’s third week of imprisonment for her refusal to testify before a grand jury convened to prosecute WikiLeaks and Assange. Since being jailed, Manning’s supporters have reported that she has been kept in solitary confinement, where she will remain indefinitely until either the grand jury is disbanded or she agrees to testify without legal counsel and under a veil of secrecy.
Presumably, prosecutors hope to coerce Manning to backtrack on her testimony during her court-martial in 2013, in which she testified she acted alone, and instead indicate that Assange worked to incite or aid her in retrieving leaked material. Pulitzer Prize-winning journalist Chris Hedges described the situation as “the new inquisition.”
The end of the collusion conspiracy theory came as a victory for Assange and WikiLeaks. Special Counsel Robert Mueller made it clear there would be no indictments against either for their roles during the 2016 election.
However, the damage has been significant, with Assange unable to comment and WikiLeaks saddled with residual, unresolved smears. Over the last three years, cable news pundits endlessly vilifiedWikiLeaks and Assange by claiming the publisher coordinated with the Trump presidential campaign and became an instrument of the Kremlin in 2016.
Meanwhile, The Guardian has allowed its outlandish story alleging that secret meetings took place between Assange and Paul Manafort in Ecuador’s London embassy three times between 2013 and 2016 to go un-retracted and unexplained. WikiLeaks has called the story “an intentional front page fabrication,” and launched a Gofundme campaign to raise funds to sue the newspaper. Hrafnssonconfirmed the lawsuit is progressing.
On March 28 last year, friends and supporters of Assange spontaneously came together on hearing the news that he had been cut off from the outside world by the Ecuadorian government. For more than 10 hours, participants and viewers from across the planet raised their voices to protest the injustice of Assange having been gagged.
The initial “Reconnect Julian“ event led to subsequent “Unity4J“ vigils. Over the past 12 months, demonstrations of support have unfolded across the globe, including many events organized by theSocialist Equality Party and a plethora of unaffiliated actions in solidarity with Assange.
The WikiLeaks founder’s mother, Christine Assange, wrote via social media: “At critical times throughout history, leaders have emerged to lead the fight for freedom. They risk their lives and liberty to do so. Most of us don’t have their courage, but we can unite to protect them.#FreeAssange #FreeManning“
Earlier Thursday, trucks emblazoned with supportive messages for Assange and Manning appeared inLondon and Washington, D.C.
via ZeroHedge News https://ift.tt/2CMEnNR Tyler Durden