With today's biggest drop in stocks in over 4 months, we are reminded of three recent charts that raise considerable questions as to the path forward. From Mclellan's 1928 analog to Hussman's bubble trajectory and the extremes of bullish sentiment, this week marks a 'line in the sand' for bulls to take this to the Hendry moon or for it not to be different this time…
Mclellan's 1929 Analog…

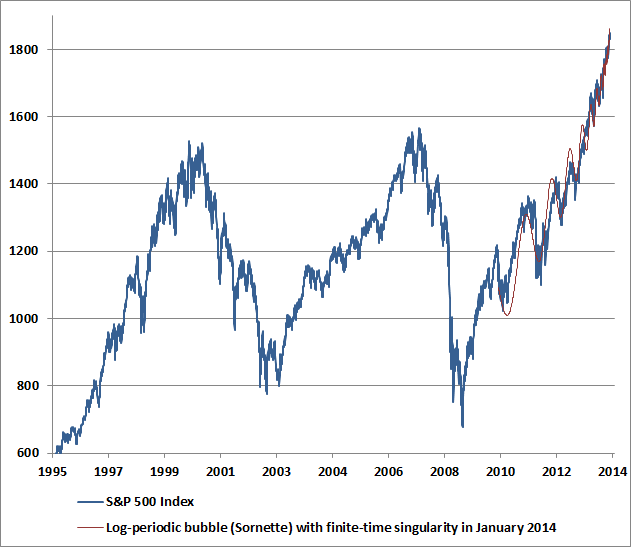
Hussman's Bubble Trajectory…
Based on the fidelity of the recent advance to this price structure, we estimate the “finite-time singularity” of the present log-periodic bubble to occur (or to have occurred) somewhere between December 31, 2013 and January 13, 2014.
And the Market's Most Bullish Bias On Record…

Is it any wonder there are less BFTATH-ers left?
Charts: John Hussman, John Mclellan, and @Not_Jim_Cramer
![]()
     |
via Zero Hedge http://feedproxy.google.com/~r/zerohedge/feed/~3/Qe75c3hSR_M/story01.htm Tyler Durden