OK. Not a bear market quite yet.
The official level of the S&P500 for the current sell-off to morph into a bear market (down 20 percent from local high) is 2298.30, down 14.92 percent from today’s close. The official correction level, 2585.58, was hit and broken on February 8th.
We believe there will be a stock bear market in 2018 but less confident on its depth and length, however. We will turn that page, if, and when, we get there.
Key Data and Levels
The following table is updated with some key economic indicators and S&P target levels.

Recall in our earlier posts (see here and here), there have been three other massive volatility shocks since 1950, similar to the one the S&P500 just experienced.
1) 1955: Ike’s heart attack;
2) 1962: the “Kennedy slide” or JFK bear market; and
3) 1987: the “crash” bear market, which lasted only 38 days.
We threw out Ike’s heart attack as it was not a prelude to a bear market. The S&P500 recovered shortly after the sharp Monday sell-off after President Eisenhower had a heart attack on the 8th hole at Cherry Hills Country Club the prior Saturday afternoon.
Bear Markets Do Not Happen Without Recession?
To that, we say, poppycock! Time to tune out the cheerleaders.
The data are clear. The U.S. economy thrived during the 1962 bear market, growing at more than 6 percent, on average. The economy grew at 3 ½ percent in 1987. No recession, not even close, in those two bears.
The Great Moderation
Before the early 1980’s, the U.S. economy experienced much higher short-term volatility. The FRED table illustrates the dampening of volatility over the past 30 years, though at much lower growth rates. Economists refer to this recent period as The Great Moderation.
Debt Concerns
The current U.S. government debt-to-GDP ratio is more than double what is was in both the 1987 and 1962 bear markets. It is the crux of the current sell-off, in our opinion.
We sense that the global markets are growing increasingly concerned about high debt levels in a rising interest rate environment. Couple that with Washington’s fiscal promiscuity and extreme valuations and overbought conditions, and the ingredients of a bear market are baked in. It is also probably why the dollar is so weak.
We can make a very bearish case with debt doom loops and all kinds of macro instability, but won’t go there until price discovery takes us there.
Nevertheless, keep these words on your radar: fette Schwänze, colas gordas, grosses queues, or in simple English, Fat Tails. As volatility spikes, girth increases.
Recent Price Action
Notice how the market traded today. Up big then reversed as the 10-year yield spiked through 2.95 percent.
Interest Rates
Interest rates were not a concern in 1962 as the data show the 10-year yield declined 30 basis points during the bear market. Not the case in 1987, however, where rising interest rates and a weak dollar culminated in the October 19th global stock market crash.
Some possible reasons for the stock market crash of 1987 and for the rapid psychological shift of the market participants:
- rapidly increasing short term US interest rates (the annualized yield of 3M US Treasury Bills increased from 5.30% on 20.01.1987 to the high print of the year: 7.19% on 14.10.1987 – an increase of 189 basis points)
- rapidly increasing long term US interest rates (the yield of 30Y US Treasury Bonds increased from the low print of the year: 7.29% on 09.01.1987 to the high print of the year: 10.25% on 19.10.1987 – an increase of 296 basis points)
- weakening US dollar (=falling against most major foreign currencies)
- deteriorating US current account deficit
- escalating US government debt
- very high price-earnings-ratios (P/E)
- very low dividend yields
- very bullish investor sentiment figures (= too much optimism by investors)
- deteriorating “market breadth” (e.g.: weak Advance-Decline-Line)
Source: www.sniper.at
Wow, sounds eerily familiar, no?
Market Recovery Falters
The S&P could not hold the key 61.8 percent Fibo level at 2742.92 nor 2728.08, its 50-day moving average.
Moreover, the index closed today just below the 50 percent Fibonacci retracement level.
Normal Path To A Bear Market
At Friday’s intraday high, the index had retraced 65.18 percent of its first leg down, very close to the 1962 (76.42 percent) and 1987 (69.49 percent) retracements (see table).
In other words, last week’s recovery was a normal bounce off the initial lows on the path to a bear market.
Levels To Watch
The next critical levels on the downside for the S&P is the 38.2 percent Fibo at 2662.64 and 2653.31, the 100-day moving average.
On the upside, 2702.78, the 50 percent Fibo. Then some clustering in a range of 2730-2755: the 50-day at 2728..08; the 20-day at 2737.92; the 61.8 percent Fib at 2742.92; and, most important, Friday’s high at 2754.42, the new marker.
Also watch the bearish cross as the 20-day moving average trades through the 50-day, which is not far off.
A 1962-1987 Hybrid Bear Market?
Though the S&P500 has the same theme, set-up, and backdrop as the JFK post-election rally and bear market in 1961-62, the fundamentals drivers of the current correction are very similar to those of the 1987 rout (see above).
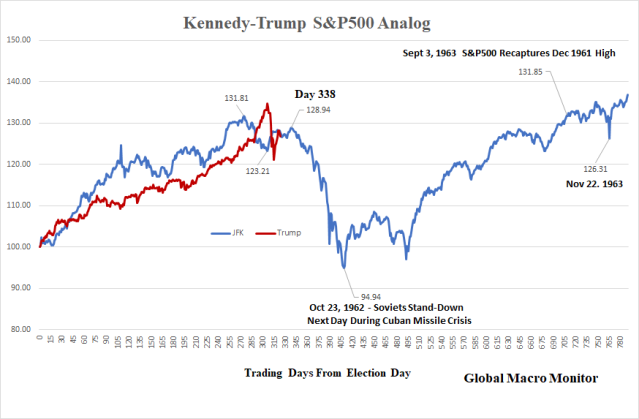
As of today’s close, the Trump and JFK S&P500 sit right on top of each other, 0.68 percent apart, 323 trading days after election day.
Recovery
Though the 1987 bear market bottomed the day after the crash, the S&P500 did not recover its August 25, 1987, high until July 21, 1989. It could be sometime before the index makes a new high. Or maybe not.
Stay tuned.
Appendix:

via Zero Hedge http://ift.tt/2GFcsie Tyler Durden