In 1999, I called one of my professors from graduate school who taught monetary theory. Let’s call him Joe.
Here’s a short summary of the conversation:
Me: Professor Joe, can you believe how big this stock market bubble has grown?
Prof Joe: It’s a new economy, [Gregor].
I put down the phone in astonishment. Professor Joe drank the kool-aide.
In hindsight, indeed he was right, but not for the reasons he had concluded.
The economy did change in the 1990’s as is illustrated in the charts below. Not, however, for the reason Wall Street was touting to justify extreme asset valuations.
The New (Wealth Driven Asset) Economy
Household net worth, or asset prices, became more volatile and a much bigger driver of economic growth as illustrated in the charts below.
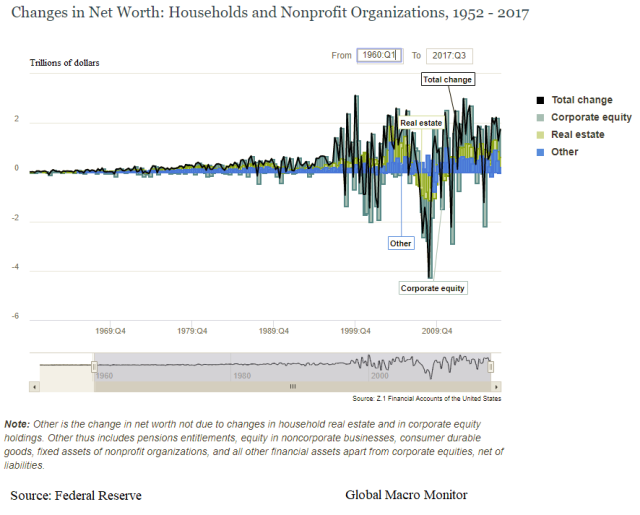
The second chart normalizes the data by gross domestic product.
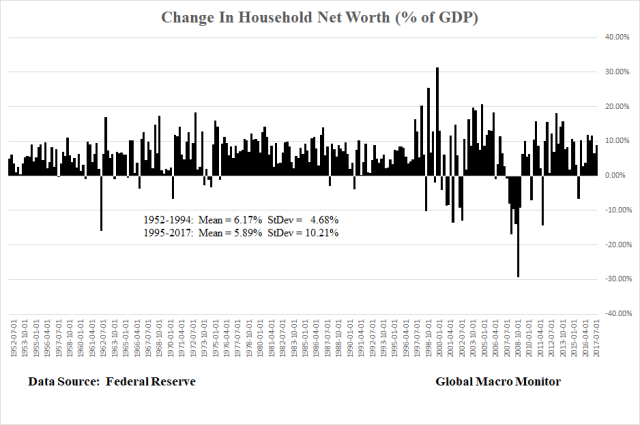
The average change in household net worth on a quarterly basis relative to GDP from 1952 to 1994 was 6.17 percent with a standard deviation of 4.68 percent. Since 1995, the average change has been 5.89 percent, but the standard deviation has more than doubled to 10.21 percent. The similar mean of the two periods most likely reflects the mean reverting nature of asset returns.
Why The Change?
We posted a couple reasons we believe were the cause for this financial and economic structural shift in the mid-90’s:
1) Moral Hazard
First, moral hazard was internalized by traders and investors. Though the “Greenspan put” was born almost a decade earlier after the 1987 stock market crash, the 1994-1995 monetary tightening culminated in the collapse of the Mexican peso and set off the Tequila Crisis in emerging markets. The U.S. government had to step in and bailout Mexico with $50 billion-plus in loans…
Second, the rise of the internet and technological changes fundamentally changed the U.S. economy and its payments system. We do not have time to research the specifics, but we suspect it is reflected in the secular decline in money velocity which peaked in the 1990’s and has fallen ever since with the exception of a small bump just before the credit/bubble popped…
3) Asset Markets Became The Economy
The labor shock caused by the entry of China and Eastern Europe into the global economy contributed to a significant hollowing out the U.S. middle class as policymakers failed to compensate the losers of free trade. They were effectively swept under the rug as globalization took off, corporate profits soared, and consumer prices were held in check with cheap imports. This effect culminated in the 2016 political Black Swan.
Fundamental Shift In Aggregate Demand
It is our contention the decline in the purchasing power of a relatively large swath of Americans, with a relatively high propensity to consume, were crippled and when coupled with the rapid rise in income and wealth inequality aggregate demand has become insufficient to drive economic growth at an adequate pace… – Global Macro Monitor, Feb 5, 2018
If you haven’t seen the post, Start Of A Mean “Mean Reversion” In Stock Values?, run don’t walk to read it.
Upshot?
Our hypothesis that the economy is becoming more influenced by asset prices and debt, and to a lesser extent by income (which is endogenous) due to a secular stagnation in real wages, is a work in progress.
Moreover, the whole inflation/deflation debate has morphed into a dialectic, which is path dependent on asset prices. Stocks values move up to a critical level (which holders likely believe to be permanent) that stirs the animal spirits and kicks economic growth into gear. Inflation eventually becomes an issue moving interest rates higher. The asset bubble pops, stock values go down, confidence declines, aggregate demand softens and deflation now becomes the headline issue. Wash, rinse, repeat.
In addition, each asset cycle results in greater divergent of valuations from the economy (see charts below) as the wealth disparity increases.


The marginal propensity to consume is much higher for middle and working class consumers. As wealth becomes more concentrated at the higher end, aggregate demand weakens on a relative basis and more theoretical wealth is needed to generate the same demand.
“The wealthy buy Apple stock with their gains, whereas the middle class buy apples.”
We have run some preliminary statistical analysis and regressions and thus far the data do support our priors. Back to you when we complete the analysis.
via Zero Hedge http://ift.tt/2oSwGy3 Tyler Durden