Authored by Sven Henrich via NorthmanTrader.com,
Sins of the Past
Yesterday I had an opportunity to speak with Mike Santoli on Trading Nation discussing some chart patterns that suggest markets may be repeating the sins of last year. I wanted to expand a bit more on the 2 charts Mike and I discussed in context of the uncertainty surrounding the China trade deal.

From my successful China deal is absolutely necessary very soon or markets may be confronted with major topping patterns. The primary concern: Markets were led to believe that a deal was imminent and had priced in every tweet of “imminent”, “constructive” and “going well”.
Markets have not priced in a protracted trade war with both parties digging in their heels and putting themselves in a position where making a deal becomes more difficult or risk losing face.
Risk is expanding tariffs producing consumer price inflation and/or margin compression for US companies coupled with additional investment uncertainty. Indeed, given continued weak global trade data a failure to reach a deal may be the trigger for a global recession to come.
The technical context of US indices suggest that so far markets appear to repeat the sins of last year.
For reference here’s the clip of the interview and then some more color/context of the charts below.
Charts suggest markets could ‘repeat the sins’ of 2018 from CNBC.
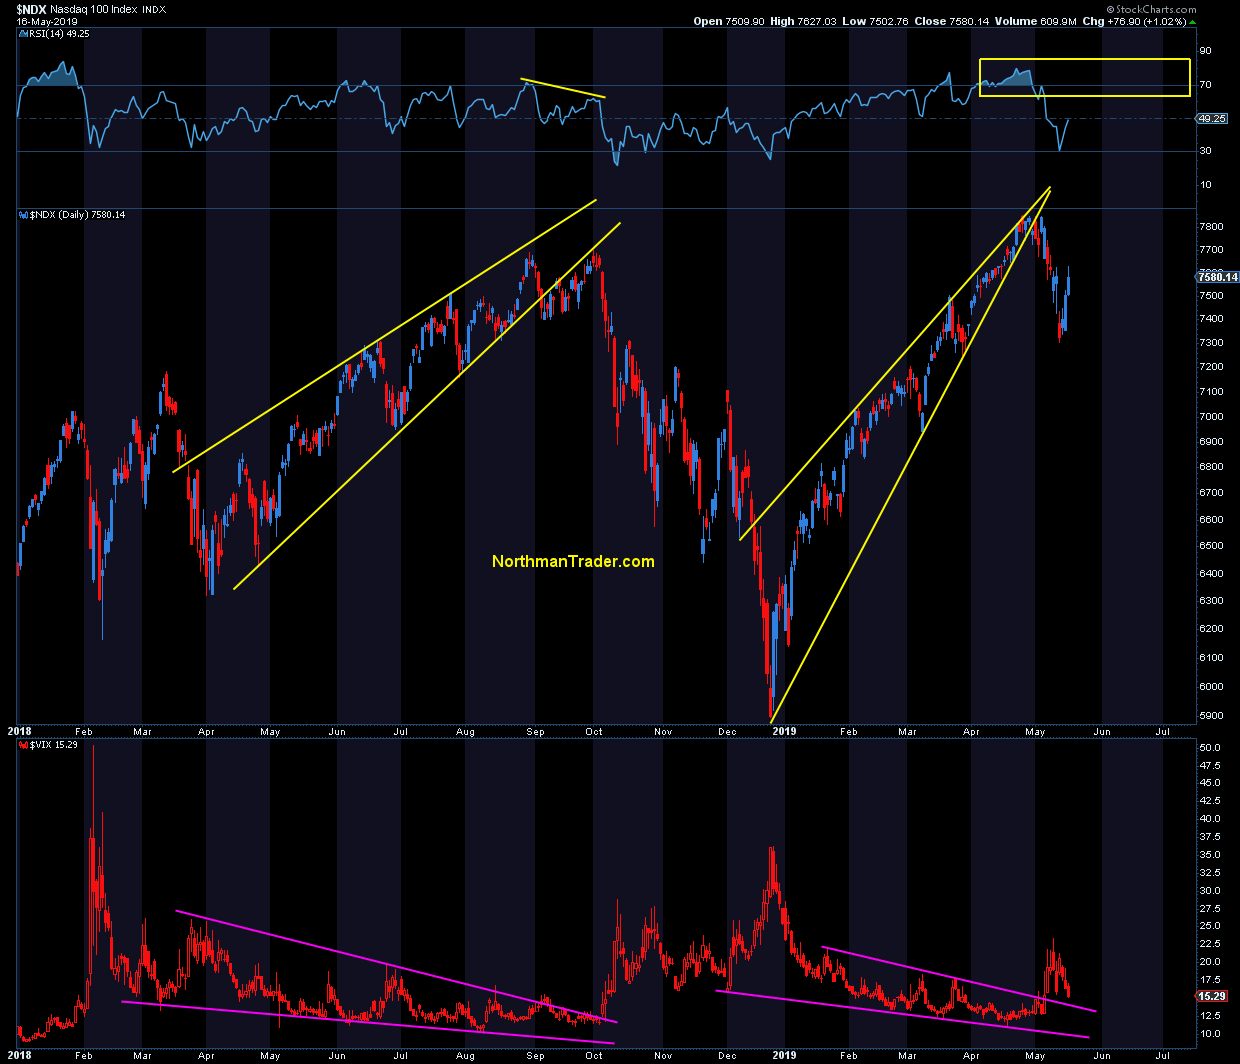
Consider a complete structural repeat of what we saw last year: New highs on a negative divergence led by $NDX, seeing price advance in a tight rising wedge pattern that has once again broken to the downside. At the same $VIX has once again broken out of its volatility compression pattern, an almost like for like repeat so far:
Now these highs are gone and have so far proven to be a fake out. New highs have come on $SPX and $NDX and were driven by select tech mega cap $FAANG stocks again.
The larger market has sent a different message: No new highs on key indices such as small caps, $DJIA, $Wilshire, $NYSE and banks. All of these index charts have not proven the bull case.
In fact if you compare their performances to the January highs of 2018 they are all 3%-17% below these highs from 15 months ago suggesting that, as impressive as this rally off of the December lows has been, it’s actually much weaker underneath.
Take a close look at the border $SPX chart (going back to 2015, includes 200MA, and shows megaphone pattern and 2 broken rising wedges):

Firstly recognize we’ve had extremely wide price ranges in both directions over the past 15 months. This is not a stable ascending bull market. It’s erratic action at the end of a very long business cycle.
Second, note that the pattern has formed a megaphone of widening price ranges.
The good news here is that the pattern has room higher into the 3000-3100 range, but will likely require a successful China deal to hit that upper range. No new highs without a China deal appears to be the message here.
The bad news here is that $SPX, like $NDX has broken another rising wedge pattern as in last year and has also rejected these marginal new highs. Last year that wedge break ended up producing a lot of chop around the 200MA before breaking lower.
Without a China deal markets may be facing a similar scenario and a sustained break below the 200MA could technically open a move toward the lower trend line on the megaphone pattern (25%-30% off the highs) especially if macro data deteriorates further and earnings estimates have to be reduced.
Bottomline, we’re in a period of great instability of prices and patterns, the bull case has not been proven on a number of index charts that are showing potential topping patterns.
China deal or else?
* * *
For the latest public analysis please visit NorthmanTrader. To subscribe to our market products please visit Services.
via ZeroHedge News http://bit.ly/2WQ5EXM Tyler Durden