How expensive is the S&P? Loaded question but thanks for asking.
Macro Metrics
Here at the Global Macro Monitor, we lean toward macro metrics to get a sense of the historical valuation of the stock market and heavily discount — no, entirely dismiss — the “this time is different” nonsense to justify an expensive market. Macro metrics do not allow the divorce of market valuation from the economic fundamentals.
Because stocks like to go up and have risen and generated a positive return in 67 of the past 98 years since 1921, it behooves long-term investors to rarely touch their investment portfolio and go to cash or become overly defensive.
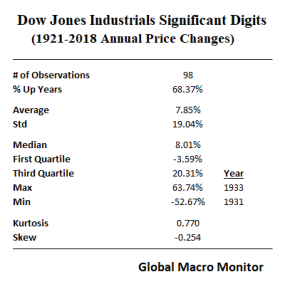
However, there are a few times in an investor’s life when an extraordinary large cash position is warranted. We believe this is one of those times.
Anybody who believes a rules-based multilateral order, our globalised economy, or even harmonious international relations, are likely to survive this conflict [U.S. v. China] is deluded. – Martin Wolf, FT
Setting aside our serious concerns about the secular shift in the global geopolitical and economic tectonic plates coupled with ugly. U.S. domestic politics, which will have very negative consequences for stocks, in our opinion, let us focus just on market valuation in the post.
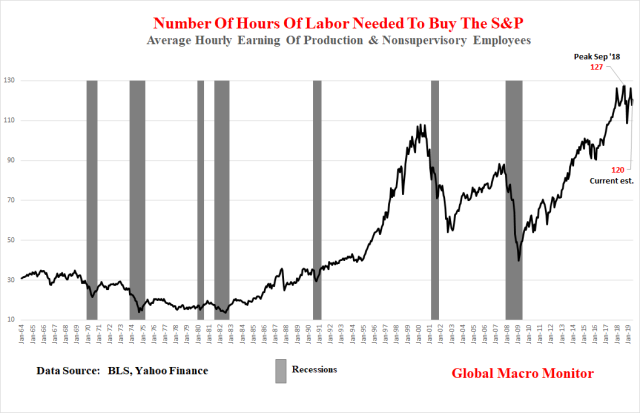
Hours Of Work Needed To Buy S&P
One valuation metric we like, which often flies under the radar, is the number of hours of work needed to purchase the S&P. We deflated the monthly S&P500 time series by the average hourly earnings of production and nonsupervisory employees and found the S&P500 is currently at a level of extreme valuation.
Stocks eventually have to track the economy but do often diverge for periods longer than most short-sellers can remain solvent. We respect that and tend not to fight the market until it shows signs of cracking. Easier said than done, however, as the algos have mastered the art of setting bear traps. Monday was a case in point. They are not fun.
And, yes, we get it, the average Jane Doe who earns the average hourly earning doesn’t buy stocks but a large portion of the economy is made up of average Jane.
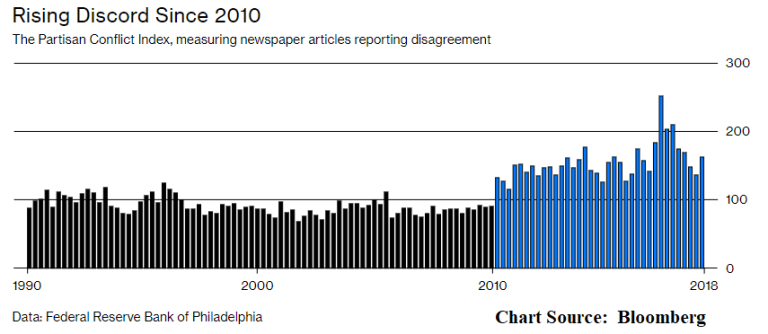
Politics
Moreover, if you need an illustration to quickly sum up the current political conflict in the U.S., go no further than the following chart. The data shows the obvious: the return on capital has rapidly outpaced the return to labor since 1990, which is another factor contributing to the Summer of Discontent.
Profits don’t grow to the sky and are subject to economic constraints. Squeezing labor costs to further increase margins creates not only political conflict but tips the economy into a nasty feedback loop of weak demand, lower capital spending, and more cowbellbuybacks. The end result is punk economic and top-line growth further forcing firms to increase margins by additional cost-cutting. Wash, rinse, repeat.
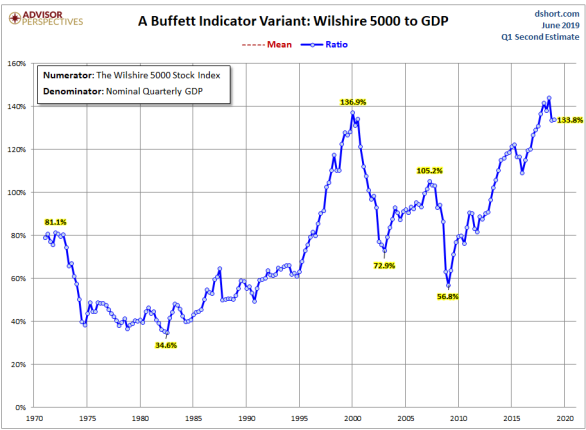
The Buffet Indicator
We also like the “Buffet Indicator” — market capitalization-to-GDP — tracked by Doug Short at Advisor Perspectives.
Market Cap to GDP is a long-term valuation indicator that has become popular in recent years, thanks to Warren Buffett. Back in 2001, he remarked in a Fortune Magazine interview that “it is probably the best single measure of where valuations stand at any given moment.” – Doug Short
This macro metric also illustrates stock valuations are at historical extremes.
Upshot
The stock market is at a historical extreme valuation measured by the above two macro metrics. Nevertheless, stock traders are super lathered up and have taken the Dow up over 700 points in the past two days on the belief the Fed will, once again, ride to the rescue.
We don’t know how much higher stocks can go on the Fed crack but have learned not to fight it.
We do know, however, secular and structural forces are beginning to converge on the economy and market, such as the ugly geo- and domestic politics, too much public, and corporate debt, and shrinking global trade, just to name a few. These problems need to be addressed through structural reform, compromise, and cooperation and cannot be fixed with simple cyclical monetary policies, such as interest rate cuts and more quantitative easing (QE).
Valuations must come way down for a new round of QE to have any hope of moving the economic needle. If the Fed begins easing monetary policy in the next few months as markets have priced — > 70 percent probability of July rate cut — it will do so with the lowest starting policy rates and, unless markets crash in the next few weeks, the highest starting asset values in its history. The central bank will have very few moves before it finds itself in checkmate, in our opinion.
When will traders and investors internalize this? You decide.
via ZeroHedge News http://bit.ly/2EVjxwG Tyler Durden