Technically, no.
Spiritually? Not sure, but definitely, there’s is something happening here. What it is ain’t exactly clear.

S&P Flat For Past 17 Months
Even with all the Sturm und Drang since the massive volatility shock of January 2018— which includes a technical bear market > 20 percent sell-off from September 21st to December 26th and a ripping Fed-led 26 percent rally from December 26th to May 1st — the S&P is up only 1.52 percent. Stunning and exhausting.
It feels as if we have traveled Around the World in 80 354 Trading Days and yet have gone absolutely nowhere.
Bull Market Tops
We do feel stocks are topping and are in, or about to enter a major bear market. For long-term investors, rarely does it pay to try and time a bear market but given the rising geopolitical and economic risks, we believe this is one of those times.
Stocks do like to go up,
…the Dow has generated positive returns 68 percent of the years since 1921, and the S&P more than 72 percent since 1951. – GMM, March 22nd
Yet, there have been two brutal bear markets already in this young century, which took the S&P500 down 51 percent from March 2000 to October 2002, and 58 percent from October 2007 to March 2009.
Topping Process
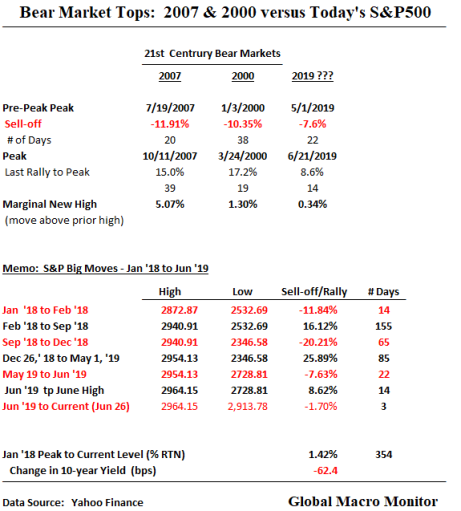
In both bears, the S&P500 made an initial top, sold off 10-12 percent over 20-40 trading days, experienced a reflex rally of 15-17 percent over 20-40 days, before rolling over for good. The data in the table and chart reflect the topping process of these markets compared with the price action of the current S&P500.
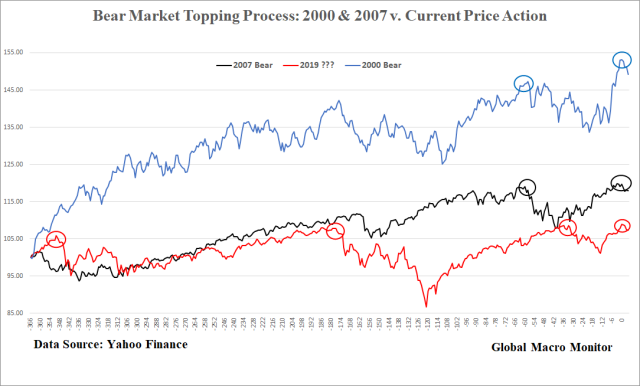
The Four Tops?
The chart illustrates the two bear markets 366 days prior to making their respective tops and then 4 days after. It overlays the current S&P (red line), which topped on June 21st.
Nobody knows if June 21st was THE top, which would be 3.1 percent above the first made on January 26, 2018. Our best guess, however, is given President Trump’s low approval ratings moving into an election year, he is highly motivated to kraft some sort of truce or Potemkin China trade, which will be sold as the “greatest deal ever,” to give the market one last boost.
An S&P top of around 3025-3060 would repeat the topping zip codes of past history.
Basing Or Freebasing?
A bear market could also unfold through time rather than price, where the index does nothing for years. If that’s the case, we are already 1 1/2 years in.
Conversely, the S&P could be just basing, working off a 10-year overbought condition and preparing for another big leg higher, boosted by more Fed liquidity.
Au contraire, comrades. It is our view, and we could be and often are wrong, the markets are freebasing on the expected Fed crack before overdosing and rolling over.
Watch The Key Levels
Only the market will reveal its true status so it’s important to monitor key levels. Let’s start with 2964.15, the all-time high, on the upside, which could easily be taken out if Trump and Xi kiss and make up in Osaka over the next few days.
On the downside, the 50-day and 20-day beckon in the 2970 range, which will be taken out faster than a hot knife through butter if either Trump or Xi pack it up and come home with no real resolution.

Pain Trade
Or, the market further lathers itself up on, say, a bad trade tape bomb out of Osaka, believing extra goodies will be served up by the Fed. Who said this business is easy?
Remember, folks, predicting short-term stock moves is really a mug’s game and only profitable for professional scalpers.
via ZeroHedge News https://ift.tt/2ZShQbx Tyler Durden