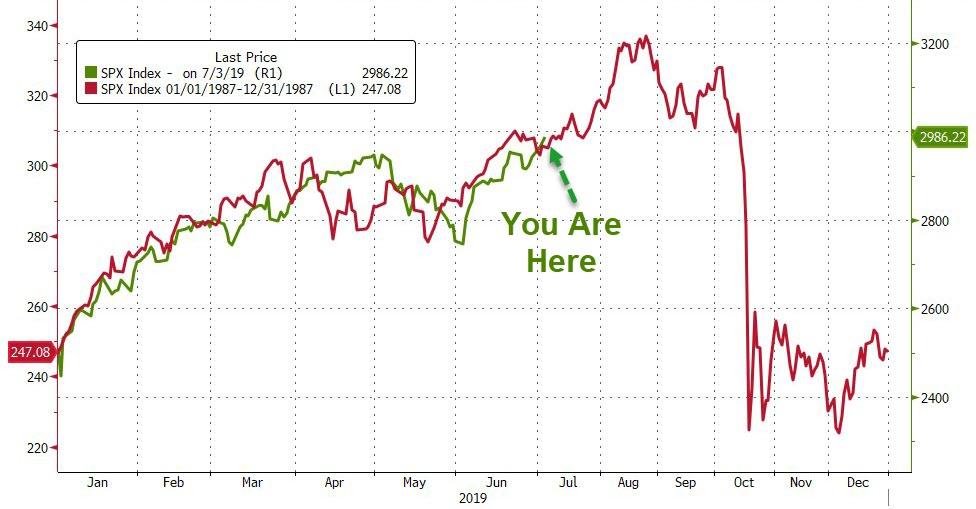
2019 is looking more like 1987 every day.
No, we’re not calling for an October crash… But if the S&P rallies another +12%, history does say to reduce US equity exposure. Up 30%-ish years aren’t uncommon. Up +40% years most certainly are. Looking further out, recall that 1988 and 1989 saw good S&P returns even though corporate earnings were flat. The reason: a more dovish Fed and lower long-term rates. That’s really why it feels like 1987 to us, but remember that the S&P today is a far cry from its old cyclical self back in the late 1980s. Lower rates help market valuations much more than fundamentals now.
We’ve been thinking a lot about 1987 over the past few days, because having been in the business back then we are feeling a bit of déjà vu. Why? Just look at the monthly performance numbers for the S&P 500, comparing 1987 to 2019:
-
January: +13.2% in 1987, 7.9% in 2019. Strong out of the box in both years…
-
February: +3.7% then, 3.0% this year. A nice follow through from a ripping January…
-
March: +2.6% then, +1.8% this year. Even more follow through…
-
Q1 returns: +20.4% then, 13.1% now. A whole year’s worth of returns in 90 days!
-
April: -1.5% then, +3.9% now. Not great in 1987, but 2019 seemed to want to catch up after lagging in Q1…
-
May: +0.6% then, -6.6% now. No “May flowers” this year, but 1987 was a bit punk as well…
-
June: +4.8% then, +6.9% now. And, back on track for both years…
-
Q2 returns: 3.8% then, 3.7% now. Almost exactly the same…
-
S&P 500 price return for the first half: 25.1% then, 18.3% now. Still lagging this year vs. 1987, but excellent performance nonetheless.
The bottom line is that both 1H 1987 and 1H 2019 posted above-average returns, in line with Jessica’s “Strong January” playbook that she updated last week. When the year kicks off with a bang, there is usually some strong follow-through for months after. Yes, 1987’s first half was stronger (+25%) than 2019’s (18%), but both well exceed the average total return for the S&P 500 (9.7% from 1969 – present).
Now, everyone knows October 1987 was bad, but the lead-up to that month still showed real strength:
-
July 1987: +4.8%
-
August 1987: +3.5%
-
September: -2.4%
-
Q3 returns: +5.8%
-
Price return through Q3: 32.2%
-
October: -21.8%
-
November: -8.5%
-
December: +7.3%
-
Q4 returns: -23.2%
So, after being up a stellar 32.2% through the first 3 quarters of 1987, the S&P ended the year with a just a 5.8% total return. Not awful, but a far cry from what US equities seemed to promise earlier in the year. Most of the difference came from one day – October 19 – when the S&P dropped by 20.5%, of course.
All this got us to wondering just how different the S&P 500 was in 1987 to today, and the one-word answer is “Very”. We pulled the index sector weights from June 1987 and last Friday, and this is what we found:
- Technology has consumed large chunks of the index (+17 points) over the last 32 years.
The S&P 500 weighting in Tech in June 1987 was 10.1%. It has more than doubled to 27.3% today when you combine “Technology” as a sector along with Google, Facebook and Amazon, which sit in the Communication Services and Consumer Discretionary sectors.
- Financials are also a much larger piece of the S&P in 2019 than back in 1987 (+10 points). Including REITs (3 points today), the sector is now 16.1% of the index versus 6.2% back then.
- Health Care has also grown (+5 points), with a mid-1987 weighting of 9.5% and a 14.2% weighting now.
- Consumer Discretionary has shrunk by more than half (-9 points). Its weighting in mid 1987 was 16.8%. Notionally, it is now 10.2% but when you exclude Amazon it falls to 7.5%.
- Industrials/Materials have also become a smaller part of the S&P (another -9 points). The former was 14.2% of the index in mid-1987 but 9.4% today. The latter was 7.3% of the S&P in mid-1987 and just 2.8% today.
- Energy is down by close to the same amount (8 points), from 13.1% in mid 1987 to 5.0% now.
- The remaining 6 points have come out of Consumer Staples (11.3% then, 7.3% now) and Utilities (5.0% then, 3.3% now).
This is important, because while 1987 was a tough year with a brutal Q4, the next 2 years were awfully good for the S&P 500: 1988 was up 16.5% on a total return basis and 1989 was 31.5% higher. What were the fundamental drivers for this advance?
- It certainly was not corporate earnings…
On a trailing 4-quarter basis those peaked out in Q2 1989 at $25.53/share on an operating basis. A year later (1990), they were 9.8% lower ($23.05/share) and 2 years on (1991) earnings were down another 10.9% ($20.54/share). In fact, S&P earnings would not recover their 1989 peak until Q3 1993.
- The Federal Reserve did help things along, eventually…
In the wake of the 1987 US stock market crash, the Fed lowered rates by 71 basis points, from 7.29% (October 1987) to 6.58% (May 1988).
From there, however, the Fed pushed rates significantly higher (327 bp), to a peak of 9.85% in March 1989. Realizing that was likely an overshoot, the Fed then cut rates by 150 basis points over the balance of the year (ending at 8.23% in January 1990).
- … And that generally dovish trend pushed 10-year yields lower:
In the month before the October 1987 crash, the 10-year yielded 9.63%. A year later that payout was 76 basis points lower (8.87%) and two years on it was 132 bp lower (8.31%).
Pulling all this together into 3 summary points:
#1: The 1987 crash was painful, but it was a blip in terms of equity market returns. Not only was that year positive for stocks, but the next two years were strong as well.
The 1987 monthly data does show a clear “Sell” signal for 2019 if you are concerned that excessive market enthusiasm in 2019 will lead to volatility later this year:
- If/when the S&P 500 goes +30% on the year (12 percentage points from here), lighten up.
- Up 30 – 40% years aren’t uncommon (17 occurrences over the last 91 years, or 19%), but the chance you’ll miss out on another +10 percentage points is small.
- There are only 5 years (1954, 1933, 1935, 1928 and 1958) where S&P 500 returns exceeded 40%. And none, obviously, occurred in what we would call the modern era.
#2. Fundamentally, things actually do look a lot like 1987 – 1989…Corporate earnings are stagnant. The Fed seems to be on a path to lower rates. Ten-year yields are declining, pressured by negative rates overseas, sluggish goods-and-services inflation at home, and US-China trade war uncertainty.
#3: … But the nature of the S&P 500 has changed a lot since then, and in that fact sits a lesson about what interest rates can and cannot do for stock performance:
- The Tech sector plus Amazon, Google and Facebook are 27% of the index now.
- The equivalently important groups back in 1987 were Consumer Discretionary (17%) and Industrials (14%) for a combined 31% of the S&P 500.
- Health Care is now 14.2% of the S&P, the same weighting as Industrials in 1987.
- Financials are now 13.1% of the S&P, the same as Energy’s share of the index in 1987.
The lesson here: unlike in 1988 and 1989 when lower interest rates had a fundamental effect on demand for critical market moving sectors like Industrials and Consumer Discretionary, in 2019 it is harder to connect the dots between lower rates and earnings growth in Technology, Health Care and Financials. The first two are really global product stories. The last one has a steep hill to climb with rates as low as they are.
That’s not to say lower rates don’t help stocks, but their effect is now limited to valuation through a lower discount rate. That’s fine, as far as it goes. But it doesn’t reach as far into the index as it used to back in the late 1980s. In that respect, things really are different this time.
via ZeroHedge News https://ift.tt/2KWgpoZ Tyler Durden