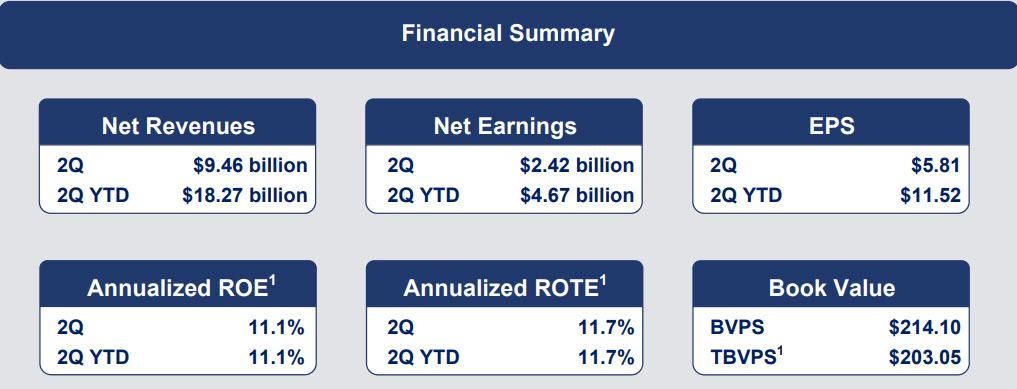
Moments after JPM disappointed with poor fixed income and equity trading revenue (and cut its net interest income forecast), Goldman reported its own Q2 results, which at least on the surface, were fractionally better. The bank reported Q2 net revenues of $9.46 billion, up 0.4% Y/Y, and better than the $8.9 billion expected, generating net earnings of $2.42 billion, and EPS of $5.81, also above the $4.92 expected, if below the $5.98 for Q2 2018.
With Goldman still mostly reliant on its trading desk to generate revenue, traders predictably focused instantly on Goldman’s trading results which were mixed. Here is the breakdown of the key Q2 trading results:
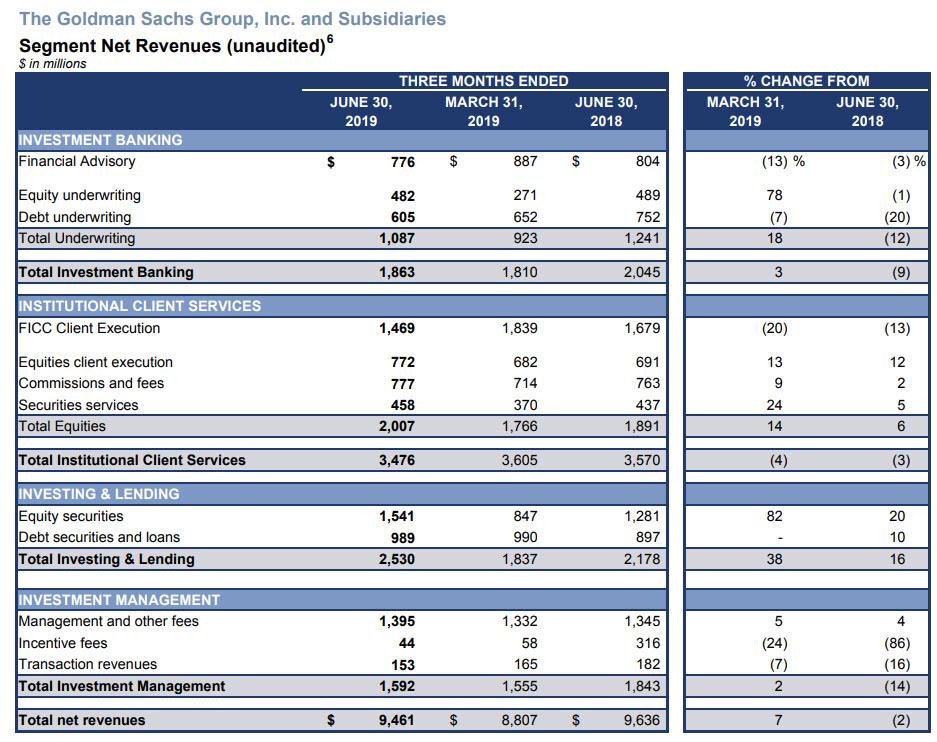
- Total trading revenue at $3.48 billion beat expectations, despite falling -2.5%. Equities revenue also exceeded forecasts, while FICC revenue missed.
- FICC sales & trading revenue $1.47 billion, down -13% y/y, missing consensus estimates
- Equity sales & trading revenue $2.01 billion, +6.3% y/y, beating the estimate of $1.79 billion; This was the second highest quarterly performance in four years.
- Investment banking revenue of $1.86 billion, tumbled -8.9% y/y, yet was better than the estimated $1.83 billion
And a more creative way of showing the company’s Q2 earnings:
While Goldman’s trading continued to be depressed, it was the surprising surge in Goldman’s prop trading group (light blue below) – Investing and Lending – which is Goldman’s principal investments in equity and debt, was up 16% Y/Y that more than made up for the continued decline in institutional flow debt and equity trading as shown in the chart below.
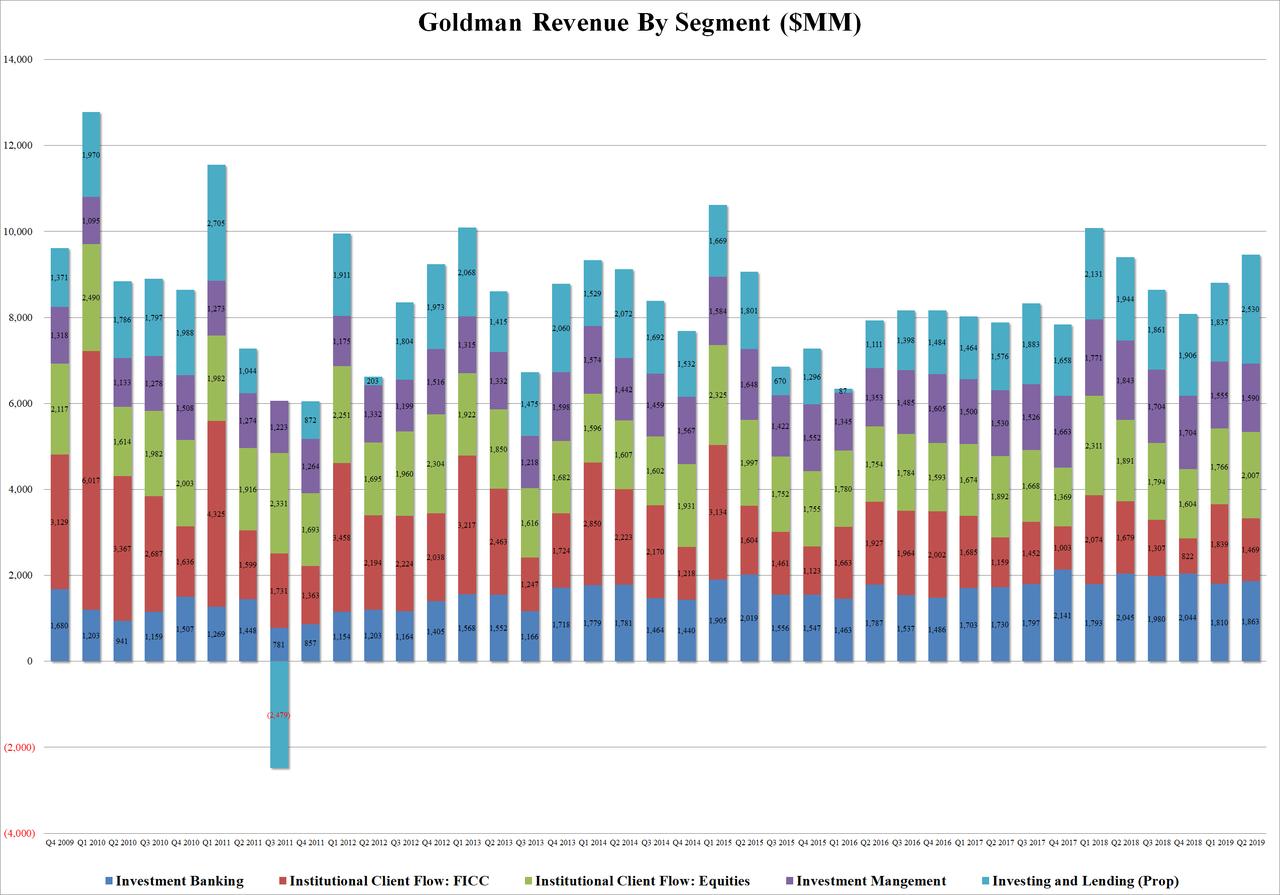
In fact, speaking of Goldman prop’s $2.53 billion in revenue, this was the highest quarterly performance in eight years, and included record quarterly net interest income in debt securities and loans of $872 million. Some more details on this outperforming segment:
- Net revenues in Investing & Lending were $2.53 billion for the second quarter of 2019, 16% higher than the second quarter of 2018 and 38% higher than the first quarter of 2019.
- Net revenues in equity securities were $1.54 billion, 20% higher than the second quarter of 2018, primarily reflecting significantly higher net gains from investments in public equities.
- Net revenues in debt securities and loans were $989 million, 10% higher than the second quarter of 2018, reflecting significantly higher net interest income. The second quarter of 2019 included net interest income of $872 million.
In other words, while Goldman’s core trading ops did ok, it was the investors among Goldman’s traders (those which used to be “banned” on Wall Street by the Volcker Rule), that helped Goldman beat overall Q2 results.
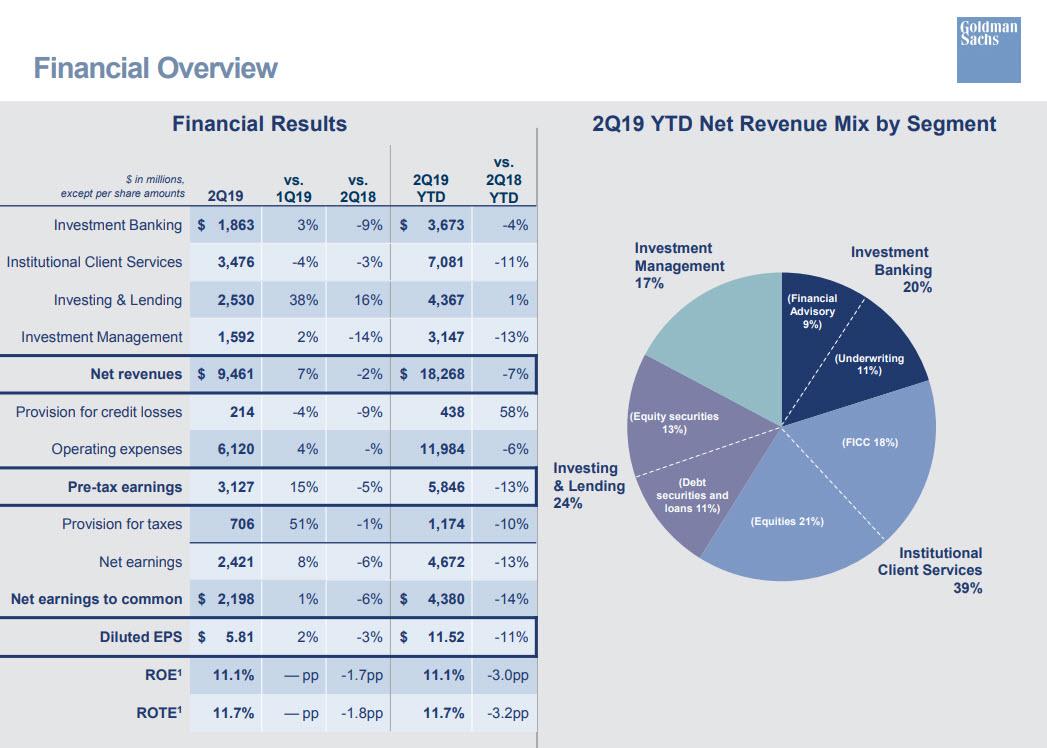
Elsewhere, Goldman’s provision for credit losses was $214 million for the second quarter of 2019, 9% lower than the second quarter of 2018 and 4% lower than the first quarter of 2019. The decrease in provision for credit losses compared with the second quarter of 2018 reflected lower provisions related to purchased credit impaired loans.
Some other notable highlights:
- In Investment Management, assets under supervision increased $61 billion during the quarter to a record $1.66 trillion.
- The firm received a non-objection from the Federal Reserve Board related to its CCAR 2019 capital plan, which includes up to $7.00 billion in common share repurchases and $1.80 billion in total common stock dividends, with a 47% increase in the quarterly dividend to $1.25 beginning in the third quarter of 2019
That about covers the revenue side; what about the expense side?
Goldman reported, Operating expenses of $6.12 billion for Q2, essentially unchanged compared with the second quarter of 2018 and 4% higher than the first quarter of 2019. The firm’s efficiency ratio for the first half of 2019 was 65.6%, compared with 64.6% for the first half of 2018.
Operating expenses, compared with the second quarter of 2018, reflected lower net provisions for litigation and regulatory proceedings and slightly lower compensation and benefits expenses. These decreases were offset by higher expenses for technology and consolidated investments. These higher expenses were primarily in depreciation and amortization, communications and technology, and occupancy expenses.
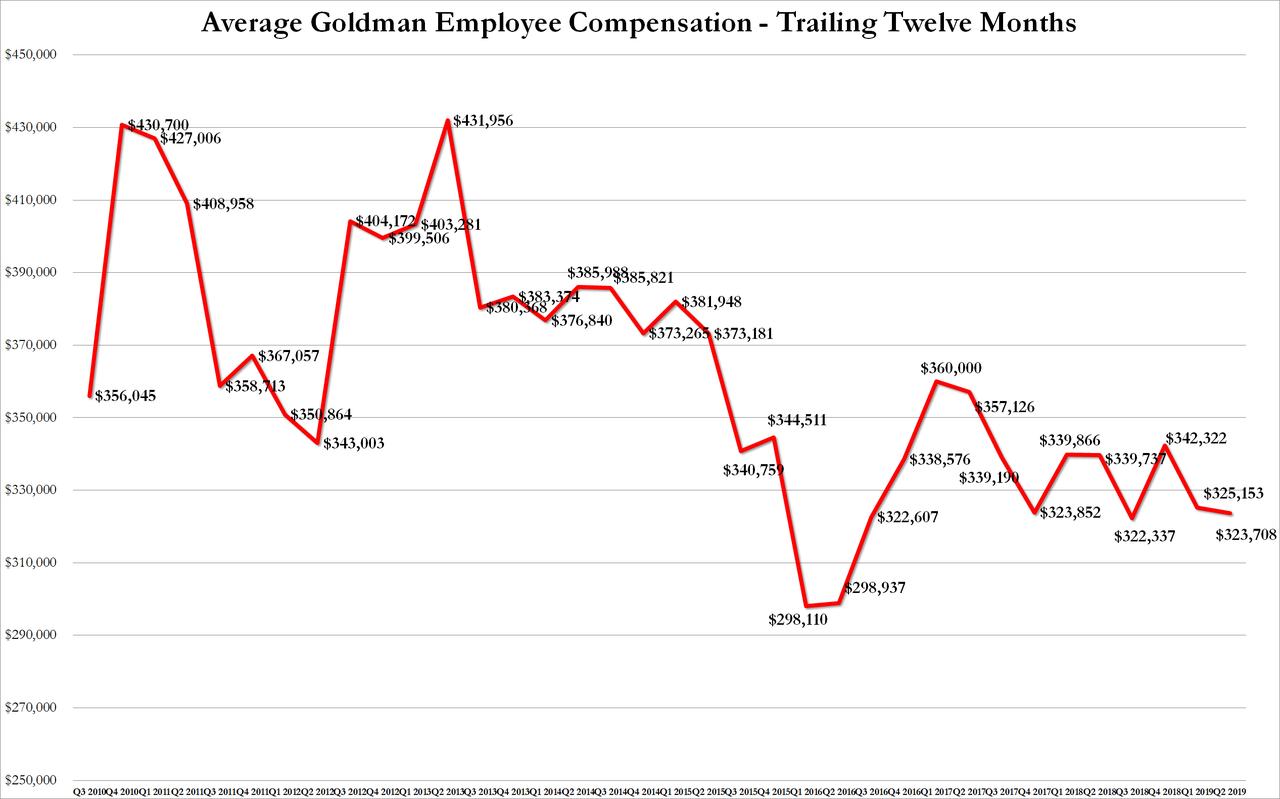
And speaking of Q2 compensation expenses, these declined -4.4% to $3.32 billion, slightly higher than the $3.27 billion estimate. As a result, of the modest drop in comp, and the 300 decline in headcount to 35,600 from 35,900, the average comp for Goldman banker declined to $323,708 from $325,153.
The full Goldman Q2 investor presentation is below
via ZeroHedge News https://ift.tt/2luXlCN Tyler Durden