Submitted by Eric Hickman, president of Kessler Investment Advisors
The bull market in U.S. Treasury bonds is in full swing and there is plenty more return to be made.
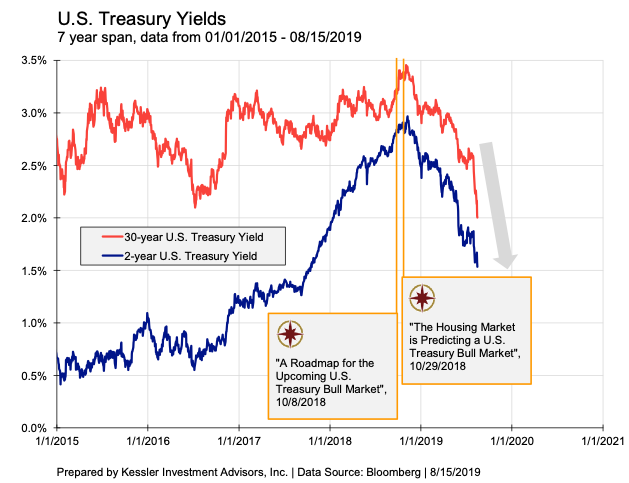
Two articles I wrote last October for Advisor Perspectives (here and here) identified the business-cycle peak in long-term U.S. Treasury yields. Yields have fallen dramatically from those points, generating significant capital gains for Treasury bond holders. The chart below shows when those articles were published and the path of U.S. Treasury yields before and after:
I identified the inflection point by comparing yield and economic behavior to the prior three recession eras – essentially taking historical lessons from the shape of the yield curve, the housing market (the best leading indicator), and business cycle length (I define a “recession-era” to be the period before, during, and after a recession in which U.S. Treasury yields are falling. The term is used to include the negative economic climate before and after a recession).
This method is notably different from the standard day-to-day financial commentary. The standard approach processes new information in near isolation from the past. This information is then reduced down to a few popular narratives to describe what is moving the market. The problem is that these narratives are not discussed as long as the phenomenon is present, are just a small subset of what is going on in the world, and are too short term to help trading the market.
For instance, the idea that U.S. rates need to fall to close the gap between U.S. and other developed economy sovereign yields (say Germany) has become popular in the last week. But this wide gap has been present (and greater) late last year. In another example, Brexit has moved off the front pages temporarily, but it is still the same unresolved situation. While of course it is important to be aware of what others are talking about, this approach often misses the reality of the broader business cycle.
And, because equity price movements don’t have much historical consistency, this is the primary way to make sense of them, which bleeds over to interest rate discussions. But the U.S. Treasury market is different. It has a wealth of similarities and correlations to past economic behavior. This is under-appreciated and under-used.
Where my prior articles aimed to find the starting point of the bull market, this article studies the bull markets themselves for further context and an expectation for what’s next.
A refresh of the “recession era 4” concept
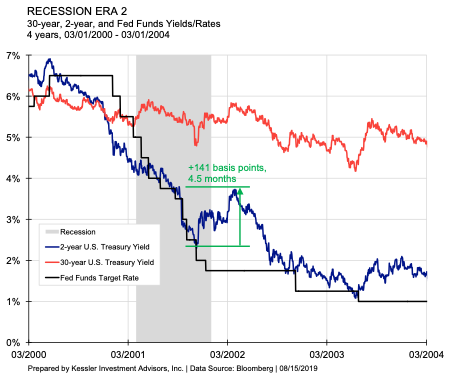
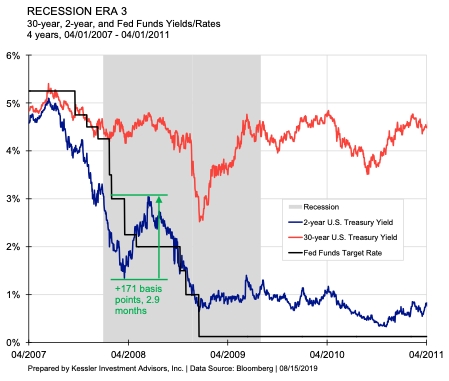
Three recessions have occurred in the U.S. over the last 30 years – the longest period in which there is rich financial and economic data. Each of these periods show a similar pattern of interest rates (see chart below).
Look at the approach to the orange-boxed recession eras. All three interest rates shown in the chart (Fed Funds, 2-year, and 30-year) go up as the Fed is raising rates; with the 2-year rising faster than the 30-year (i.e., the yield curve flattens). Then if you look at the left-side of the orange-boxed areas, all three rates converge to roughly the same place (the yield curve gets flat or inverted), the Fed then stops raising and term rates (the 2-year and 30-year) begin to fall in anticipation of a slowdown in the economy. The Fed then starts cutting rates and the 2-year falls more than the 30-year (i.e., the yield curve steepens). The recession then starts a little after the Fed starts cutting rates. The recession ends and term rates continue to fall for years after. With minor variations, this is what happens each time.
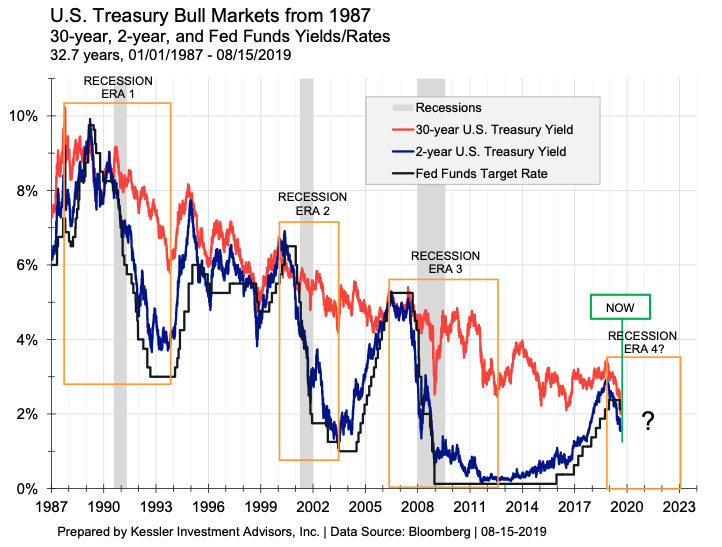
We are going through “recession era 4.” The housing market peaked in December 2017, the yield curve (10-year yield minus 3-month bill) inverted in March of this year, industrial production peaked in December 2018, the expansion in the U.S. is now the longest in U.S. history and the Fed has now begun to cut rates. The Fed will talk about how its July 31 cut was a “mid-cycle adjustment,” but that mention was a nod to the two “no-cut” dissenters (George and Rosengren) to not make a determination about the future (i.e. retain a neutral bias).
In fact, be prepared for the “risk-on” community and national policy-makers (read the Trump administration and Federal Reserve) to present reasons why a recession isn’t coming. People often predict what they need to happen, not what will happen.
To those who ask me, “Is the U.S. going to go through a recession in the near term?” I say of course it is…..the arguments against it are just from those desperate for it not to happen, not from careful analysis. Some are waiting to spot the primary driver that will define this recession (like the S&L crisis in the early 1990s, the dot-com crash in 2000-01 or the subprime crisis in 2008), but this will be defined in arrears. Don’t make the mistake of waiting to see a tidy ”why” before accepting that a recession is coming. Consider some of the common protests against a recession:
- An eventual trade deal with China will remove the problem. The global economy was slowing well before the trade war started. It is certainly an exacerbating factor, but it going away will not avoid a recession.
- The economy looks good. The parts of the economy that are still good – the labor market and consumer spending – are expected to still be strong at this point in the cycle. Leading indicators are still in the process of making cyclical peaks. This suggests that labor will only weaken after that process has occurred. Counterintuitively, the unemployment rate is always the lowest at the start of recessions. Waiting to see full “proof” of the recession will be too late.
- The Fed will lower rates and prevent a recession. It is often misperceived, but the Fed mitigates a business cycle, it doesn’t prevent one. The economic forces in a recession (the actions of hundreds of millions of people, even billions) are so much larger than what the Fed can respond with.
- The stock market has remained near its high. In the last recession era (2007-2011), the stock market (S&P 500) peaked after the first rate cut. Don’t wait for confirmation from the stock market. It will fall dramatically but marches to the beat of its own drummer.
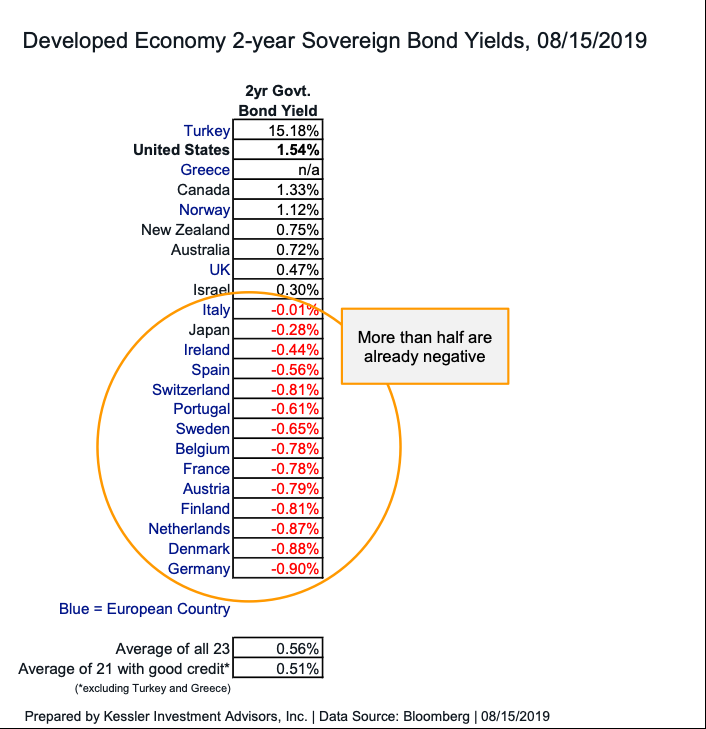
The Fed will cut rates to 0%-0.25%, just like in 2008. The 2-year yield will fall to its 2011 low of 0.16% or below and the 10-year yield will fall below 1%. Also, a globally synchronized recession could easily push the 2-year yield into negative territory, providing additional capital appreciation. More than half (56%) of global developed economy 2-year sovereign bonds are already trading with a negative yield (see below).
Recession eras dissected
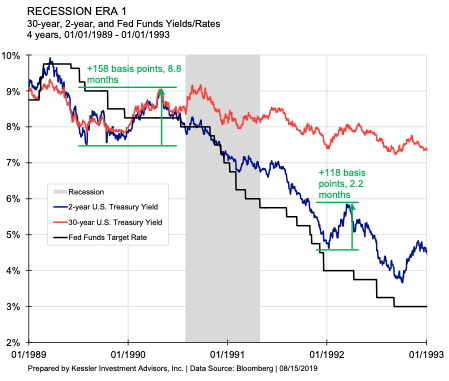
It is useful to deconstruct the long-term chart of yields above into individual charts for each recession era. Each chart has a four-year span. There are several things to notice about them:
- The 2-year yield drops much more than the 30-year (this is why we use leverage at Kessler; explained here).
- The recession occurs in the middle of 2-year yields falling (not at the beginning or the end.)
- Each recession-era takes three to four years.
- The 2-year yield has one or two major backups (> 2 months) during the process.

Taking the statistics from these past recession eras, similarities emerge. And because it is baseball season, why not break it down into nine innings (see below):
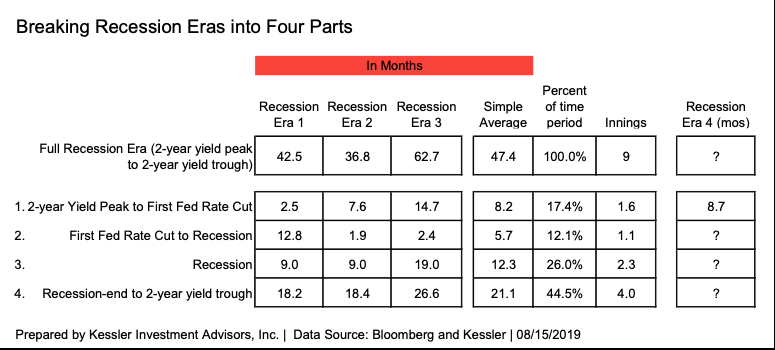
These averages can be generalized into a rough expectation of how this cycle will evolve (see below.) The averages have dispersion – it isn’t that they hold the answer to exactly how this cycle will evolve; they should serve as a baseline from where new thinking/modifications should start – not from scratch, as if everything is new.
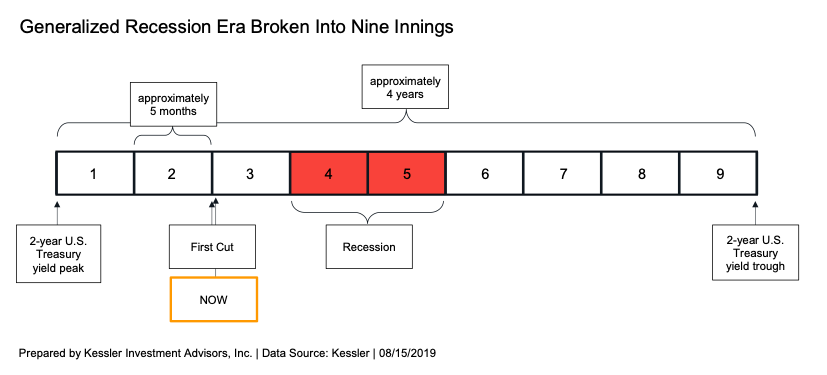
The first Fed rate cut (three weeks ago) indicates the start of the third inning. This concept rings true in the sense that recession conditions are not present yet. The recession will likely arrive sometime this fall/winter, not to be officially confirmed until a year or so later by the National Bureau of Economic Research (NBER).
There has been a long period of rates falling (4 innings) after recessions. Because the Fed is more dovish in this cycle, they will cut faster than before and because the market is primed to expect low rates for an extended period, rates may get to their trough faster. With that said, don’t extrapolate the pace of the 2-year yield falling heretofore into the future. Thus far, rates have only moved in one direction.
Along those lines, past recession eras all have one or two major back-ups in yields (higher yields) within them. You can see these highlighted in green in the four detailed charts above. These backups often occur from lagging inflation (1990, 2001, and 2008). Be aware of these. During them, the world will be convinced that the recession is nearly over, the Fed needs to raise rates, and/or that rates will continue higher. In other words, there will be a false dawn. Getting through these phases without giving up on the position requires deep analysis of the cycle looking beyond the short-term. Keep tuned to our analysis to guide Treasury bond ownership throughout the cycle.
U.S. Treasury yields have a strong historical basis that is often missed. It is tempting to think that everything is new and unique every time. But it is more challenging to accept that there are historical norms that explain the medium-term Treasury yield trend. “Recession era 4” is following this playbook quite well. As more and more pieces of the puzzle fit into the mold, it gives increasing assurance that this is the right model to use in this economic climate.
via ZeroHedge News https://ift.tt/2Za21At Tyler Durden