New MIT Skull Study Analysis Calls For 70% Chance Of Recession In Next Six Months
A new index that has been an accurate past indicator of recessions is showing that we are currently at a 70% chance of recession, attributed to weakening industrial production and the slope of the yield curve.
The new indicator is a combination between State Street Associates and MIT’s Sloan School of Management and is called the KKT Index of the Business Cycle.
It is based off of the idea of Mahalanobis distance, which is a measure of the distance between a point P and a distribution D, introduced by P. C. Mahalanobis in 1936. The distance is a multi-dimensional generalization of the idea of measuring how many standard deviations away P is from the mean of D. In addition to using it for the analysis of skulls, Mahalanobis distance is used in cluster analysis and classification techniques.
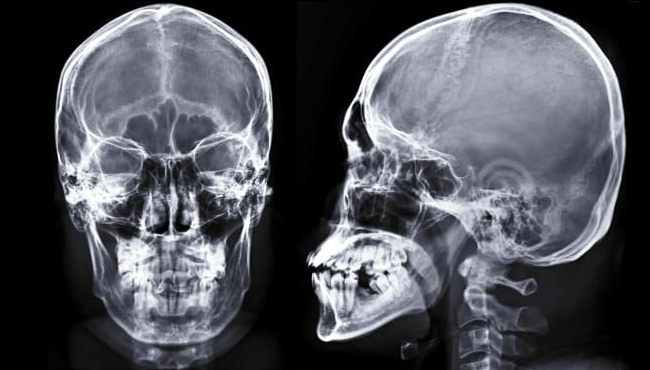
“The Mahalanobis distance was originally conceived to measure the statistical similarity of the values of a set of dimensions for a given skull to the average values of those dimensions for a chosen group of skulls,” the study says.
The study’s abstract reads:
Their index has several important features that distinguish it from the Conference Board’s leading, coincident, and lagging indicators. It is efficient because as a single index it conveys reliable information about the path of the business cycle. Their index gives an independent assessment of the state of the economy because it is constructed from variables that are different than those used by the NBER to identify recessions.
It is strictly data driven; hence, it is unaffected by human bias or persuasion. It gives an objective assessment of the business cycle because it is expressed in units of statistical likelihood. And it explicitly accounts for the interaction, along with the level, of the economic variables from which it is constructed.
The study’s co-author William Kinlaw, senior managing director at State Street Associates said to Axios: “This index offers a precise probability of recession or robust growth … by comparing key variables to the patterns that prevailed during historical episodes.”
The study incorporated U.S. data including industrial production, nonfarm payrolls, stock market return and the slope of the Treasury yield curve.
The study says that the lead time on the yield curve predicting recessions is often too long, stating: “Many pundits believe that an inverted yield curve presages the onset of recession. Exhibit 4 tends to support this relationship, though the lead time is often quite long.”

Dating back to 1916, the KKT Index has gone up “leading up to every recession so that the combination of its trajectory and level provides a reliable indicator of the likelihood of recession,” according to the study.
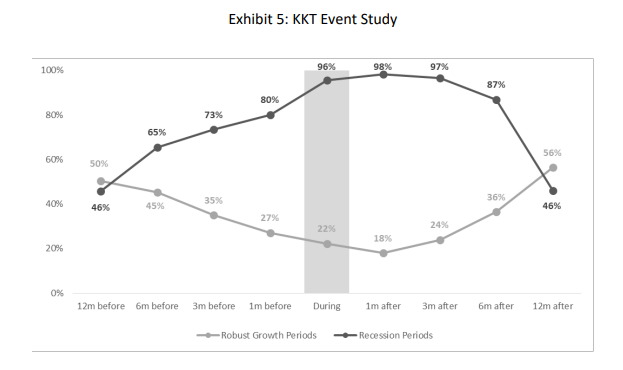
In Exhibit 5, “he dark line shows the level of the KKT Index leading up to, during, and following recessions. The light line shows level of the index leading up to, during, and following periods of robust growth,” the study says.
The unconditional likelihood of a recession occurring in a 6 month period is usually just 17%. As of November 2019, the reading on the index was as high as 76%.
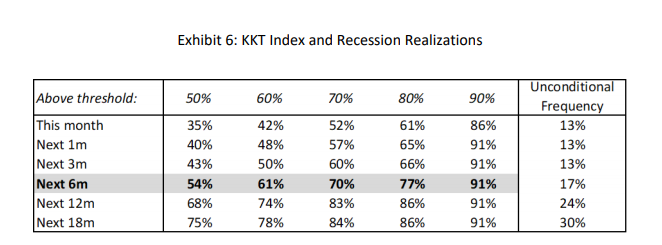
The study concludes: “We highlight the row corresponding to the realization of recessions over the subsequent six months for various levels of the index. We also report the unconditional frequency of recession for the various time spans. Exhibit 6 reveals that when the index exceeded 50%, 54% of the time a recession occurred within the next six months.”
It continued: “When it exceeded 60%, a recession occurred 61% of the time within the next six months. When the index exceeded 70% the frequency of recessions was 70%. When it exceeded 80%, recessions occurred 77% of the time. And when it exceeded 90%, recessions followed 91% of the time.”
Tyler Durden
Sun, 02/09/2020 – 14:25
via ZeroHedge News https://ift.tt/2H9usDP Tyler Durden