Morgan Stanley: Is This Cycle So Broken That Nothing Makes Sense Anymore
Authored by Andrew Sheets, chief cross-asset strategist at Morgan Stanley

The US economic expansion started in mid-2009, and the 125+ months since have been remarkable. The longest run without a US recession on record has left the US unemployment rate (3.6%) near a 50-year low, US 10-year yields (1.6%) near a post-war low and price/sales for the S&P 500 (2.4x) at a post-war high. Those extremes are just a few of the many indicators suggesting that we live in unusual times.
And the more unusual the times, the less traditional frameworks seem to work. That’s the subject of an active debate: Are the indicators we use for the US cycle, which moved to a late-cycle ‘downturn’ phase last year, simply wrong?
A quick refresher – there are many ways to define ‘the cycle’, and our models take a relatively simple approach. Looking across a broad composite of de-trended US indicators, we measure whether they are below or above average, and rising or falling. These four possible states give us the four phases of our cycle model – ‘repair’, ‘recovery’, ‘expansion’ and ‘downturn’.
From early 2014 to early 2019 these indicators were in ‘expansion’ (data ‘above trend and rising’), a phase that historically has seen equities do better than valuations would suggest and outperform credit. Over that five-year period, both occurred. The message of this framework was one reason why we never moved ‘underweight’ equities over this period, even as valuations climbed higher.
But then things changed. As growth slowed, our cycle indicators shifted to ‘downturn’ in May 2019, the phase where data are still better than average but deteriorating. This stage is historically associated with worse-than-average risk credit and equity performance, one of several reasons why we went underweight global equities in early July 2019.
Stocks initially struggled from July through September last year. But then they rallied. We closed our underweight in mid-November, and while global equities underperformed government bonds over this period, and saw below-average risk-adjusted return, it certainly didn’t feel like a victory. And as global equities (and credit) continued to press higher after mid-November, bigger questions loomed: Were our indicators simply wrong? Is this cycle so different that past approaches simply don’t apply?
We don’t think we’re alone in asking this question. A not-so-well-kept secret of asset allocation is that there aren’t that many indicators which, over the long run, have given powerful, statistically significant signals. As such, we think that our models share similarities with those of many investors. More qualitatively, the idea that we’re in the ‘late innings’ of the current expansion has hardly been an out-of-consensus view.
Yet amid that confusion (or despair), something notable has been happening. While overall equity and credit markets (beta) have been unusually strong for a ‘downturn’ phase, a number of underlying market relationships (alpha) have been almost exactly what this phase would imply.
Historically, in the ‘downturn’ phase of our indicator, long-dated bonds outperform stocks. Defensive and large-cap equities (modestly) outperform cyclicals and small-caps. US stocks (modestly) outperform those in the rest of the world. Investment grade credit returns more than high yield. Precious metals outperform other commodities. All have been happening, not just year-to-date, but for the better part of a year.
That’s important.
- First, it suggests that traditional approaches to the current cycle have been and are still providing useful information. They shouldn’t be discarded simply because the S&P 500 has remained strong.
- Second, the divergence between these trends in beta and alpha suggests strategically maintaining more balance until it is resolved; we remain strategically neutral global credit and equities.
Finally, it’s worth identifying where divergences are most unusual versus history. While the outperformance of gold, large-caps and defensive stocks are all ‘normal’ for a ‘downturn’ phase, the magnitude of these moves are not, and are much larger than normal. Oil has historically done extremely well in ‘downturn’, but lately it has struggled. And while there is a lot of conventional wisdom that owning Growth over Value is a classic late-cycle defensive position…
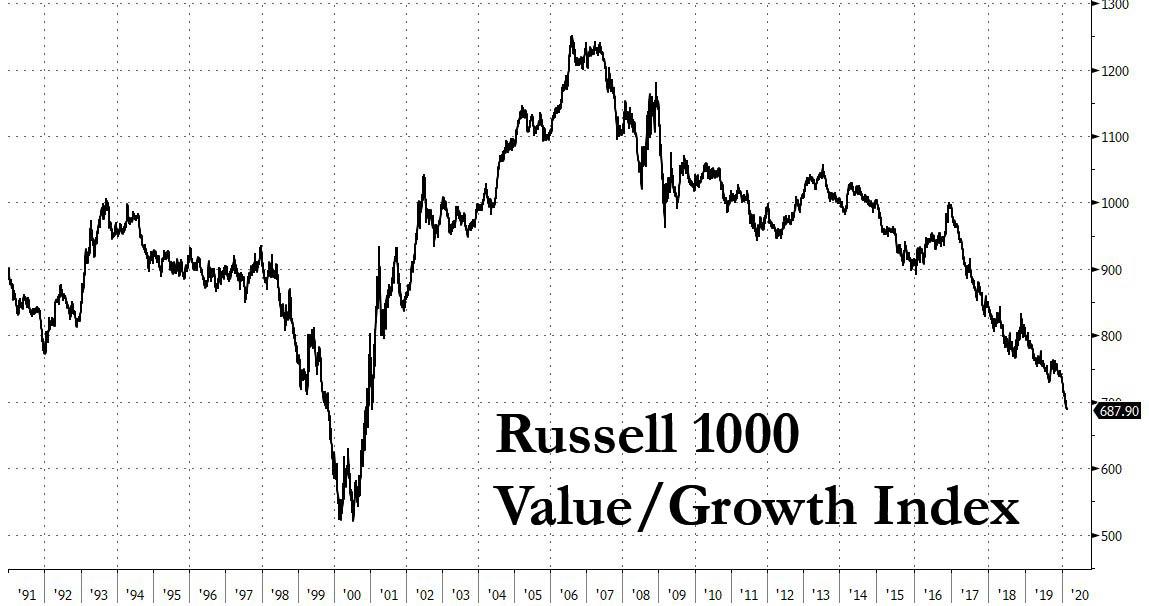
… history is far more mixed: it worked wonderfully in 2007-08, but extremely poorly in 2000-01 – the latter, ironically, being preceded by the last time the relative valuation gap of Global Growth versus Value was near current levels.
Tyler Durden
Tue, 02/18/2020 – 14:03
via ZeroHedge News https://ift.tt/37B7Y9t Tyler Durden