The Fed Should Be Concerned: Job Market Vibes Vs Data
Authored by Peter Tchir via Academy Securities,
The Job Market – Vibes vs Data
It seems like we are on the cusp of an agreement with Iran. We will help analyze the market implications in a SITREP if and when the details are released.
In the meantime, the one question that seems to puzzle everyone, is what is the state of the job market?
Yes, there are all sorts of questions around AI, the AI and data center spend, affordability, and inflation, but the state of the job market seems to be the most puzzling of late.
The juxtaposition of daily discussions about no hiring, and fears of AI job losses, versus some stellar headline data.
Record low consumer sentiment versus ongoing spending remaining strong.
Mixed (at worst) evidence of delinquencies. There is little (that I could find) evidence of a broad-based increase in delinquencies. If you squint hard, you can see evidence of pressure on the lower income part of the population, but as of now, that’s about it.
Unemployment Rate
The last two headline numbers (from the Establishment Survey), as of now (before revisions), were 185k and 115k.Big numbers, an obvious A+ in terms of grading.
While the headline is important, for most of the country, within days of the Non-Farm Payroll (NFP) release, we started to talk less about the headline jobs and more about the unemployment rate. So that seems like a good starting point for exploring the jobs data.
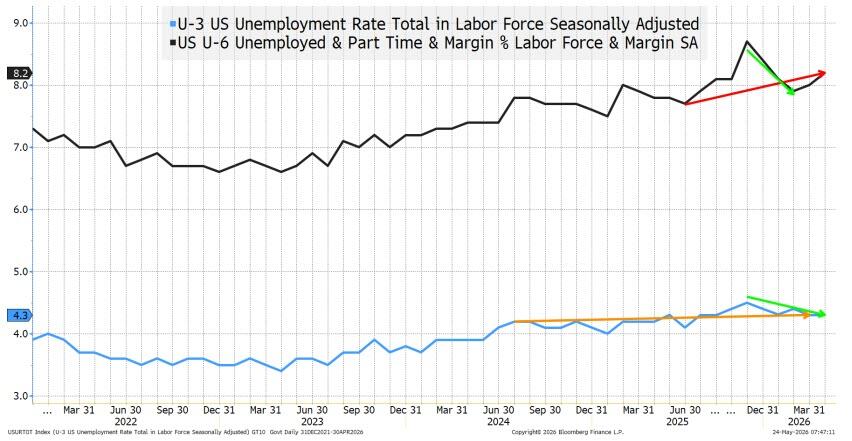
We used the “official” titles from Bloomberg for the Unemployment rate (blue) and the Underemployment rate (black).
The unemployment rate has been trending down and it is close to its best level in 2 years. Let’s give the unemployment rate a grade of A- (though that feels a bit stingy).
The underemployment rate is a broader definition of unemployment. It captures people stuck in part-time, low-paying, or skill-mismatched jobs. The skill-mismatched subcategory (from AI) is the most interesting to me. Is that evidence of AI taking good entry level professional jobs?
The underemployment rate came down early this year, but from the highest levels in the past 5 years. It has been trending higher and is well above the 5-year average. I’d give underemployment a B- grade (though that feels a bit generous).
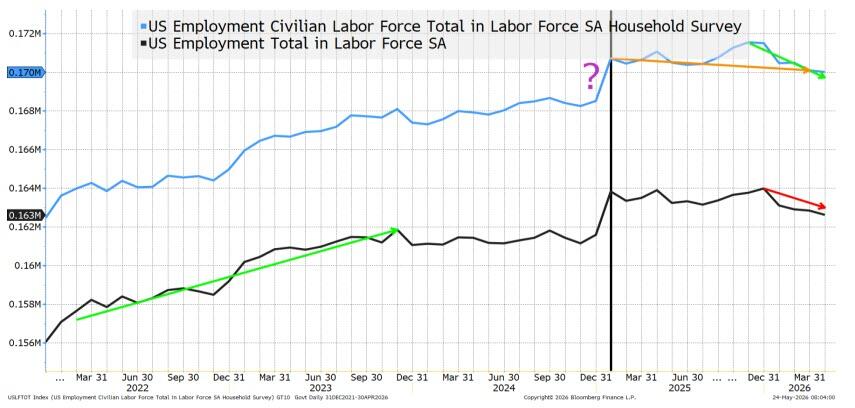
The unemployment rate is based on the Household Survey.
There are a few things that stand out:
-
The gap higher for both the size of the workforce and those employed, that occurred as of December of 2024, appears to be part of annual revisions. It stands out, but is largely noise.
-
The size of the labor force has not shrunk much since President Trump took office. I honestly have no idea how many illegal workers show up in the data, or whether they don’t show up in the data. Given the crackdown on illegal workers, I bet most of those jobs never showed up in the data (again, I will admit to being confused how people working illegally were counted in the jobs data, but I’m told by people much more into the weeds on this stuff, that it happens). In any case, I was a bit surprised by the labor force data in the past year remaining almost stable.
-
Both the size of the labor force and the number working has shrunk in 2026! I don’t see any way to make fewer workers sound good.
-
The Establishment Survey has jobs of 160k for Jan, -156k for Feb, 185k for March, and 116k for April. Pretty darn good.
-
The Household Survey has -895k in Jan (adjustments included), -185k for Feb, -64k for March, and -226k for April. Even ignoring January, the last 3 months have been awful.
-
-
While the Household Survey is wildly inaccurate, we seem to accept it for the unemployment rate, so why don’t we spend any time looking at it for signs regarding the job market. Again, just weird that it is deemed so “useless” for jobs, but is A OK for determining the unemployment rate? If we used the change in Establishment jobs the past few months, we’d probably be under 4% – which would be amazing!
-
The final most salient point in how I think about these two data series, is that they tend to converge over time. They can deviate, often for months, but they tend to converge which tells me that we are probably headed for some weaker headline prints in the coming months.
For those of you not familiar with how I think about the two surveys used for jobs data:
-
The Establishment Survey is largely inaccurate, and the Household Survey is wildly inaccurate! From the BLS the NFP data is +/- 122k at the 90% confidence level. For the Household it is +/- 676k at the 90% confidence level! (I used AI for that data, take it with a grain of salt, but you can dig deeper on the BLS site – starting with Employment Situation Technical Note).
-
Imagine reporting your quarterly returns as we made somewhere between losing $1 billion and making $5 billion, but we won’t really know for at least a year.
-
When you really think about the margin of error, it seems almost insane how many really smart people are forced to treat something that amounts to at best, a kind of, maybe reasonable, rough guess as to the current situation as gospel truth. The BLS takes the time to point out that a reading of +50k, gives a 90% confidence that the actual number of jobs is between -72k and +172k (meaning 10% of the time, like once a year, it is likely to be off by more than that!).
-
I’m almost disgusted with myself (even more than usual) that I am going to try and make a point using data that is just so bizarre!
But the Household Survey is a solid D. If there is any convergence in the two different jobs totals, then we should expect some pain in the Establishment Survey (i.e., the headline number).
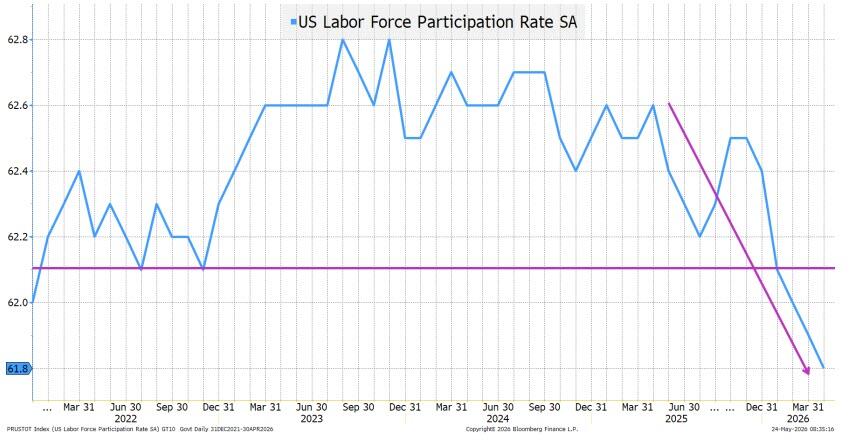
I am not sure what to make of the Labor Force Participation Rate (hence the color purple rather than green or red).
-
Lower participation rates can occur when times are good. Families are making so much money that a member of the family can step out of the labor force. Maybe stock market gains are so great that you don’t need to work? Overtime pay is so good, one member can step back?
-
Lower participation rates can occur when times are bad. People get so frustrated with being able to find work, they just give up and drop out of the pool of people trying to get work.
It’s all a bit of a guess, but I suspect the labor force participation is a negative signal.
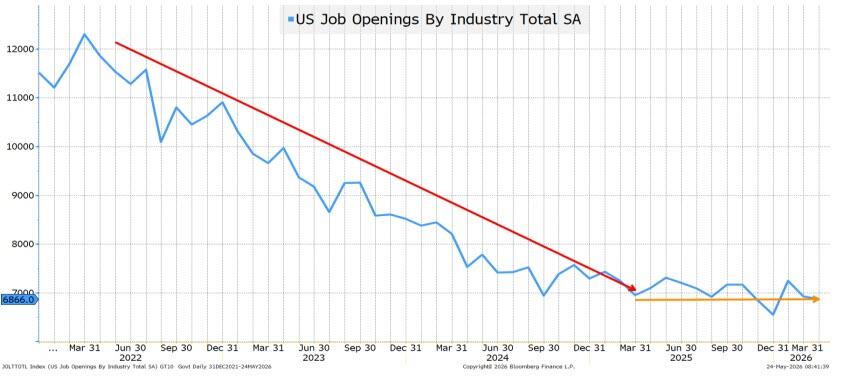
I continue to believe that the JOLTs data overstates jobs available (it doesn’t fully capture how many ghost jobs are out there, how many ads are on employment websites that are stale or weren’t removed, etc.).
Even if I’m not correct on my assumption that it is overstated, the jobs available picture deteriorated over the past several years and hasn’t really improved. That would provide some support that labor force participation is dropping due to frustration with the ability to find a job.
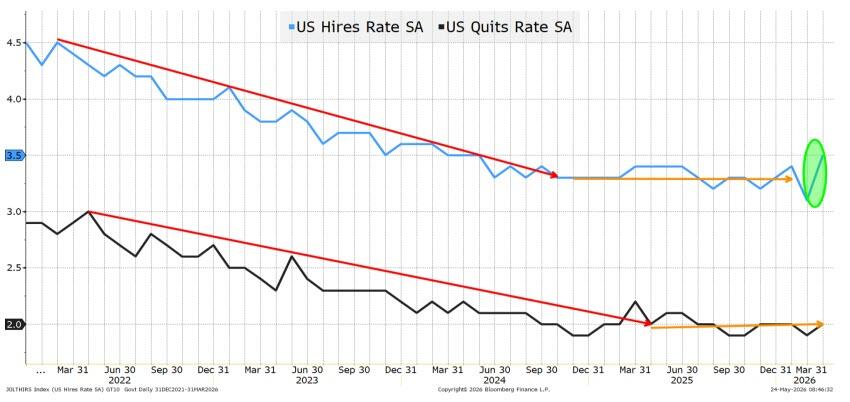
My “favorite” piece of data is the QUIT data. I like it because it “crowd sourced.” It is one of the few pieces of data where we get to see what the average worker is thinking. People tend to QUIT when they know they can find another job easily! People tend to stay in jobs, even ones they don’t like, until they find a better job, in a tough labor market. That seems to fit.
I don’t like the HIRE rate quite as much, but it is difficult to fake. It did tick higher recently (I put some green on the chart) but it is NOT showing robust hiring.
This whole section earns a C.
Uber Eats or Law School
According to AI “Law school applications have surged roughly 15% to 33%!”
Nothing says, I’m worried about AI, so I should go to law school, because certainly AI won’t affect the need for junior lawyers.
We tend to see law school applications spike when it is difficult for college graduates to get jobs. We saw this with the GFC. Then, at least, it made more sense. Law school is a great place to hide out for a few years and wind up with a pretty good job if you can do well. But right now? If it is a bad time to graduate from college, I am not sure that in 3 years (as AI improves) it is going to be a great time to graduate from law school. I could be wrong, but off hand, becoming a lawyer “suddenly” (see the spike in applications) seems to be a traditional response in a world that is rapidly evolving.
All of which brings me to my least favorite part of the jobs data – the birth/death model!
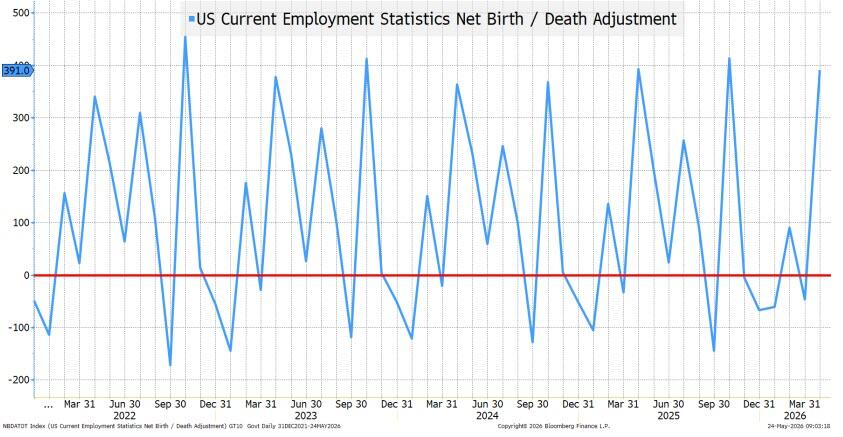
I know that not all of the adjustment passes through to the establishment number. But I still think it is useful to think about this number.
My contention is, and remains that:
-
At one time people applied for an EIN (Employment Identification Number) because they were creating a real business. Hire a couple of people and make a go of it.
-
I believe that with the gig economy people apply for an EIN when they are looking for a side hustle to make some extra money. One client this past week told me that one of the fintech firms provides basically one click functionality to create an LLC and get an EIN. For those with rental properties, get an EIN for each one? For more sophisticated participants get one for Uber, Lyft, etc.?
The gig economy has become a major way to supplement income. With more tools making it easier to run gig jobs as businesses, more will do it. I believe the Big Beautiful Tax Bill provides some benefits to those running their gig businesses as such.
I think that the number of jobs created for each EIN application is less than 1 (many are already working, so just adding another enterprise to their toolkit), hence the birth/death model methodology massively overstates jobs.
- Given the large annual job revisions we’ve been getting, I think there is a very strong case, that overstatement of jobs during the course of the year via the birth/death adjustment is the prime culprit.
This year’s birth/death model seems bizarrely similar to last year’s (and the year before):
-
-61k in Jan 2026 vs -105k in Jan 2025 vs -121k in Jan 2024.
-
90k vs 136k vs 151k in Feb, -47k vs -33k vs -21k in March, and 391k vs 393k vs 363k in April.
We have seen massive downward annual revisions. There has been work done blaming much of it on how the birth/death model works. Since we are repeating the pattern in the data month by month, maybe we can assume we will once again be told at the end of the year that the actual jobs were a lot worse than reported?
This section isn’t particularly “damning” but I find it hard to see how it supports anyone arguing that the labor market is strong!
Where The Jobs Are
The first 4 months of the year have added 304k jobs to the economy (the Establishment data as of today).
221k jobs have been added in the Health Care and Social Assistance industry.
73% of jobs have been added in one industry. Yes, a large and vital industry, but that seems like a lot.
- Is some of this related to programs enabling you to get paid to take care of a family member? I think those are great programs, but is that job creation in the way we think of job creation?
This sector doesn’t scream “growth.” If anything, it at least whispers “affordability” as for most of us, healthcare is an expense and one that I’ve seen do nothing but go up (despite how it is calculated for CPI).
The US CPI Urban Consumer Medical Health Insurance City Average has declined 22% since the start of 2021! I know they follow some calculation, but whatever the calculation is, it doesn’t reflect the reality of what employees and employers face on the health insurance premium front.
Yet another reason, that the AFFORDABILITY issue is bigger and more painful than the CPI/Inflation issue. But that rant, is a rant for another day.
Bottom Line
There seems to be, at first blush, an inconsistency between the “vibe” on jobs and the published data.
I think that inconsistency goes away if we broaden what official data we look at.
The Fed should be concerned about jobs. At the moment they aren’t, but they should be.
I would like to see a lot more jobs being created in the ProSec™ industries, than we’ve seen of late. Maybe, if we can move beyond the Iran war, the admin will provide even more support, more quickly to these crucial industries! They are working on it as you read this, but if the President is able to direct even more attention to this, it would help.
One last word on AI and jobs. We don’t know what it does for jobs going forward, but the AI and data center buildout is creating jobs right now! We can (and will) debate the outlook for jobs as AI improves and becomes more prevalent, but the buildout does create a lot of jobs – not just in the construction, but also in the power generation and other adjacent businesses.
Without the AI and data center spend, we’d have even more concerns about the current job market, but that spend looks set to continue, which will help, and maybe buy us the time to get ProSec™ more fully ramped up!
Tyler Durden
Tue, 05/26/2026 – 12:00
via ZeroHedge News https://ift.tt/ecgBhwf Tyler Durden