The K-Shaped Economy: Why The Middle Class Moved Up
Authored by Lance Roberts via RealInvestmentAdvice.com,
The K-shaped economy has become shorthand for a tidy story. The rich pull away while everyone else falls behind. It fits the mood, and it makes for a sharp headline. The problem is that it’s mostly wrong. When you pull the actual Census data, the dominant move of the last half-century isn’t down. It’s up. Yes, the middle class is shrinking. But it’s shrinking because millions of households climbed into higher brackets, not because they slid into poverty. The real divide lies elsewhere, and most of the coverage walks right past it.
Let’s start with what the term “K-shaped” means, because the label gets stretched to cover almost everything. A K-shaped economy is one where different parts move in opposite directions at the same time. One arm rises with high incomes, corporate profits, and asset values. The other arm stalls with low-wage work, thin savings, and shuttered small businesses. The phrase caught fire after the 2020 shutdown, when high-skill workers shifted to remote work while service jobs vanished overnight.
As a description of that moment, it was accurate. The shutdown hit restaurants, travel, and personal services hardest, and those jobs are inherently lower-wage. Meanwhile, technology, finance, and professional services barely missed a beat. So far, so good. The trouble starts when the K gets applied to the entire arc of American incomes over the last five decades. That’s where the story breaks down.
The Middle Class Didn’t Collapse. It Climbed.
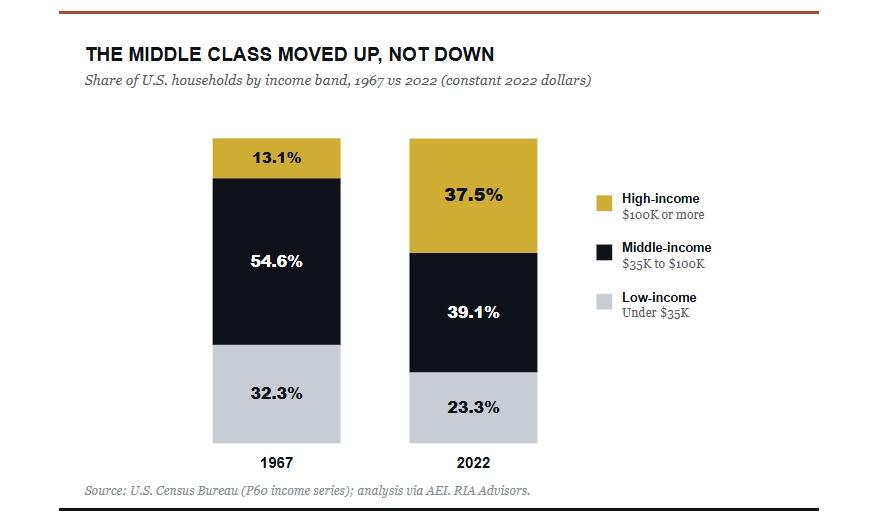
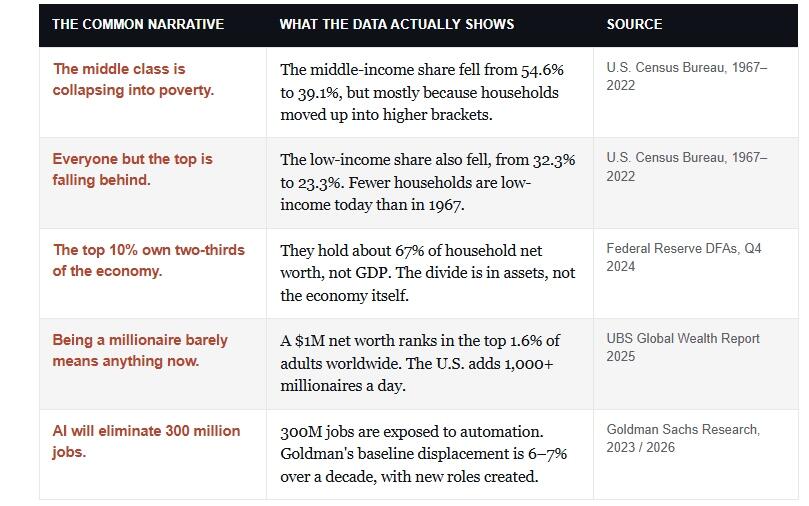
Notice the chart above. In 1967, about 54.6% of U.S. households sat in the middle-income band, earning between $35,000 and $100,000 in 2022 dollars. By 2022, that share had fallen to 39.1%. On its face, that looks exactly like the disappearing middle class everyone talks about. But follow where they went. Over the same stretch, the share of households earning $100,000 or more nearly tripled, climbing from 13.1% to 37.5%.
Here’s the part the headlines skip. The low-income share fell too, from 32.3% to 23.3%. Both the middle and the bottom shrank, while the top exploded. That’s not a population sliding into hardship. That’s a population moving up the ladder. The American Enterprise Institute’s work on this is blunt about it. By their definition, the upper-middle class is now the largest single income group in the country, roughly three times its size in 1979.
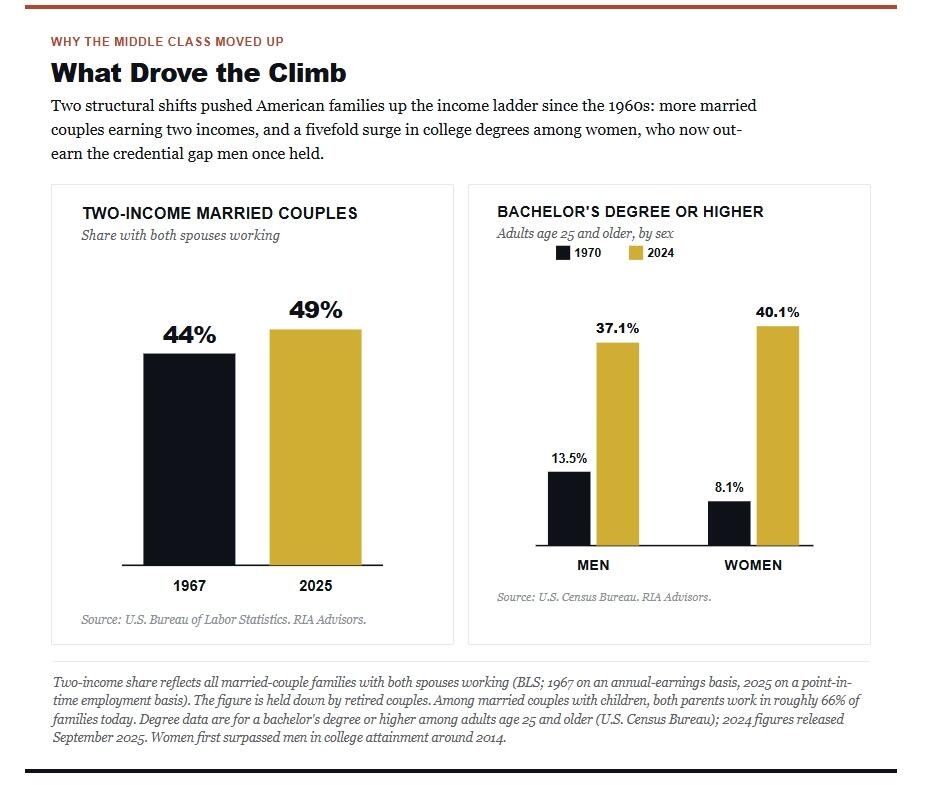
So what drove the climb? Two main things: more dual-earner households and rising educational attainment, especially among women. In 1970, about 11% of women held a college degree. Today, the figure is closer to 40%. More households with two paychecks and higher credentials simply earn more money.
Of course, someone will object that a fixed $100,000 line just reflects inflation nudging households over the threshold. It doesn’t. These figures are stated in constant 2022 dollars, so the bar is held flat in real terms. Households cleared it anyway, in far greater numbers. The upward migration is real, not a measurement trick.
Where the K-shape Is Real, It’s About Ownership
So is the K-shaped economy a myth? No. It’s just pointed at the wrong variable. The genuine divide isn’t income mobility. It’s wealth.
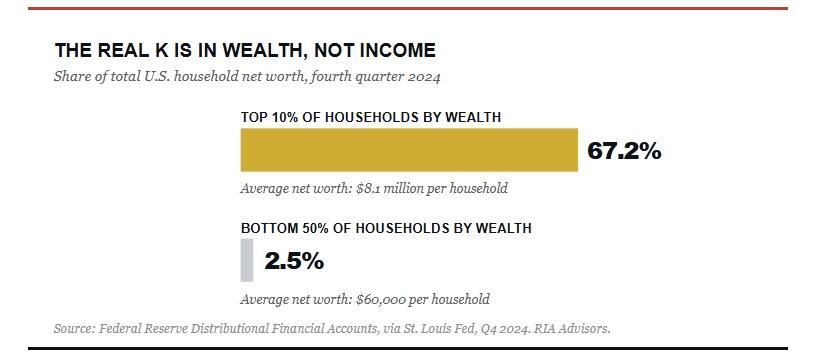
This is where the common framing of these numbers goes off the rails, and it’s worth correcting directly. You’ll often read that the top 10% own “two-thirds of the economy.” That’s not right. They don’t own the economy. They own the assets. According to the Federal Reserve’s Distributional Financial Accounts, as of the fourth quarter of 2024, the top 10% of households by wealth held about 67% of total household net worth, averaging $8.1 million each. The bottom 50% held roughly 2.5% of the total, averaging about $60,000. Net worth and GDP are not the same thing, and the difference matters.
Why is wealth so concentrated when income mobility looks so healthy? Because the two run on different engines. A decade and a half of near-zero interest rates, asset purchases, and pandemic-era stimulus inflated the price of stocks and homes. If you owned those assets, your balance sheet soared. If you rented and lived paycheck to paycheck, you got the inflation without the gains. That’s the real lower arm of the K. It’s not that the middle isn’t earning. It’s that a large slice of the country doesn’t own the things that compound.
But Everyone Says They Feel Broke
Here’s the strongest counter to everything I’ve laid out. Walk into almost any room, including rooms full of high earners, and you’ll hear the same complaint. People feel broke. Surveys back it up, with financial anxiety running high even among households pulling in six figures. So if the data say people are moving up, why does almost no one feel like they’re winning?
The answer is mostly psychological, and behavioral finance has a name for it: relative deprivation. Satisfaction isn’t set by your absolute position. It’s set by comparison, and the comparison is almost always upward and local. Live near Greenwich, Connecticut, and your reference point becomes hedge fund billionaires, which makes a $5 million net worth feel like loose change.
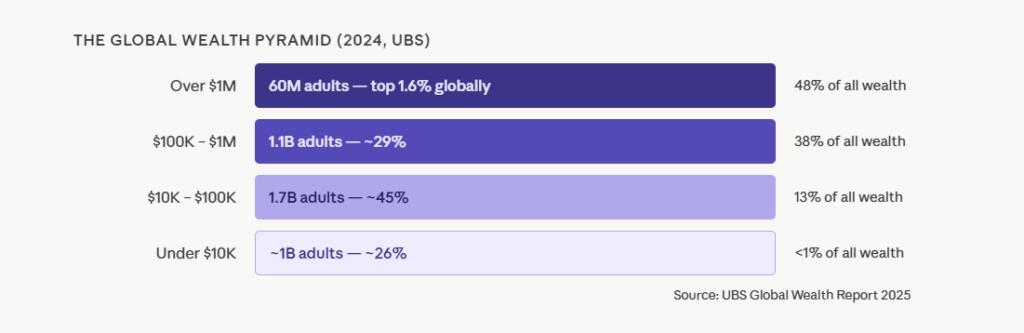
Step back, though, and the absurdity is obvious. A $1 million net worth puts you in the top 1.6% of adults on the planet. UBS counts roughly 60 million people in that group, and together they hold nearly half of all the wealth in the world. The United States now mints more than a thousand new millionaires a day. Yet plenty of those same millionaires go to bed feeling like they’re falling behind, because they’re measuring against the 0.001%, not the other 98.4%.
Make no mistake, real hardship exists at the bottom of the distribution, and I’m not waving it away. But a large share of the “everyone feels broke” sentiment isn’t a balance-sheet problem. It’s a scoreboard problem. People have climbed the ladder and kept their eyes locked on the rungs above them. As Tony Isola recently put it, millionaires aren’t losing the game; they’re just looking at the wrong scoreboard.
Will AI Widen the K or Narrow It?
That brings us to the question hanging over all of this. Does artificial intelligence make the divide better or worse?
The honest answer is that it could go either way, and anyone who tells you they’re certain is selling something. Start with the risk case. Goldman Sachs estimates that around 300 million jobs globally are exposed to AI automation, and that the technology could handle tasks making up roughly a quarter of U.S. work hours. Notice the word exposed. It does not mean eliminated. Goldman’s own baseline is that AI displaces about 6% to 7% of jobs over a decade, with a wide range around that figure. The roles most exposed, administrative support, basic accounting, and routine office work, sit disproportionately in the middle of the income distribution. That’s a threat aimed squarely at the households that just climbed.
Now the upside. That same Goldman research projects AI could lift global GDP by about 7% and add 1.5 points to annual productivity growth over ten years. The buildout itself creates demand. Goldman estimates the U.S. alone needs roughly 500,000 net new workers to power data centers and the grid by 2030. If AI raises broad productivity and wages follow, it could lift the bottom arm of the K rather than crush it.
So which is it? In my view, the technology itself is neutral. The outcome depends on policy and adoption, and here is where I get cautious. Policymakers are almost always reactive rather than proactive. Left to run on its own, AI tends to reward capital and high skills first, which widens the gap before it ever narrows. I’d genuinely love to be wrong on this. The setup just doesn’t favor it.
What This Means for Investors
Strip away the politics, and the K-shaped economy leaves investors with a clear instruction. Own the top arm, but respect the bottom one.
The top arm is productive capital. Companies building and deploying AI, chips, cloud platforms, and data centers are at the forefront of a structural shift, not a passing cycle. Demand for automation and analytics doesn’t ebb the way casual dining demand does. Skills-driven sectors belong here, too. Biotech, advanced manufacturing, and specialized services reward expertise and intellectual property, and the firms with real competitive moats tend to compound over long horizons. Asset-rich real estate tied to growth hubs and digital infrastructure fits the same logic, which is why logistics and data-linked facilities look better positioned than legacy retail or half-empty suburban office.
The bottom arm calls for caution, not blanket avoidance. Labor-intensive, low-margin businesses exposed to automation face real headwinds, so I’d be careful owning traditional retail or hospitality without a clear technology story. Even so, defensives still earn their keep. Staples, healthcare, and utilities provide ballast and income when the tape turns, and in an uneven economy, steady cash flow matters more, not less. Add policy to the watch list as well. Inequality is a political flashpoint, which keeps capital gains rates, corporate taxes, and labor rules in play as live risks.
One last point, and it’s the one most investors ignore. Benchmark your progress against your own plan, not against the richest person you know. The investor who measures himself against the 0.001% will always feel behind, and that feeling drives the worst decisions. Chasing the hot trade, abandoning a sound allocation, and taking on risks you don’t need always leads to poor outcomes. The data say you’re very likely doing better than you think. So continue to focus on your personal goals, rather than worrying about what others have.
The K-shaped economy is real, but it’s been badly misread. The middle class isn’t falling into poverty. It’s thinning because it’s climbing, even as a genuine gap opens between those who own assets and those who don’t. AI is about to test which side of that line you’re on. The investors who come out ahead won’t be the ones who panic over the headlines. They’ll be the ones who put capital where the productivity is, protect against the part of the economy that’s truly under pressure, and refuse to let comparison run their decisions.
Tyler Durden
Fri, 06/12/2026 – 13:00
via ZeroHedge News https://ift.tt/WBZyUnC Tyler Durden