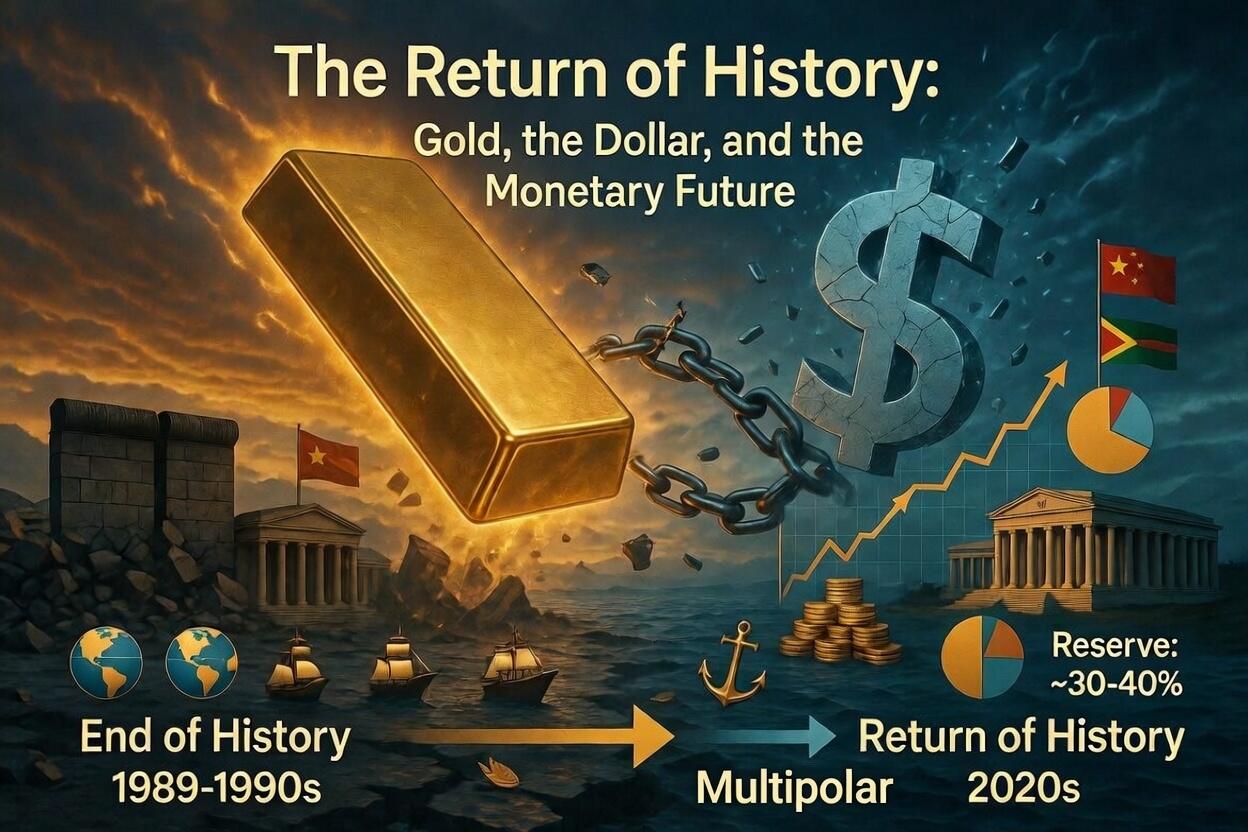
The Return Of History: Deutsche On Gold, The Dollar, & The Monetary Future
Authored by Mallika Sachdeva and Michael Hsueh via Deutsche Bank Research Institute,
In 1989, Francis Fukuyama argued that humanity had reached “the end of history”. In the years that followed, the US became the uncontested hegemon, global trade exploded in a US-defined liberal order, developed market central banks sold gold, while emerging markets accumulated vast amounts of US dollar FX reserves. We argue that the end of history has come to an end. The world is back in a superpower struggle; the US is retreating from free trade, alliances, and security provision; the Great Economic Moderation is behind us; and the dollar banking system has been weaponized. The “return of history” has big implications for gold and the dollar.
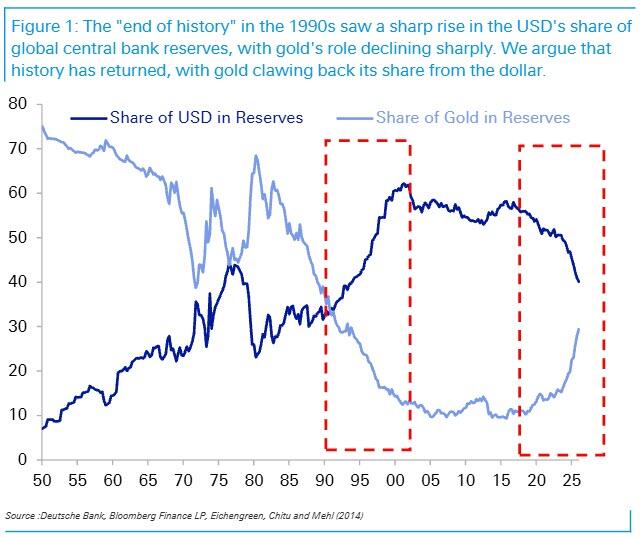
Contrary to conventional thinking, we argue that the share of gold in central bank reserves is not driven by the global monetary system, but by the global geopolitical environment. Gold’s decline as a share of reserves did not happen with the fall of Bretton Woods in the 1970s, but the fall of the Berlin Wall and the assertion of US hegemony in the 1990s. As tectonic geopolitical plates shift again, the share of US dollars in central bank reserves is once more in decline. It has fallen from over 60% to just 40%, while gold’s share has tripled from its lows to 30% today.
We create a framework for the share of gold in central bank reserves as a function of: (1) the volume of gold held by central banks; (2) the price of gold; and (3) the amount of global FX reserves. We see all three pillars on the move, driven by EM. EM central banks have been actively buying gold and driving upward pressure on prices; crucially – their FX reserves may also now begin to structurally decline.
A “return of history” would be consistent with gold getting to at least a 40% share of global reserves. There is significant scope for EM to add towards this. We find that EM countries with closer non-Western defence ties hold more gold. If the world diversifies trade and security dependence away from the US, this would be consistent with less USD and more gold in reserves.
We simulate a range of different outcomes for gold prices depending on the level of FX reserves EM central banks end up with, and the share of gold they target. Even in an environment where EM FX reserves decline to USD5tn, gold prices could still rise to $8000 over the next five years, if EM countries all target a 40% gold share.
For now, EM central bank gold buying likely has to do with preserving the value and accessibility of foreign savings in a changing geopolitical climate. But in the long-run, we consider how gold may one day play a role in anchoring a monetary order that builds independence from the dollar.
All that glitters
The reserves baton is passing back to gold from the dollar
The share of the USD in global central bank reserves has dropped sharply from around 60% at its peak to just 40% today, with attrition accelerating in the past few years. As Figure 1 illustrates, the USD’s share of reserves peaked at the start of this century and sustained those levels for the next two decades before recent losses Importantly, the dollar’s losses as a share of central bank reserves have not gone to other fiat currencies, but to gold.
Gold’s share in global central bank reserves has doubled in the past four years to nearly 30% today. The fact that the gap between the dollar and gold as a share of reserves is now just 10% is extremely notable. As Figure 1 shows, there appears to be a marked reversal underway of the 1990s trend when central banks moved away from gold and towards the USD in their reserves. Before the 1990s, gold had consistently been a larger share of central bank reserves than the fiat dollar. But by the end of the 1990s, the dollar was over four times the share of gold. This seems to now be going in reverse with gold clawing back its share rapidly. What happened in the 1990s and why is this unwinding today? How far can it go and to what end? These are the questions which motivate this paper.
The 1990s began with a declaration by historian Francis Fukuyama that humanity had reached “The End of History.” We argue in this paper that history has returned, but the contest and its leaders will be different. This is the lens through which we think about the resurgence of gold, the decline of the dollar, and the international monetary architecture that may await us this century.
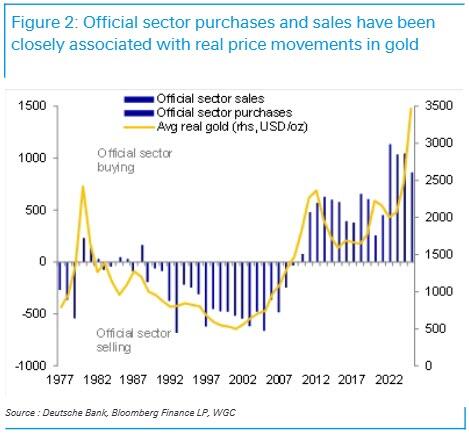
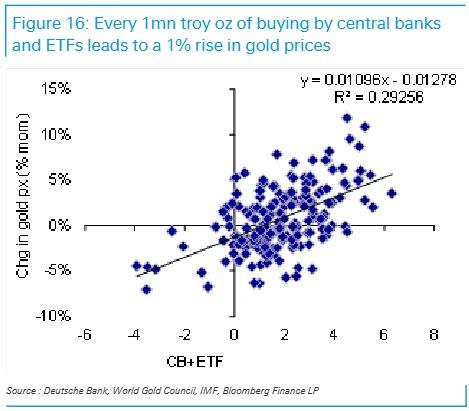
Let’s address the skepticism. Skeptics may say the rising share of gold in central bank reserves is simply reflective of gold price increases. Indeed, around 80% of the rise in gold’s share has been on account of prices. But there is a genuine volume driver underlying this: central bank purchases have arguably themselves been behind significant price momentum. There is indeed a close relationship between official purchases and sales of gold and the change in the real gold price (Figure 2). Volume and prices are thus endogenously related and are both doing the legwork of gold’s rising share.
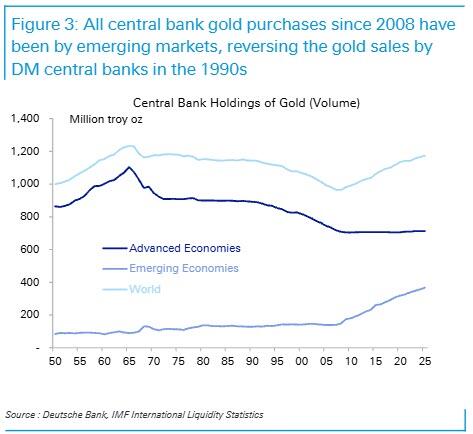
Crucially, all central bank purchases are occurring in emerging markets. As Figure 3 illustrates, it is EM central banks that have been steadily purchasing gold since the 2008 GFC, adding over 225mn troy oz over the past 17 years. Importantly, this is more than advanced economy central banks sold in the 1990s. As we discuss in depth in this paper, we think there could be a long way to go in the trend of EM central bank buying of gold.
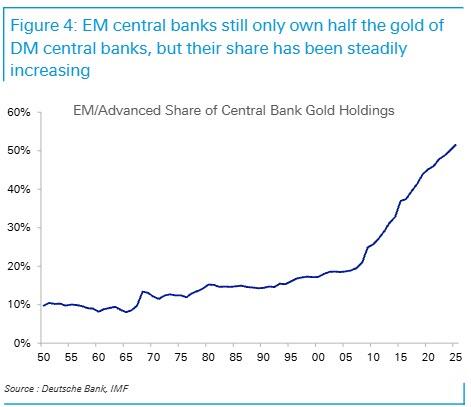
EM central banks still only hold half the amount of physical gold of developed markets. In stock terms, EM central banks held 367mn troy oz at the end of 2025 compared to 712mn troy oz by Advanced Economy central banks, according to IMF classification. This has however been on a steadily rising trend. The ratio of EM/DM central bank gold holding is at around 52%, having risen from just 20% before the 2008 GFC (Figure 4).
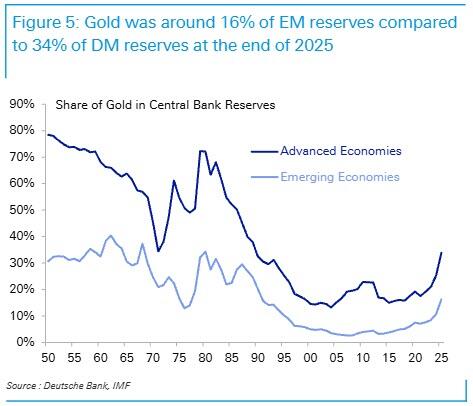
As a share of total reserves (including foreign exchange holdings), which is where our focus in this paper lies, EM central banks had just 16% of total reserves in gold compared to 34% for DM central banks by end-2025. There thus remains a significant gap to close, if not ultimately exceed.
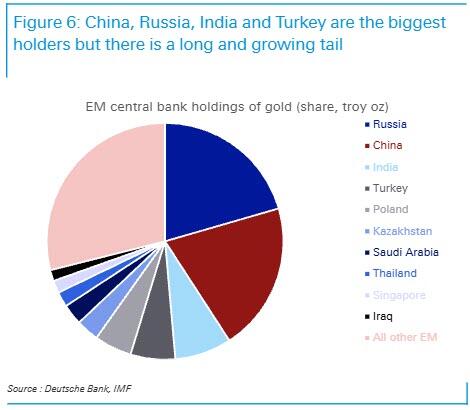
This is not just about the BRICS. Almost half of EM central bank holdings are accounted for by just China, Russia and India. But many middle powers like Turkiye, Kazakhstan, and Saudi Arabia are also significant holders (Figure 6).
Perhaps most notable in recent years is the momentum of purchases in certain regions. Strikingly, in Eastern Europe, more than half of the gold holdings of Czechia and Poland have been acquired in the past four years alone, after Russia’s invasion of Ukraine (Figure 7).
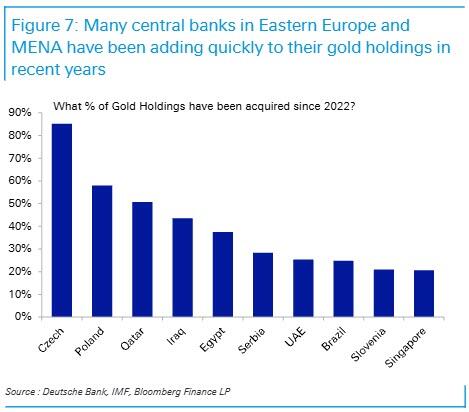
Many MENA states like Qatar, Egypt and the UAE have acquired between 25- 50% of their total gold holdings in the last few years alone. We will be exploring the motivations for these purchases in more detail later in the paper.
A brief history of gold
Gold was the heart of Bretton Woods but did not fall with it
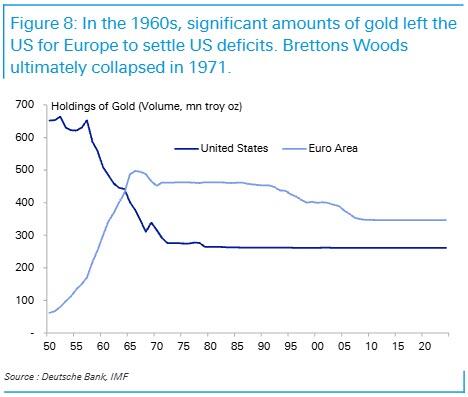
The US had over 70% of the world’s central bank gold reserves after World War 2, and in constructing the Bretton Woods monetary architecture, it used gold to back a system that centered on the dollar.
As Monnet and Puy (2019) explain, the Bretton Woods system – which followed WW2 and lasted till 1971 – was not like the gold standard that preceded World War 1, or that was tried unsuccessfully in the interwar period. Under Bretton Woods, gold was not redeemable against bank notes at a fixed rate everywhere in the world. Nor were central banks strictly required to back currency in circulation with gold reserves. Only the US dollar was convertible into gold at $35/oz by other central banks via the Fed. Gold was essentially only a means of settlement between monetary authorities. Foreign countries could choose to hold their claims on the US in US dollars, or exchange them for gold. As the US began to run balance of payments deficits in the 1950s and 60s, some European countries began to make claims on the Fed’s gold. By the mid-1960s, more gold was held at European central banks than in the US (Figure 8). By 1971, the system collapsed with Nixon ending the US dollar’s convertibility to gold.
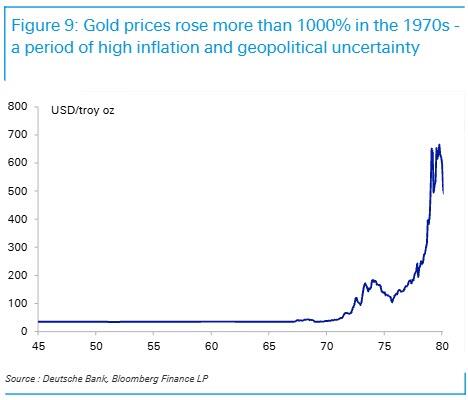
Gold did not however drop as a share of central bank reserves with the fall of Bretton Woods. Even as gold stopped serving a purpose as an official means of international settlement, gold averaged around a 50% share of central bank reserves through the 1970s, albeit with significant gyrations. Notably, it remained more important than the fiat dollar throughout the decade as the earlier Figure 1 depicts. Indeed, the 1970s were a period of enormous price gains for gold which rose more than 1000% in nominal terms through the decade driven by high inflation and geopolitical shocks from the 1973 Arab oil embargo, to the Iranian revolution (Figure 9).
Therefore, even as the global exchange rate system changed in the 1970s, gold’s share in global reserves did not. This points to deeper and different drivers of gold’s role. If central bank gold holdings in reserves were not ultimately only about convertibility of the USD, what were they about? And what brought about the change? We turn to this next.
The end of history
The ultimate decline in gold’s share in global central bank reserves came in the 1990s. As Figure 1 earlier showed, gold fell below the dollar’s share at the start of the 1990s, with the rest of the decade featuring a consistent rise in the dollar and decline of gold. What was behind this crossover?
It was not a transition in the monetary system – which had occurred two decades prior – but a shift in the geopolitical environment that changed the role of gold.
In 1989, Francis Fukuyama questioned whether humanity had reached “the end of history?”. A lot of the 20th century had featured ideological violence, but the ending of the Cold War he believed brought a “triumph of the West, of the Western idea,” “the endpoint of mankind’s ideological evolution” and the “unabashed victory of economic and political liberalism.” The Berlin Wall fell the year of his thesis, and the Soviet Union had fully dissolved by 1991. The US thus became an uncontested hegemon in what appeared to be a geopolitically unipolar world. Japan, which had been the US’ closest economic competitor, was well within the US security and dollar system, and China was still a decade from joining the WTO.
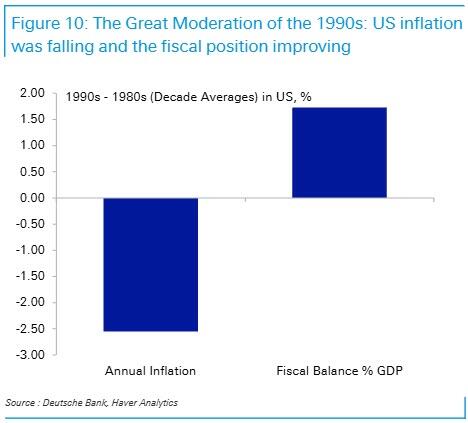
In the economic realm, a lot was changing in the 1990s from the turbulent decades that preceded it. In the US, a “Great Moderation” was underway. Inflation was falling with tight monetary policy having tamed the price instability of the 1970s and 80s. Indeed, average inflation in the 1990s was 2.5% below 1980 averages. The US was running growing fiscal surpluses. The US fiscal position was 1.5% GDP better in the 1990s than in the 1980s on average (Figure 10). The combination of better inflation and fiscal data, and independent central banking raised trust in monetary and fiscal systems, making US Treasuries a more attractive safe asset. Unlike gold, Treasuries paid a positive yield, had a deep and liquid market which made them easy to hold and transact in, and had no storage costs.
Developed world central banks led by Europe thus began to sell gold reserves in the 1990s (see again Figure 2), which came to be seen as a “barbarous relic” (Arslanalp et al, 2023). Countries like Switzerland, UK, Belgium, Netherlands, Austria, Australia, Canada all sold gold. Gold was seen as a vestige of the past, a zero-yielding asset with little role to play, especially in a world where European countries were moving towards a common currency. As gold sales began to impact the price of gold, central banks formalized a Central Bank Gold Agreement to coordinate sales in 1999, a framework that lasted for the next two decades.
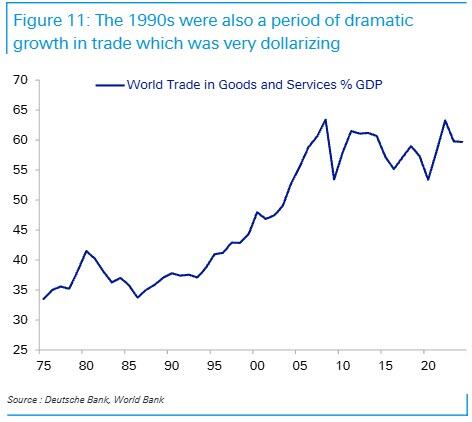
Stabilizing geopolitics, combined with large improvements in technology, communications and transport, led to an explosion in trade and globalization in the 1990s. Trade in goods and services close to doubled as a share of global GDP from 1990 to the 2008 GFC (Figure 11). A rise in global trade contributed to the deepening in dollarization via the channels of invoicing, finance, and the accumulation of dollar surpluses in exporting EM economies. This brings us to arguably the biggest driver of gold’s relative decline against the dollar.
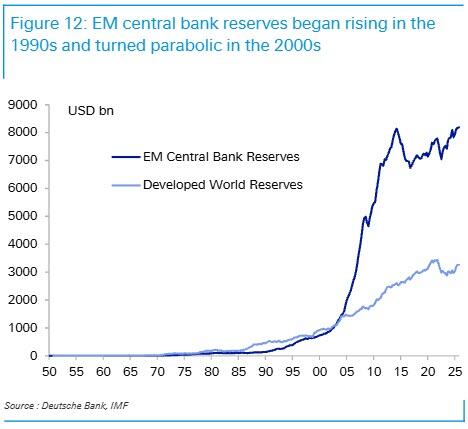
The biggest driver of the decline of gold’s share in global central bank reserves in the 1990s was the meteoric rise of emerging market FX reserves, held in dollars. As Figure 12 illustrates, global reserves began to rise in the 1990s. Japan was the biggest driver in the 1990s, with the baton passing to China in the 2000s alongside a wide swathe of EM countries from Russia, to Saudi Arabia, India, Korea, Taiwan, Brazil and others. The total amount of global FX reserves went up 9 times between 1990-2007. A majority of these reserves were built in USD and saved in US Treasuries given the predominance of the US driven economic and trade order. The Asian Financial Crisis in the late 1990 also led to a deeper preference for self insurance by EM countries and a dramatic shift in favour of building reserves, after the failures of capital account liberalization policies. The IMF itself shifted to encouraging reserves adequacy frameworks that stressed savings in USD liquidity.
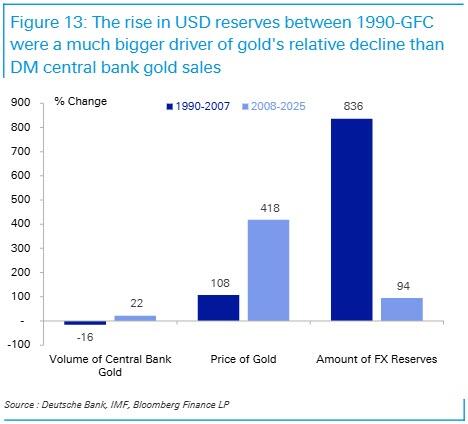
Bringing it all together: one can think of the share of gold in central bank reserves as a function of three things: (1) the volume of gold held by central banks; (2) the price of gold; and (3) the amount of foreign exchange reserves. The former two influence the numerator, while the latter influences the denominator. The decline of gold as a share of global central bank reserves from around 40% on the eve of the 1990s to just 10% by the eve of the GFC was predominantly about the denominator. While developed world central banks were selling gold in the 1990s, this was in fact largely offset by the price increase of gold (Figure 13).
In sum, the biggest driver of gold’s decline in global reserves in the 1990s was the rise of EM FX reserves accumulated in USD. This was in turn a function of dramatic globalization, in a US-driven neo-liberal unipolar order, amidst sound and improving economic fundamentals in the US. By extension, the dollar’s fate as the world’s reserve currency will have a lot to do with how these same countries treat their USD holdings in a de-globalizing world in which the US driven order is fraying: do EM countries still add to USD reserves, diversify away from them into gold, or actively draw them down? The future of the dollar as a reserve currency could well be determined in emerging markets, consistent with our thesis that the Global South will be a much bigger economic and geopolitical force to understand.
The return of history
The drivers of the “end of history” have almost all been going in reverse. The world is back in an ideological struggle between competing economic and political models, this time led by the US and China. Both countries are engaged in growing competition across technology, energy, resources, and influence.The world is no longer unipolar. China is on many metrics a bigger industrial, trade and naval power than the US.
The US is stepping back from free trade and fracturing traditional alliances, with China having positioned itself to step into the fray with years of building trade and investment relationships across the Global South. The provision of global public goods guaranteed by the US – namely freedom of navigation and security for key allied regions – has come into question with the closure of the Straits of Hormuz and the vulnerability of the Gulf in the latest conflict.
If the 1990s was a world where the US was happy to outsource manufacturing and labour to EM, with many EM countries happy to outsource security and savings to the US, this is now reversing. The US is keen to onshore more critical manufacturing, while many EM regions like Asia and the Gulf will be reconsidering their need for strategic autonomy in areas like energy and defence. They may well need the savings they have been investing in the USD to build these capabilities.
On the economic front, the Great Moderation is behind us. US inflation has been above target for over five years, independent central banking has come into question, monetary balance sheets have expanded dramatically under QE, and the US fiscal trajectory is on a worrying path.
Finally, the weaponization of the US dominated banking system with the freezing of Russia’s USD and EUR FX reserves in 2022 has increased the appeal of saving in gold, which can be held physically and locally, away from the arm of sanctions or asset seizures. Indeed, Russia and China hold 100% of their gold locally.
The end of history has itself come to an end, with significant implications for gold and the dollar, which are becoming increasingly apparent.
What the future may hold
EM is not only buying gold, but could soon be selling the dollar too
As discussed earlier, gold’s share in central bank reserves is a function of three main drivers: the volume of gold held, the price of gold, and the stock of FX reserves. For emerging market central banks, all three are on the move.
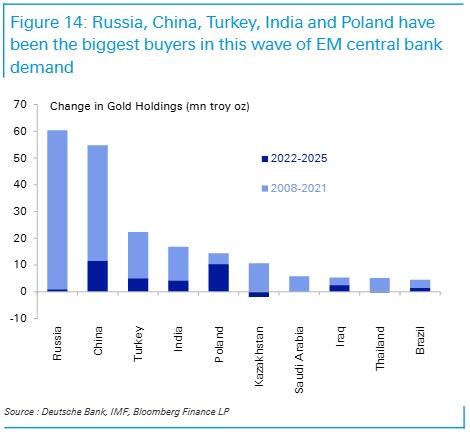
First, EM central banks have been actively buying gold. EM purchases since 2008 exceed the sales made by developed world central bank sales in the 1990s. Figure 14 illustrates the biggest buyers in volume terms since 2008, split between purchases before and after Russia’s invasion of Ukraine (2008-2021 and 2022-25). It is notable that Russia had actively diversified into gold ahead of 2022 (Figure 14).
China has continued to purchase gold at roughly the same pace since 2022, while countries in Eastern Europe, India, and MENA have accelerated gold purchases since then.
It is important to note that our analysis in this paper focuses on IMF data on central bank reserves, which understates the true accumulation of EM official savings in foreign assets. We have chosen to focus on IMF data for a range of reasons: longer time-series history of the data, comparability to COFER estimates of central bank FX holdings, and availability of country level data series. But there are important caveats to this data. While IMF data shows EM central bank reserves have been stagnant in recent years, EM countries have in fact continued to build and recycle savings abroad via large sovereign wealth funds, state banks, and public pension funds. A significant amount of these savings are held in USD, but often with a riskier, less liquid profile across equities and private markets rather than necessarily US Treasuries. Global SWF pegged sovereign wealth fund holdings in Asia and MENA at over USD12tn in March 2026, greater than the size of their central bank holdings.
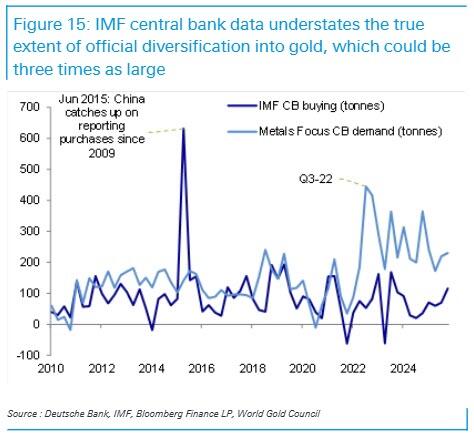
If IMF data on central bank reserves is understating the true extent of official foreign savings in EM, it is also understating the full extent of official diversification into gold. Indeed, a series by the World Gold Council (WGC) that tracks quarterly demand by “Central Banks and Other Institutions” and is believed to include sovereign wealth funds and other state-directed flows, shows gold purchases at three times the pace of the IMF series since 2022 (Figure 15). IMF data shows roughly 10 mn troy oz of annual purchases in the past four years by central banks, while the WGC series pegs this at over 30mn troy oz or over 1000 tonnes per year. While this does not change the trend or conclusions of this paper, it does suggest scope to magnify already significant implications.
Second, central bank purchases are driving upward pressure on gold prices. Central banks and official institutions as defined by the WGC have accounted for over 40% of the investment demand for gold since 2022, excluding demand for jewelry, technology and industrial purposes. ETF purchases which picked up meaningfully last year may themselves be piggy-backing off the consistent underlying bid from central banks. A simple regression that looks at central bank and ETF demand suggests that every 1 mn troy oz of purchases leads to a 1% increase in the gold price (Figure 16). We adopt this as a simple back-of-the-envelope heuristic, to be used in analysis below.
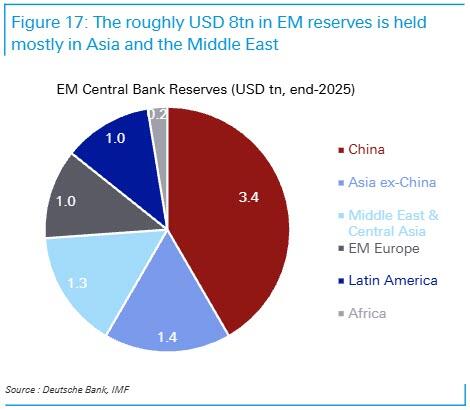
Third, the enormous build of foreign exchange reserves in emerging markets may now go into reverse. As discussed above, the dramatic rise of the dollar’s share in global central bank reserves in the 1990s had almost everything to do with the sharp rise in EM reserves. There is a possibility that EM reserves may begin to decline from here. This would be motivated less by foreign investor capital exits or the need to defend currencies, but as countries in Asia and the Gulf draw on their savings to build strategic autonomy in defence and energy, which will require capital, imports and investment. While a majority of the roughly USD8tn in EM central bank reserves are held in China, a significant share are also in Asia ex-China and Middle East & Central Asia (Figure 17). Recent reports that the UAE has asked the US Treasury for a currency swap, suggests the need for USD liquidity. Indeed, the Gulf may turn to their savings not just to tide over the effects of the ongoing war, but for rebuilding efforts, to address economic scarring and diversification needs, and ultimately to build greater domestic defence resilience.
The first two forces are already underway. EM central banks have been actively buying gold and prices have been rising. The third force of active reduction in US holdings is yet to begin, but could be very significant. All three drivers could be at play together, suggesting there is more to go in gold’s rise and the dollar’s decline as a share of global reserves. Where might they end up?
What share of reserves should gold be?
The combination of gold purchases and price rises has already pushed gold’s share of global central bank reserves to around 30%. Where might we go from here?
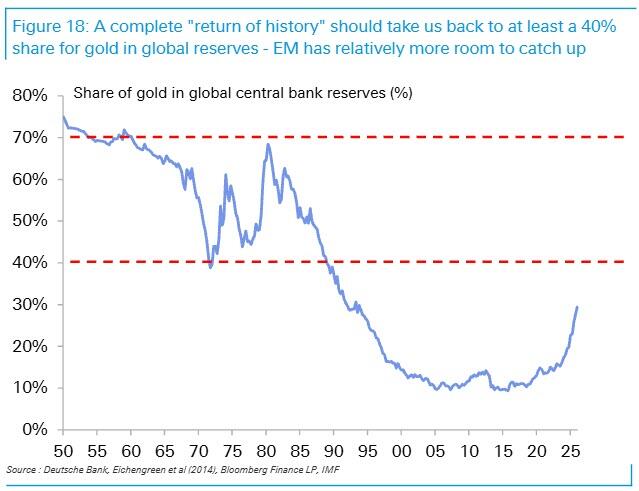
There is likely still a long way to go. We begin with the key observation that before the 1990s, gold’s share of reserves fluctuated between 40-70% of total reserves as illustrated in Figure 18. “The return of history” we described above should make getting to the lower bound of this range – or 40% for gold’s share – a reasonable initial target. If the world is going back to looking like it did before the 1990s – with geopolitical competition between superpowers, high inflation, and less universal support for free trade – then it may make sense to expect gold’s share of reserves to also go back to similar levels. While before the 1990s, emerging market central banks held very little total reserves, today they are the dominant holders of reserves. And whilst the share of gold in advanced economies reached 34% at the end of 2025, or fairly close to the 40% level, it was only 16% in emerging markets. If the dominant trends of central bank purchases and USD reserve sales are taking place in emerging markets, then there could still be a long way to go: from 16% to 40%.
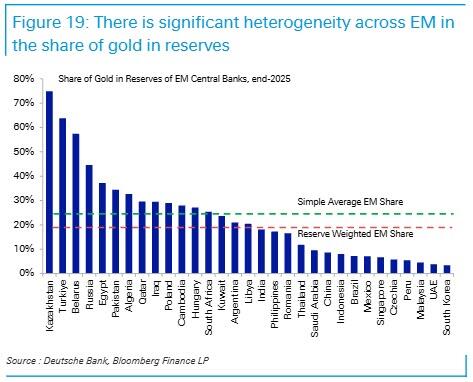
There is a lot of heterogeneity across EM in gold’s share in reserves. While EM central banks as a whole held 16% of reserves in gold (end-2025), this masks large variation. The average has a downward bias driven by the largest reserves holder – China: PBOC holds only 9% of reserves in gold. Clearly, the scope for increase driven by China is huge. Kazakhstan and Turkiye had over 60% of their reserves in gold, Russia and Egypt near 40%, Poland and Hungary had reached nearly 30%, while traditional US allies like South Korea and UAE had under 5% in gold.
Academic literature explains this heterogeneity through both an economic and geopolitical lens. Arslanalp, Eichengreen and Simpson-Bell (2025) argue that “central banks operating floating exchange rates hold more gold, consistent with the presumption that they have less need to use their reserves in foreign exchange market intervention.” Indeed, gold holdings are less effective in helping central banks defend currencies against large scale capital flows. Thus, an increasing share of gold may reflect less concern amongst EM central banks about sudden stops or withdrawals of capital, especially with foreign ownership at lower levels than in the past. More interestingly, they find that “geopolitical alignment with the United States, proxied by the existence of a defence pact, increases dollar reserves. An interpretation is that governments grateful for US military presence encourage their central banks to hold dollars as a show of good faith.”
We also find that EM countries with closer defence ties to the Western bloc hold less gold in reserves, while EM countries with closer ties to China and Russia hold more gold. We draw on an analytical metric first used in our Global South framework to measure military alignment. We look at SIPRI data on arms imports for all emerging market countries over the last 10 years and calculate the proportion of arms imports from the “Eastern bloc”, which we define as including China and Russia, versus the “Western bloc” which includes the US, Israel, Europe, and South Korea. We split EM countries into two groups: those that import more than a third of arms from the “Eastern bloc”, and those that have limited defence integration with China and Russia. As Figure 20 illustrates, EM countries in the former group have double the share of gold in reserves than the latter group.
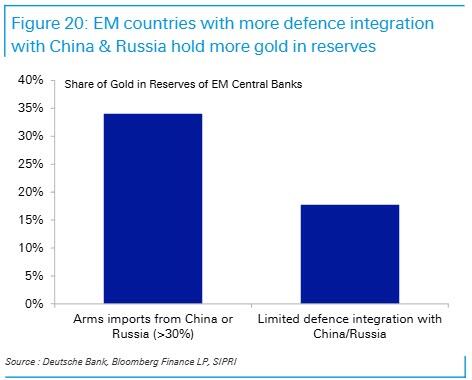
The implication of this analysis is that should more countries diversify defence dependence away from the US, this would be consistent with a reduced share of USD and a greater share of gold in reserves. The US has actively pressured major allies like NATO, South Korea and Japan to take on more ownership for their defence. And we have written about how the US-Iran conflict has challenged the US security umbrella over the Gulf and thereby support for the petrodollar and dollar savings. And while the ultimate geopolitical equilibrium remains to be seen, we think it could lead to some diversification of Gulf ties away from the US, and an acceleration in the localization of defence capabilities.
What might this mean for gold prices?
We simulate a range of different outcomes for gold prices depending on the level of FX reserves EM central banks end up with, and the share of gold in reserves they target.
-
For total FX reserves, we consider four potential scenarios: a steady state for EM FX reserves of USD8tn (similar to current levels); and then three alternatives: a drastic decline in EM FX reserves to USD2.5tn, a decline to USD5tn, or an increase in EM FX reserves to USD10tn.
-
For the share of gold in reserves, we look at a range of different shares rising from 15% to 40%. As discussed earlier, a 40% gold share could be a reasonable target for a “return to history” scenario, while 15-20% is where EM central banks are as a whole today.
-
We use our earlier heuristic that every 1mn troy oz of purchases (sales) drives a 1% increase (decrease) in the gold price for our analysis. Our simulation is therefore dynamic, as we assume gold purchases by central banks influence the gold share through their impact on the prices as well. The rise in gold’s share captures the blended impact of both prices and volumes.
The table in Figure 21 shares our simulation results. Prices shaded in green are above current gold prices (at the time of writing), while prices shaded in red are below. The numbers are not intended to be forecasts (found here), but to illustrate the range of potential price impacts from different combinations of EM central bank behaviour.
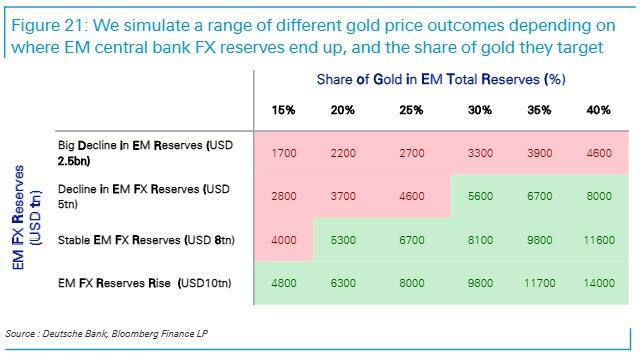
As intuition would suggest, if EM central banks are targeting a rising share of gold in a steady or growing FX reserves environment, this would be the most bullish outcome for gold. But even in an environment where EM FX reserves decline to USD5tn, if central banks target an increase of gold’s share to 40%, this could still be consistent with gold prices rising to near $8000 over the next five years. We walk through the calculation in the simulation to illustrate. At USD5tn in FX reserves, gold would need to be worth USD3.3tn for gold to be a 40% share. Getting to USD3.3tn in gold would be a function of central banks buying more gold, and that buying driving up prices. Assuming every 1mn troy oz of purchases drives up gold prices by 1%, if EM central banks build gold holdings to 417mn oz, or an additional 52mn oz, this would drive up prices to around $7977, which would put total gold valuations at around USD3.3tn. At the current pace of gold purchases of roughly 10mn troy oz per year by central banks (based on IMF central bank only data series), this would be consistent with five more years of gold buying. In other words, EM central banks could push gold prices to $8000 over the next five years even in a declining FX reserves environment.
In the extreme case of EM FX reserves falling to USD2.5tn, the current volume of gold held by EM central banks at current prices (USD1.7tn), would already give gold a 40% share. There is thus no upside to gold projected in the first row of the table.
This simulation also helps us understand the price action of gold in March 2026 during the Iran war. IMF reserves data for the month of March showed overall EM central banks sold gold, led by Turkiye. These gold sales are likely a function of the fact that Turkiye has a high share of gold in reserves at over 60% which were therefore leveraged for liquidity. As our colleagues note, net FX intervention by the CBT reached USD23bn in the last two weeks of March, and the CBT mobilised around USD 20bn worth of gold — USD 11.1bn via gold-FX swaps and USD 8.2bn through outright gold sales. While acute, this is not likely to be representative of a broader trend in EM. Countries from Poland to Kazakhstan were still buying gold in March according to IMF data, and China’s PBOC data also shows buying at the fastest pace in a year. Most EM countries have gold shares at far lower levels than Turkiye with significant scope to raise them.
If more of the rise of gold’s share for EM central banks is achieved through the drawdown of FX reserves, this will be less bullish for gold. If, however, EM FX reserves are stable or fall more gradually, and central banks engage in active buying of gold to raise their gold shares, this will be more bullish for gold.
What does this suggest about the monetary order to come?
As this paper has discussed, central banks in emerging markets have been actively adding to their gold holdings. The rationale for this is mostly seen as being about diversifying official savings into a physical long-lived asset, that can be held beyond the reach of sanctions, and which is likely to hold value better than fiat currencies amidst greater fiscal and inflation risks.
But it is worth considering whether the build up in physical gold in emerging markets might be a precursor to a potential return of gold as an anchor for an alternative future monetary system. Since the collapse of the Bretton Woods, gold has not had a formal role in international monetary architecture. But history has long alternated between periods of fiat and physical-backed money. It would be consistent with – not counter to – history, to expect gold to return at some stage.
The US backed the dollar with gold when it created the post-war monetary architecture of Bretton Woods. It would thus be intuitive to expect any effort by other countries looking to create a bigger role for their currencies in payments and savings to also turn to gold. Gold has been part of monetary orders for over 2500 years and is not anyone’s liability. And while production does expand supply – with above-ground gold stocks growing at around 2% a year this century – this is less than the growth in most countries’ fiscal deficits. For countries in the Global South, where economic regimes, rule of law, and capital account openness, may be less well understood by global corporates and investors, backing payment currencies with a share of physical gold could be an important trust-building mechanism.
While far from formalized as policy, there are pockets of discussion around gold playing a role in backing a future BRICS currency. A paper from OMFIF, an independent think tank for central banking, economic policy and public investment, noted that the “BRICS are exploring the creation of a common currency that would be pegged partly to gold and partly to a basket of their own currencies.” They noted that “by tokenizing gold reserves, each digital unit would be backed by tangible assets stored in secure vaults, with regular audits ensuring accountability.” They note that a “gold linked alternative BRICS payment system” could again give gold a “distinct role in payments.” Media reports in late 2025 indeed noted the pilot release of a BRICS Unit backed 40% by physical gold and 60% by an equal split of CNY, RUB, INR, ZAR, and BRL fiat currencies. We would stress that the “Unit” does not appear to be formal policy by the BRICS and thus should be considered more a thought experiment at this stage. But the momentum for creating alternative payment rails that facilitate local currency payments in the Global South are well underway. For instance, Project mBridge has already reached minimum viability for payments and involves central banks in China, Saudi Arabia, UAE, Hong Kong, and Thailand settling cross-border trade via wholesale CBDCs over the blockchain.
The economic clout of China and the Global South in PPP-adjusted GDP already exceeds 50% of the world today, and a majority of global trade flow growth is happening down these corridors. Payment innovations in this part of the world should thus be paid heed. We have written in great detail (see here) how competition around payments is heating up and how this is deeply linked with reserve currency status through the linkages between invoicing and savings. The US has opted for stablecoins as its solution to ensuring dollar dominance, namely in the Global South where traditional USD payments mechanisms were at risk. We note that while US stablecoins would be backed by US T-bills, a BRICS currency of the future could well be backed in part by physical gold.
In sum, while EM central bank diversification into gold likely has much to do with preserving the value and accessibility of their foreign savings in a changing geopolitical climate, it may also – in the long-run – play a role in anchoring a monetary order that builds independence from the dollar. There is of course a very long way to go. EM central banks as a whole still only hold half the physical gold of advanced economy central banks. But there is a world where gold returns to the centre of a future monetary system with different leaders.
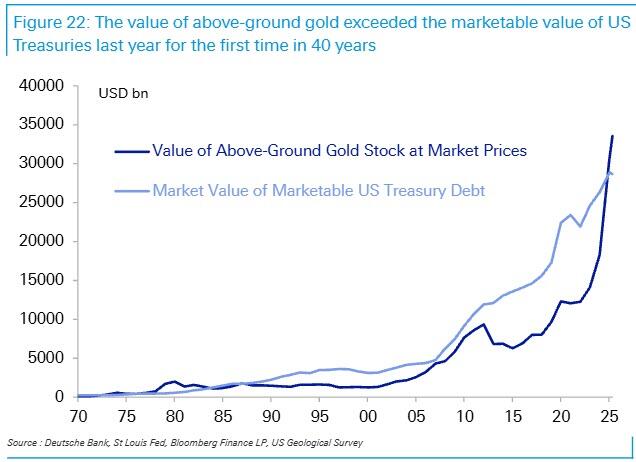
To conclude, we find it notable that the value of above-ground gold exceeded the total value of marketable US Treasury debt last year for the first time in 40 years (Figure 22). In other words, gold is now a bigger asset class than the world’s main safe asset.
The return of history is here.
Professional subscribers can read the full Deutsche Bank note: “The return of history: gold, the dollar, and the monetary future” here at our new Marketdesk.ai portal
Tyler Durden
Sun, 05/10/2026 – 06:33
via ZeroHedge News https://ift.tt/oV8xvzC Tyler Durden