Tesla’s Musk Says “Limited” Full Self Driving Beta To Be Released Next Week Tyler Durden
Mon, 10/12/2020 – 13:45
After taking deposits for Full Self Driving for almost a half decade and just watching Nikola’s Trevor Milton publicly skewered for delivering a semi truck that didn’t have the capabilities he insinuated that it did, perhaps a light bulb has started to go off in Elon Musk’s head that it would be wiser than not to try and deliver on some of the promises of days past he has made.
And now that Tesla has been anointed a $400 billion market cap by Softbank’s options traders and the NY Federal Reserve capital markets, Musk may actually have some firepower to try and tackle problems that seemed “too big to not fail” while Tesla’s valuation was still budding.
Enter Full Self Driving; the $8,000 vaporware that Musk has been “selling” to Tesla marks customers for years without actually delivering. It now looks like the day has finally come: Musk has said that the company is going to be releasing a “Full Self Driving” beta release on October 20 to a “small number of people”.
The software is supposed to allow Tesla vehicles to react to stop signs, stop lights and freeway exits.
Musk had said last week, responding to ARK Invest analyst Tasha Keeney, that a limited beta was coming “in a few weeks”
Waymo is impressive, but a highly specialized solution. The Tesla approach is a general solution. The latest build is capable of zero intervention drives. Will release limited beta in a few weeks.
To us, it seems like a convenient promise; enough of a gesture for Musk to say he fulfilled his previous promise of having Full Self Driving complete by the end of 2020, but a small enough testing size for Musk to not truly have to debut anything of substance on a grand scale.
The sample size is likely going to include Tesla employees and possibly “some customers” that “agree not to share details with the public”, according to Benzinga.
“Musk says the latest update will allow the possibility of zero interventions,” Benzinga noted. “While drivers would still need to be ready to take over at any time, it’s possible this means a vehicle could drive from point A to point B without any driver input.”
We’ll believe it when we see it work, in action, without killing drivers – not when we pay $8,000 for it.
via ZeroHedge News https://ift.tt/36YzWzi Tyler Durden
The global oil supply path into 2021 is in focus this week, along with the impact of storms on US oil output. Away from oil, we also survey the outlook for LNG demand in Asia and the European power mix, and look at the key factors driving the copper market.
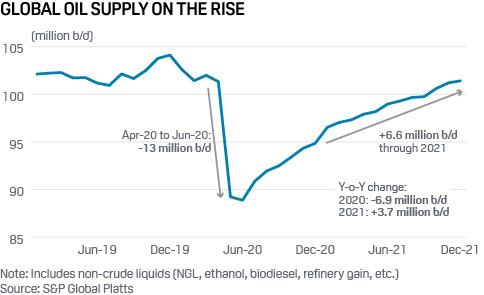
1. OPEC+ compliance, Libya output to drive global oil supply growth in Q4
What’s happening? Global oil supply has increased by 3.6 million b/d from July through September after dropping more than 13 million b/d from April to June. This is despite a more active hurricane season in the US Gulf, which has temporarily removed upwards of 100,000 b/d of crude oil production. OPEC+ has carefully managed providing additional barrels to the market as oil demand has recovered from peak pandemic impacts seen in Q2.
What’s Next? Supply increases are set to slow starting 4Q 2020 as OPEC+ pushes for compliance and cohesion. OPEC will meet towards end-November to review market demands and quotas. Production increases in Libya are expected to be choppy and sustainability is uncertain. Geopolitics will take center stage with US presidential elections in November. If the Democrats win the White House some sanctioned barrels (Iran, Venezuela) could re-enter the market. S&P Global Platts Analytics forecasts show non-OPEC supply growth over 2020 and 2021 will be limited to few key areas – Norway (300,000 b/d), Brazil (320,000 b/d), Guyana (120,000 b/d), and Canada (85,000 b/d). Declines will be widespread with the US seeing the biggest falls, of 865,000 b/d in 2020 and more than 1.14 million b/d in 2021.
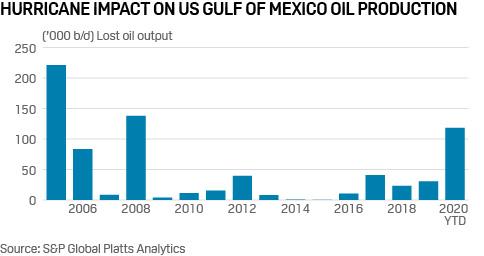
2. High hurricane count slashes US Gulf oil production
What’s happening? Hurricane Delta is on track to surpass Hurricane Laura as most disruptive so far this season. As of Oct. 9, 92% of crude oil and 62% percent of natural gas production was shut in. Production will begin to return after the storm passes, but it can take as long as 2-3 weeks for full ramp-up, depending on damage and storm severity.
What’s next? With 25 named storms, it is the second most active Atlantic hurricane season on record, behind only the 2005 Atlantic hurricane season. It is also only the second tropical cyclone season to feature the Greek letter storm naming system, with the other season again being 2005. Production outages this season will rival peak levels seen in 2005 and 2008. The US hurricane season runs through end-November, though the probability of landfalls and storm intensity is past peak as weather turns cooler and the jet stream pushes deeper south out of Canada.
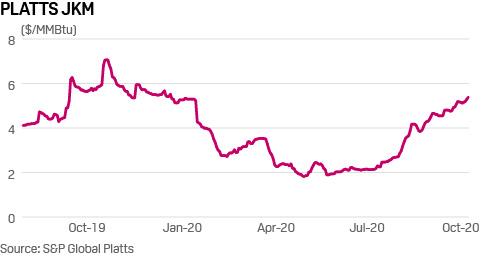
3. Asian LNG prices hit 11-month high on winter procurement, outages
What’s happening? The Platts JKM for November was assessed at $ 5.535/MMBtu Oct. 9, its highest in 11 months, after spending much of the year languishing in the $2-$3 range. Some buying interest has emerged from North Asian buyers like Japan and South Korea. There was also a flurry of activity from Pakistan, with tenders being issued for at least nine spot LNG cargoes for this winter in a single week. The country’s government has allowed unutilized LNG terminal to be auctioned, and domestic gas production has been on the decline. On the supply side, Norwegian facilities have been affected by strikes and accidents, and US LNG terminals and gas production shuttered last week in anticipation of Hurricane Delta making landfall.
What’s next? Asian LNG markets are expected to continue tightening due to global producer outages and an uptick in winter procurement from regional buyers. There are indications of healthy downstream demand in North Asia, although high storage inventories are capping demand growth and much of the peak winter demand will depend on colder temperatures going forward.
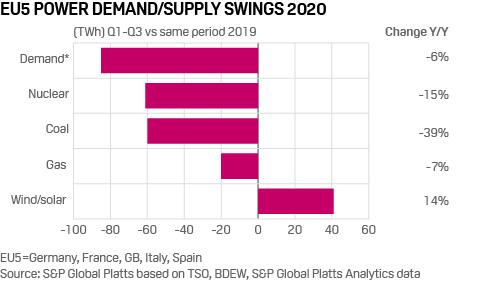
4. European power demand down 6% in 2020, but Q4 tightness in focus
What’s happening? Power demand in Europe’s five biggest markets has fallen 6% in the first three quarters of 2020 as the coronavirus pandemic reduced economic activity, data analyzed by S&P Global Platts show. The 85 TWh demand equates to the entire nine-month consumption of the Netherlands. Nuclear absorbed much of the drop, with generation down 61 TWh, while wind and solar output increased 41 TWh year on year. Coal continues to beat a steady retreat, down 39% or 60 TWh YoY, while gas generation was stable on year and up over a two-year view. Gas-fired generation now accounts for over 20% of power demand in the five markets, becoming a significant swing factor in the traditionally coal-dominated German market.
What’s next? While electricity demand is unlikely to see on-year gains before 2021, all eyes are on supply dynamics going into Q4 2020 after warnings of regional tightness across northwest Europe in September. French nuclear has been ramping up sharply and could soon erase deficits running since November last year, while new wind capacity will feed into the general thesis of greater surpluses at times, but also greater volatility when the wind drops. September price spikes reminded the market that lulls in wind can affect the whole of northwest Europe, prompting price-inflation competition on interconnections between the UK, France, the Netherlands and Belgium. Rising gas and falling CO2 prices have reduced gas generation’s advantage over coal, but clean spark spreads still justify the recent return of CCGT units in Germany and the Netherlands.
What happened? Copper has been on a run higher since the initial pandemic-induced sell-off. Back in April, mine closures boosted the metal, but now there are a variety of factors at play including Chinese stimulus spending, the reopening of economies and general buoyancy in global equities. Another boost came from the UK government’s announced plan to power every home in the UK with wind power by 2030. The turbines required can have anywhere up to 6 mt of copper in them. This news sent the price even higher over the past week, helping copper to recover from a brutal sell-off linked to an increase of around 100,000 mt of metal in LME-registered warehouses.
What’s next? The bullish factors listed above appear to be negating the fact that global copper stockpiles are up, and a second wave of coronavirus is sweeping across Europe. The metal could go either way, but for now many seem to be positioning for a break towards $7,000/mt.
via ZeroHedge News https://ift.tt/3lEYUI8 Tyler Durden
Virus Could Push 150 Million People Into Extreme Poverty Tyler Durden
Mon, 10/12/2020 – 13:15
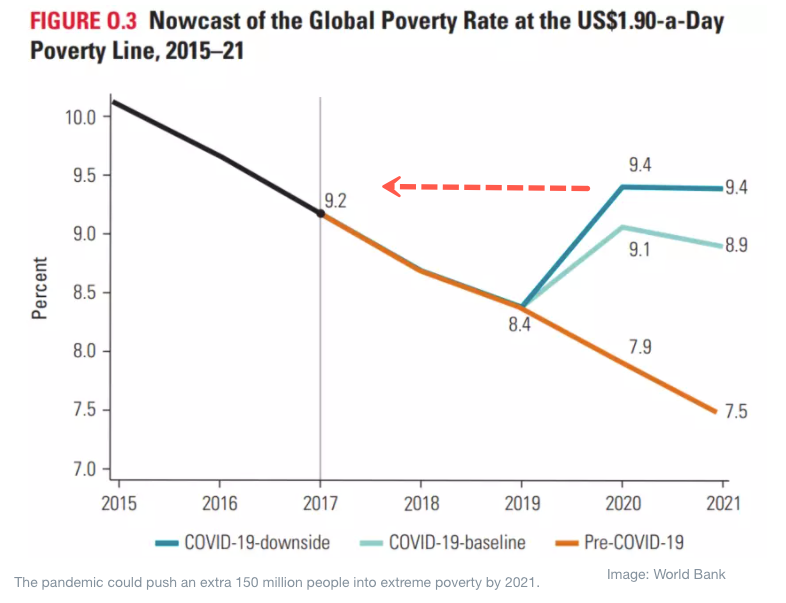
The World Bank suggested upwards of 150 million people could be pushed into “extreme poverty” due to the virus pandemic, erasing nearly three years of progress in global poverty reductions.
According to the report, for the first time in two decades, the virus pandemic, compounded by the effects of climate change, are slowing poverty reduction progress, resulting in an additional 88 million to 115 million people falling into extreme poverty this year, with total estimates of 150 million in 2021, depending on the economic recovery shape.
The biennial Poverty and Shared Prosperity Report defines “extreme poverty” as living on less than $1.90 per day, which is likely to affect between 9.1%-9.4% of the world’s population this year. With the world’s poverty rate expected to rise this year, it would mean extreme poverty is at 2017’s 9.2% level, marking the first rise in the poverty rate in two decades. The rate was expected to drop to 7.5% by 2021 before the coronavirus pandemic.
World Bank President David Malpass stated the virus pandemic and a global recession is a “serious setback to development progress and poverty reduction.”
About 10% of the world’s population lives on less than $1.90 per day, close to 25% live on less than $3.20 per day, and about 40%, or about 3.3 billion people on planet Earth, live on less than $5.50 per day.
“The current moment of crisis is extraordinary. No prior disease has become a global threat so quickly as Covid-19. Never have the world’s poorest people resided so disproportionately in conflict-affected territories and countries. Changes in global weather patterns induced by human activity are unprecedented,” said the report.
The report estimates by 2030, the global poverty rate could decline to 7%, but as Malpass explained:
“In order to reverse this serious setback to development progress and poverty reduction, countries will need to prepare for a different economy post-COVID, by allowing capital, labor, skills, and innovation to move into new businesses and sectors. World Bank Group support—across IBRD, IDA, IFC, and MIGA—will help developing countries resume growth and respond to the health, social, and economic impacts of COVID-19 as they work toward a sustainable and inclusive recovery.”
Much of the new poor will be concentrated in countries with already high poverty rates.
“A number of middle-income countries will see significant numbers of people slip below the extreme poverty line. About 82% of the total will be in middle-income countries,” the report estimates.
A similar World Bank report was released in August when it called for upwards of 100 million people to slide into extreme poverty. Both reports are evident of global poverty rates continuing to worsen.
A top IMF official recently pointed out that the global recovery could take years – the 2020s could be a lost decade with soaring wealth inequality as governments worldwide are overwhelmed by poverty.
via ZeroHedge News https://ift.tt/36XWkJp Tyler Durden
Whether Trump or Biden is elected in November, they will have to decide whether or not to appoint Federal Reserve Chair Jerome Powell to another term.
And if he is appointed again, the way he continues to handle the continuing ripple effects of the COVID-19 “shutdown” economy will be critical.
So let’s examine why the decision to reappoint him is important, then take a quick tour of some of Powell’s recent performance.
A piece from Paul R. La Monica provides a take on the importance of Powell’s re-appointment, beginning with the response to the market’s plummet earlier this year:
The Fed quickly lowered rates to zero in March and has since launched trillions of dollars worth of lending programs… Powell’s swift actions have won him praise from many economists and investing experts on Wall Street.
“Powell should get a second term if he wants it. He deserves credit for the speed and magnitude of the Fed’s response to Covid-19,”said Larry Adam, chief investment officer of Raymond James.
Mr. Adam and the article are correct on one point. The Powell-authorized “moon shot” in response to a dramatic market drop was certainly a fast move.
George Calhoun, professor of quantitative finance at the Stevens Institute of Technology, agreed with Powell’s quick decision to print trillions:
When the crisis hit, Powell went all out and opened the spigots. I’m not sure what rationale would be to have someone totally different at the Fed. Monetary policy has been effective.
Any person in Powell’s position could have made the same call, of course. We just have to hope that the long-term ripple effects don’t eventually reveal that his reaction was too much, too fast, or perhaps unnecessary.
A quick look at Powell’s performance since 2018 should, at the very least, raise questions.
Inflation, Confusion, and Repo Market Desperation… Oh My!
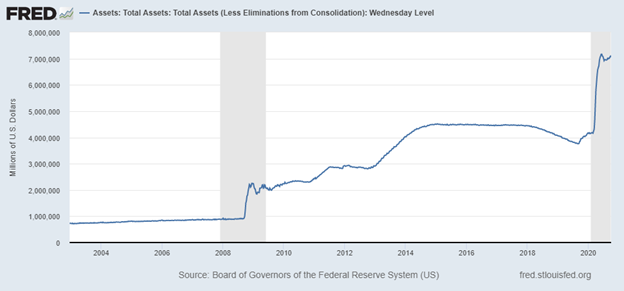
Here’s what March’s monetary “moon shot” looks like on the Fed’s official balance sheet:
It’s fairly obvious from this chart that Powell’s attempts starting in 2018 to reduce the balance sheet were not very successful.
Then there’s the yield curve. An inversion of the 2-year and 10-year treasuries has preceded every major recession for the last 50 years. Powell chose to sweep this market signal under the rug in 2018.
The yield curve inverted a second time in June 2019. You can see from the chart above that the St. Louis Fed considers February 2020 to be the start of another recession. So the inverted yield curve seems to have proved accurate once again.
But Powell’s problems in 2019 didn’t end with inverted bond yields. In September 2019, the repo markets went haywire. This forced Powell to make some “QE-like” moves to flood the repo markets with billions of dollars to keep them from freezing up.
In December 2019, it was discovered that four big banks were at the root of the repo market fiasco, so who knows if Chairman Powell “had” to print money in the first place?
Which Brings Us to 2020…
In addition to the Fed’s “moon shot” in March, Powell did an unusual “about face” on his former position regarding the $27 trillion in U.S. debt saying, “Now is not the time to act on those concerns.”
Intervention after intervention by Powell’s Federal Reserve and it remains to be seen what exactly is being accomplished beyond barely keeping the economy afloat (when all market factors are considered).
Just last month it seemed like a “confused” Fed couldn’t find and report the rapidly increasing food price inflation being caused by Powell’s most recent intervention.
(Hint: We found it, and once energy costs start rising again, we could be talking about hyperinflation in the U.S., but that’s a topic for another article.)
So the question remains: Should Federal Reserve Chair Powell be appointed for another term? Only the next President will make the call on that, of course.
But if the U.S. is returning to “inflation nation” again – a process that Powell started – then your retirement could be put at risk.
Hedge Against Potential Inflation With Gold and Silver
Examine your savings now, before it’s too late. Then consider whether to shift some of your assets to make it more resilient to Fed interventions.
Holding assets such as physical gold and silver can help to hedge against an inflationary economy, no matter what the future brings.
* * *
After 8 long years of ultra-loose monetary policy from the Federal Reserve, it’s no secret that inflation is primed to soar. If your IRA or 401(k) is exposed to this threat, it’s critical to act now! That’s why thousands of Americans are moving their retirement into a Gold IRA. Learn how you can too with a free info kit on gold from Birch Gold Group. It reveals the little-known IRS Tax Law to move your IRA or 401(k) into gold. Click here to get your free Info Kit on Gold.
via ZeroHedge News https://ift.tt/3nGNs0w Tyler Durden
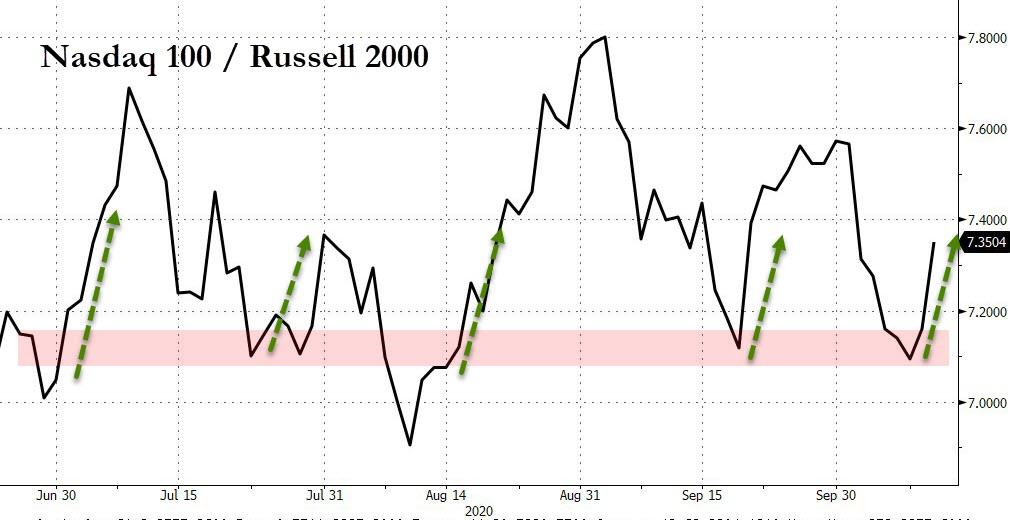
Heading into the weekend, we observed that despite the recent drift higher in the Nasdaq last week after its September correction, institutional investors remained skeptical with a near-record number of non-commercial spec shorts in the Nasdaq 100 mini according to the latest CFTC Commitment of Traders report, and after spiking to a historic level just two weeks earlier, the negative bets on the Nasdaq stubbornly persisted…
… perhaps in response to the recent surprisingly bearish note from Morgan Stanley which warned that the tech plunge would accelerate, and which forced many institutions into bearish positions.
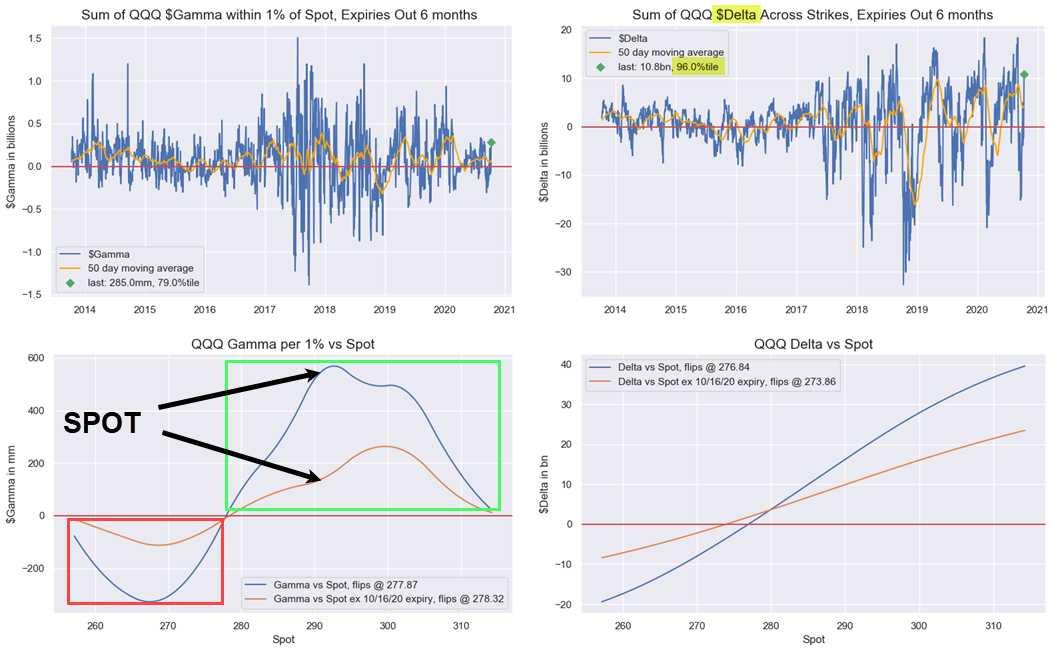
But it wasn’t just the painful short in NQ futures that set off today’s harrowing move higher in the Nasdaq: as Nomura’s Charlie McElligott wrote in his morning note when looking at today’s exponential “panic grab” price-action in Equities futures, “the buy flows are being driven by a legacy dynamic in SINGLE-STOCK VOL which you’re now well-familiar with, where we see massive upside call strikes suddenly back ‘in-play” on the meltup this week into their Friday’s expiration in some of those mega-cap Tech stocks (AMZN in particularly, bu ADBE and NFLX as well) that traded back in August, forcing what looks to be “short Gamma” -type buying / hedging this morning from the Dealer short them in order to stay neutral.”
Said otherwise, the same “gamma squeeze” dynamic we observed in mid/late August when Masa Son’s SoftBank ended up buying billions in call spreads, sparking a meltup in tech names is back, and just like in August, liquidity is dismal. As JPMorgan strategist Shawn Quigg wrote last week, the market’s low liquidity environment “lays the groundwork for dealer positioning (i.e., gamma imbalances) that can further exacerbate existing market trends, and volatility dynamics (e.g., prices up/volatility down to prices up/volatility up). As such, market participants now closely follow large dealer gamma imbalances ahead of potentially impactful macro events, primarily in options on the S&P 500, to gauge potentially trend accentuating dealer flows.“
Alternatively, if the “Nasdaq whale” so wishes, dealers can be squeezed by a rerun of the August meltup, something which we are seeing in real time today, with the help of a handful of exceptionally large trades in thin markets which as JPM admits, “increase the potential for exacerbated stock moves as dealers hedge exposure.” That said, back in August NQ futs were well in the green, so this time we also have the short squeeze of futures traders to consider as risk explodes higher amid the concurrent gamma squeeze.
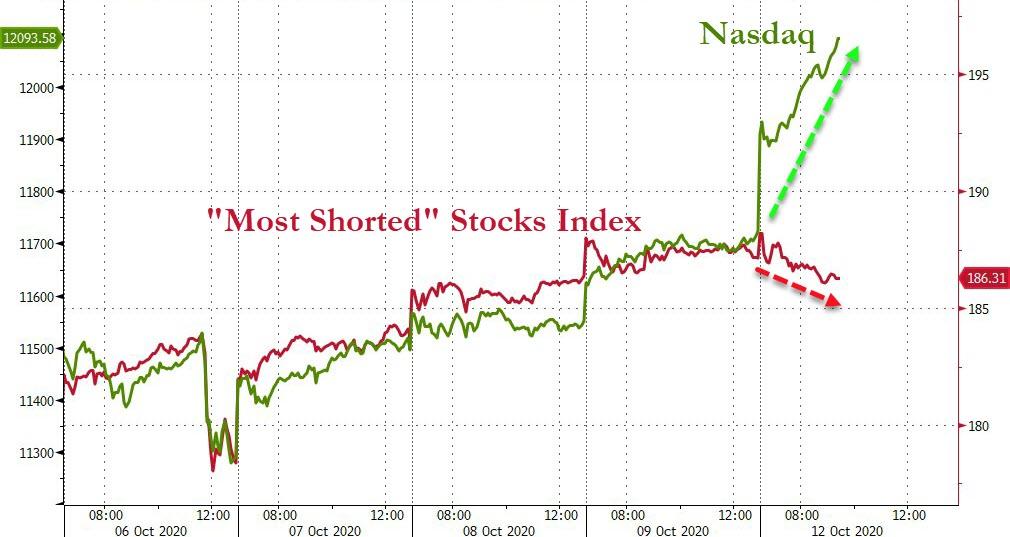
As such, the combination of a near-record NQ short and another dealer gamma short is precisely what has sparked today’s massive, 3% meltup in the Nasdaq, which paradoxically takes place even as most-shorted names are sliding.
Two more considerations are adding to the bear’s pain: first a modest unwind of the recent reflation trade which traders agreed had gone too far by Friday, means selling of small caps/Russell 2000 coupled with renewed buying of tech/Nasdaq names.
This unwind appears to have been further catalyzed by a fresh rebound in election uncertainty (contested election) as the Nov-Oct futs spread surges back to all time highs, sparking even more flows into the deflationary/tech space.
Finally, throw in Apple’s unveiling of the iPhone 12 tomorrow, which while probably will end up a dud provides even more squeeze power for the Softbanks of the world, and has left Nasdaq shorts dazed and confused after a week when it finally seemed that value may finally overtake growth as the preferred trade over the last few weeks of the year.
via ZeroHedge News https://ift.tt/3lDWOIK Tyler Durden
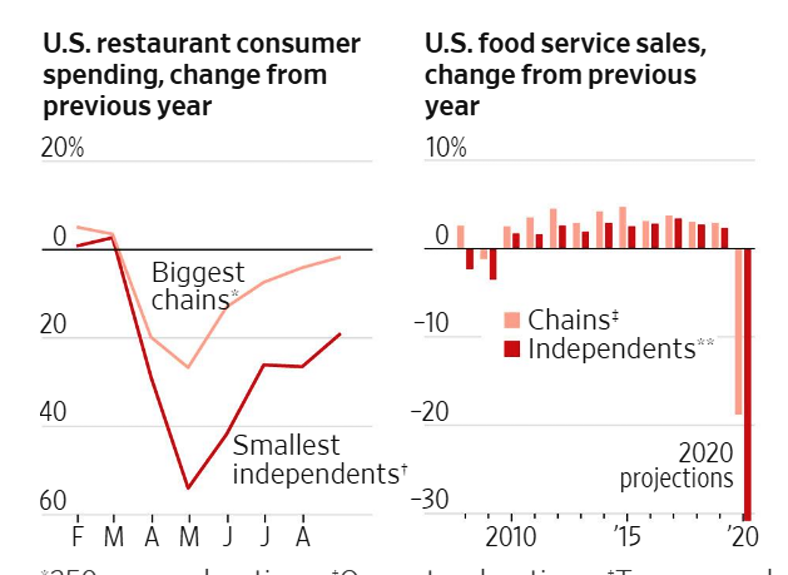
The coronavirus pandemic is splitting the restaurant industry in two. Big, well capitalized chains like Chipotle Mexican Grill Inc. and Domino’s Pizza Inc. are gaining customers and adding stores while tens of thousands of local eateries go bust.
Larger operators generally have the advantages of more capital, more leverage on lease terms, more physical space, more geographic flexibility and prior expertise with drive-throughs, carryout and delivery.
Brevan Howard Takes 25% Stake In Eric Peters’ One River Hedge Fund Tyler Durden
Mon, 10/12/2020 – 12:17
Eric Peters, perhaps better known to our readers as the “Hedge Fund CIO” of One River Asset Management, has long been one of our favorite market commentators dispensing with weekly insightful, actionable and often contrarian points of view which we dutifully distribute to our readership (his most recent thoughts were posted just this past weekend). After being “discovered” by Zero Hedge more than five years ago, he quickly made the media circuit and has frequently appeared on various podcasts and RealVision interviews:
It turns out that one of those reading his missives was none other than iconic macro hedge fund Brevan Howard which according to Bloomberg has acquired a 25% stake in Peters’ hedge fund, which manages $950 million at the Greenwich, Connecticut-based firm and whose clients have committed at least $500 million more to be invested in the next six months.
Of course, it’s not just his lofty prose that has set him aside from his peers: much more importantly, his stellar returns put him in the top percentile of hedge fund returns in 2020:
One River entered the year positioned for a dramatic turn in financial markets, and its Long Volatility Fund returned 50% during the first three weeks of March. That discretionary strategy has since pared gains and is now up 37%. The firm’s Dynamic Convexity Fund, which systematically bets on equity volatility, has returned 41%.
Entering 2020, Peters had long been a believer that central bank suppression of VIX would backfire spectacularly (read “Why Eric Peters Is Betting All On A Volatility Eruption: “A Historic Reversal Is Coming“”), and having had the tenacity to hold on to what until March was a losing position and refusing to follow the hedge fund herd, he ended up generating tremendous profits when the VIX soared to near record highs in March.
via ZeroHedge News https://ift.tt/2IhJTO1 Tyler Durden
Visualizing Every Company In And Out Of The Dow Jones Industrial Average Since 1928 Tyler Durden
Mon, 10/12/2020 – 11:55
The Dow Jones Industrial Average (DJIA) is reported on daily by every major finance and media platform – a testament to its importance and relevance in global financial markets.
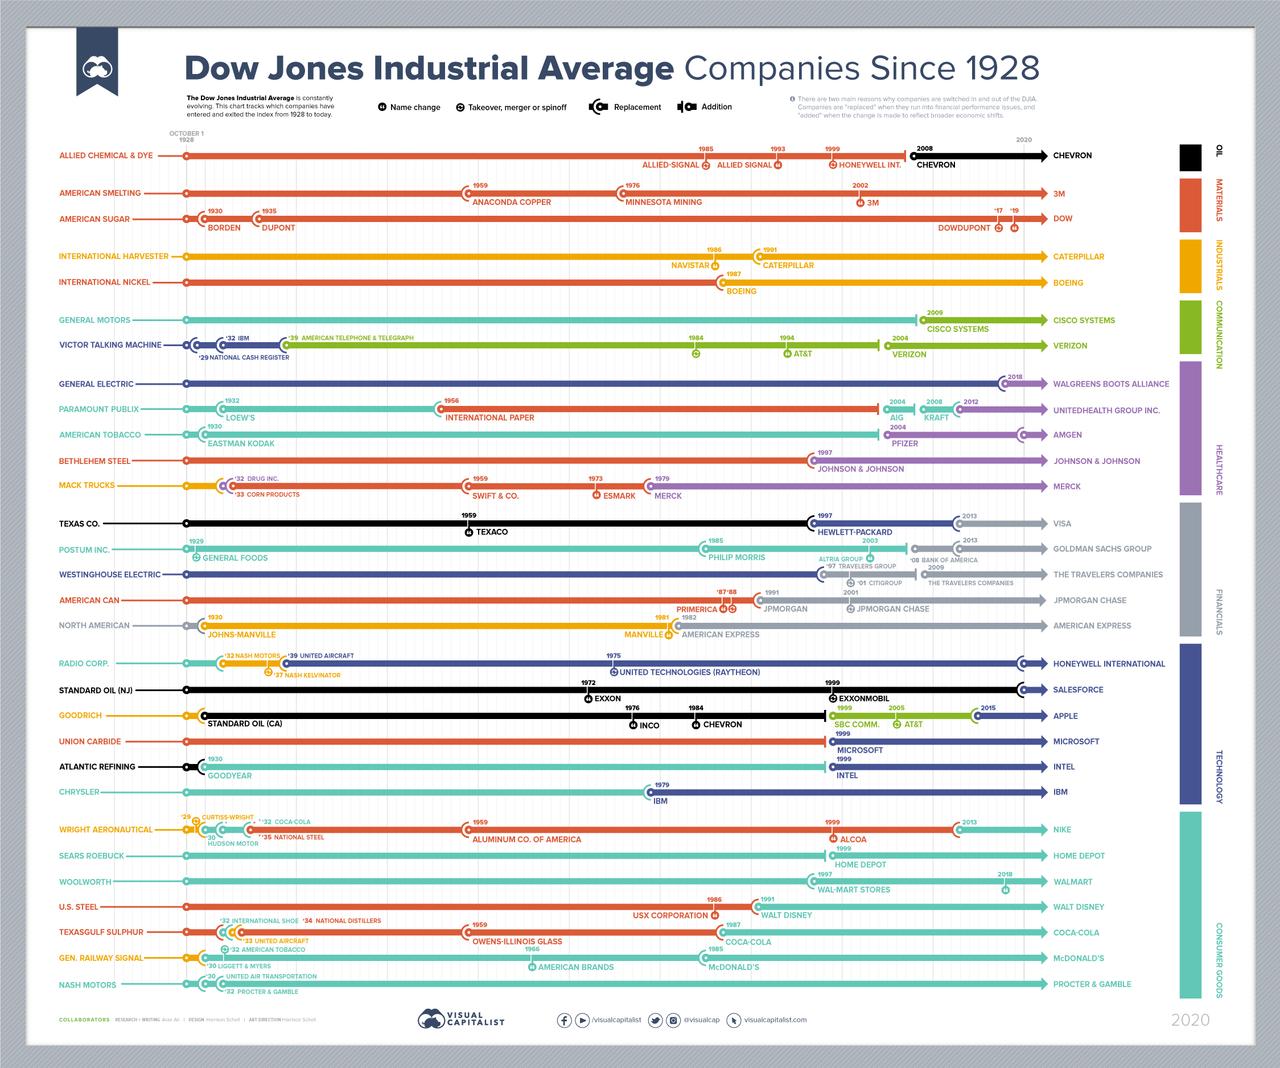
The market benchmark has a rich history embedded alongside America’s rise as a global superpower in the 20th century, and, as Visual Capitalis’s Aran Ali details below, the inflows and outflows of companies on the 30 stock index coincide with broader secular trends. For example, the delisting of many industrial stocks over time encapsulates America’s transition towards a service-based economy. Meanwhile, the addition of tech companies in the last few decades paints a similar picture of change.
Today’s infographic looks at Dow data spanning over nine decades, all the way back to the tail end of the Roaring Twenties.
Crank Up The Volatility
An increasingly competitive and accelerating business landscape results in greater churn for stock market indices.
In fact, in the 92 years of activity visualized for the DJIA, there were 93 changes in its composition. This is not surprising, as the average duration of a company’s tenure on American indices has been trending down for decades—that said, 63% of Dow changes occurred in the second half of the 92 year sample period.
The current iteration of the DJIA includes some long-serving constituents, with the average length of companies in the index sitting at 20 years. General Electric was the last standing member of the original group from 1928, but in 2018, they were replaced by Walgreens.
2020 has also brought with it some fresh faces, including three changes so far. They include Salesforce for ExxonMobil, Amgen for Pfizer, and Honeywell International for United Technologies. Here’s a full list of the current companies in the index:
Although all the stocks in the DJIA are intended to be in line with broader economic trends, the similarities end there. For some DJIA stocks, 2020 has brought growth and opportunity—for others, quite the opposite.
YTD stock price performances range vastly from a high of 55% to a low of -49%. Perhaps it serves as no surprise that the best performing companies serve in the tech space like Apple, Microsoft, and Salesforce, while the worst performing are the likes of Boeing and Chevron.
A Sign of the Times
The three changes in 2020 can best be described as modernizing the Dow.
The delistings include businesses in industries such as Aerospace & Defense and Big Pharma. But the most monumental exit? ExxonMobil, which was once the biggest company by market capitalization in America.
Their fall from grace best symbolizes the state and direction the world is headed towards.
via ZeroHedge News https://ift.tt/3jRTHwf Tyler Durden
Economists have come up with every variation of applying a letter of the alphabet to the economic recovery. Whether it’s an “L,” a “W” or a “V,” there is a letter that suits your view. But what is a “K”-shaped recovery?
Take a closer look at the letter “K.” It’s a “V” on the top, and an inverted “V” on the bottom.
According to Investopedia:
“A K-shaped recovery occurs when, following a recession, different parts of the economy recover at different rates, times, or magnitudes. This is in contrast to an even, uniform recovery across sectors, industries, or groups of people. A K-shaped recovery leads to changes in the structure of the economy or the broader society as economic outcomes and relations are fundamentally changed before and after the recession.
Creative Destruction
Following the economic shutdown, much of the data shows strong signs of improvement. However, several different economic phenomena are driving a K-shaped recovery.
One of the more interesting aspects of the recovery has been that of “creative destruction:”
“Creative destruction is a concept in economics which since the 1950s has become most readily identified with economist Joseph Schumpeter. Schumpeter derived it from the work of Karl Marx and popularized it as a theory of economic innovation and the business cycle.
According to Schumpeter, the ‘gale of creative destruction’ describes the ‘process of industrial mutation. The process continuously revolutionizes the economic structure from within, incessantly destroying the old one, incessantly creating a new one’” – Wikipedia
Industries like technology, retail, and software services are leading the way in “creative destruction.” Technology companies like Apple Inc., Alphabet Inc., and Microsoft Corp. saw earnings expand during the economic recession. General merchandise retailers such as Target, Walmart, and Costco, along with online video entertainment giants Netflix Inc., Walt Disney Co., and YouTube, made sizeable gains as the economy closed. Biotech, Pharmaceuticals, and, of course, “Work From Home” firms like Slack and Zoom blossomed with online retailers like Amazon and Shopify.
However, while the “fire of necessity” gave birth to a host of new companies, simultaneously others got lost. Travel, airlines, cruises, movie theaters, traditional retailers, and real estate remain under significant financial pressures.
The Other Side
In the bottom half of the “K” shaped recovery lies the majority of the economy. Its recovery is questionable the longer the pandemic goes on. The shift to “Work From Home” or “WFH,” along with the rise of the associated technologies, has companies questioning the need for expansive commercial offices.
WFH also requires less employment. In traditional office environments, assistants, associates, and others were previously relied on for more mundane tasks. However, in the WFH environment, those roles become less important as independent working rises.
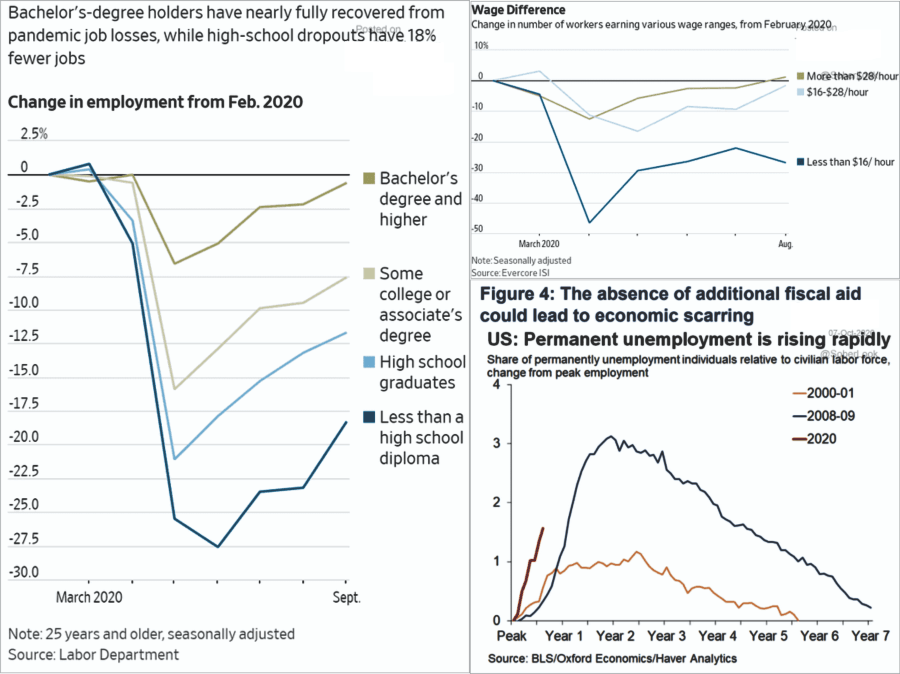
The need for “less” during the employment recovery is very much part of the “K” shape. Yes, certainly those with skill sets are finding jobs versus those without. Importantly, employers are also finding out they can hire higher qualified talent for less money. For example, I spoke to a restaurant owner who has been hiring as the economy reopened in Texas. His experience has been an overwhelming number of applications for waitstaff, bartenders, and hosts by individuals with bachelor degrees or better.
It isn’t there aren’t jobs for those with a high-school diploma or less, individuals are just taking those jobs with greater education levels.
The process of “creative destruction” is in action, and there are plenty of statistics currently suggesting such is the case.
Not A Broad Recovery
Just recently, Michael Snyder released a list of startling economic facts.
All 546 Regal Cinema theaters in the United States are shutting down, and there is no timetable for reopening them.
AMC Entertainment (the largest movie theater chain in the U.S.) reported they would “run out of liquidity” in 6 months.
The average rent on a one-bedroom apartment in San Francisco is 20.3 percent lower than it was one year ago.
JCPenney says that it will be cutting approximately 15,000 jobs as we approach the holiday shopping season.
On Thursday, we learned that another 787,000 Americans filed new claims for unemployment benefits during the previous week.
Overall, more than 60 million Americans have filed new claims for unemployment benefits so far in 2020. That number is far higher than anything we have ever seen before in all of U.S. history.
Bankruptcy filings in New York City have risen 40 percent so far in 2020.
This number is hard to believe, but almost 90 percent of New York City bar and restaurant owners couldn’t pay their full rent for August.
However, if you look at the stock market as an indicator of economic recovery, it certainly seems these are isolated cases.
Unfortunately, such isn’t the case.
A “V” For The Top 10%
As noted by the WSJ previously:
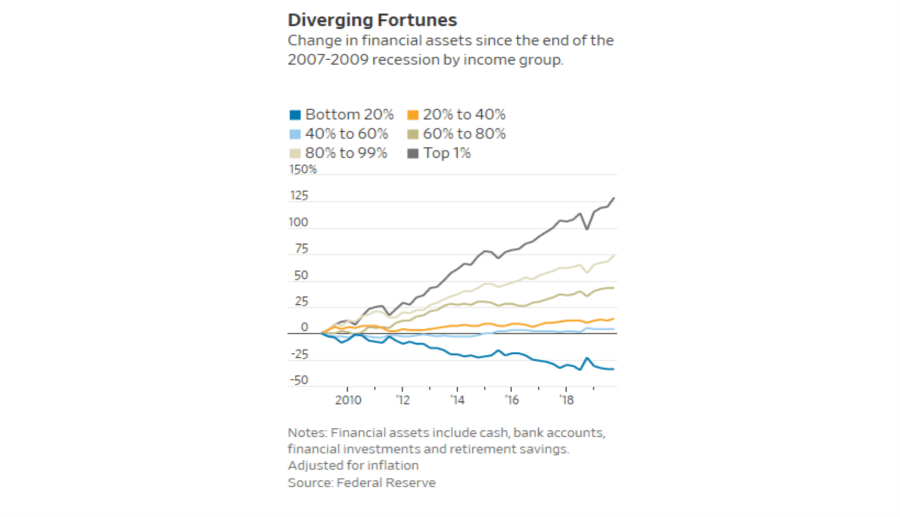
“As of December 2019—before the shutdowns—households in the bottom 20% of incomes had seen their financial assets, such as money in the bank, stock and bond investments or retirement funds, fall by 34% since the end of the 2007-09 recession, according to Fed data adjusted for inflation. Those in the middle of the income distribution have seen just 4% growth.” – WSJ
Indeed, one of the simplest ways to envision the current “K” shaped recovery is by looking at the surge of the stock market since late March. However, as we have noted previously, the “stock market” is no longer representative of the underlying economy. Such is due to massive interventions by the Federal Reserve, which pushed speculation in “risk” assets to historic levels
Even though the revenues generated by corporations come from economic activity, the Fed has fostered a “debt-driven” explosion of speculative investment activity. Despite the economy plunging in Q2 by most since the “Great Depression,” unemployment surging, and nearly 50% of small businesses nationwide failing, the stock market soared to new highs. Such is a clear example of how Central Bankers distorted the economic relationship.
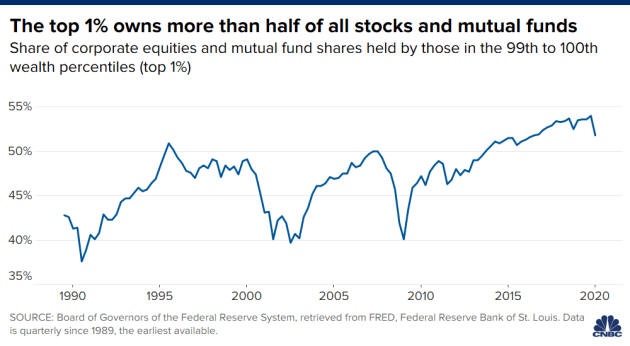
It also exacerbated financial inequality when the top 1% of earners owns 52% of the stocks and mutual funds.
As I showed last week, the differential in ownership in financial assets between the top 10% of the economy, which owns fully 88% of the stock market, and everyone else isn’t even close.
While the “rich get richer,” the poor continue to suffer. Unfortunately, the fiscal stimulus will only worsen the divide.
Expecting A Different Outcome
In the current recovery, it is clear that those at the top of the “K” are indeed experiencing a “V”-shaped recovery. For the rest, not so much.
Unfortunately, policy-makers, along with the Federal Reserve, are stuck. Since politicians want to get re-elected, sending money to households is a way to “buy the vote.”The average American doesn’t understand their demands on the Government for more support is leading to their economic inequality.
Conversely, the Federal Reserve serves at the mercy of the major Wall Street banks, so their policy focuses on inflating assets prices for the 10%, hoping it might one-day trickle down to the bottom 90%. After a decade, it hasn’t happened.
What we are confident of is that these “new policies” are very much the same as the “old policies.”As such, they will continue to foster economic inequality, inflated assets, and a further widening of the “wealth gap.”
These policies will ultimately result in further social instability and populism. History is replete with examples of the “endgame” of socialistic experiments of running unbridled debts and deficits.
Maybe we should try something different, and allow recessions to reset economic imbalances. Yes, it will be painful in the short-term, but the long-term benefits of expanded economic prosperity might be worth it.
One thing is for sure, “repeating the same failed actions and expecting a different outcome” has never been a solution for success.
We are reasonably confident it won’t work this time either.
via ZeroHedge News https://ift.tt/3iPjvrl Tyler Durden
Is Joe Biden About To Send Silver Soaring Tyler Durden
Mon, 10/12/2020 – 11:15
One of the key market dynamics over the past few months has seen traders seeking to best position their portfolios for the outcome of the presidential election, where we have seen a tug of war between tech stocks (a bet on continued deflationary forces and lower yields) on one hand, and small cap/value names which have seen some modest outperformance in recent days as a Biden victory has become synonymous with reflation (with Goldman speculating that as much as $7 trillion in new fiscal stimulus may be unleashed).
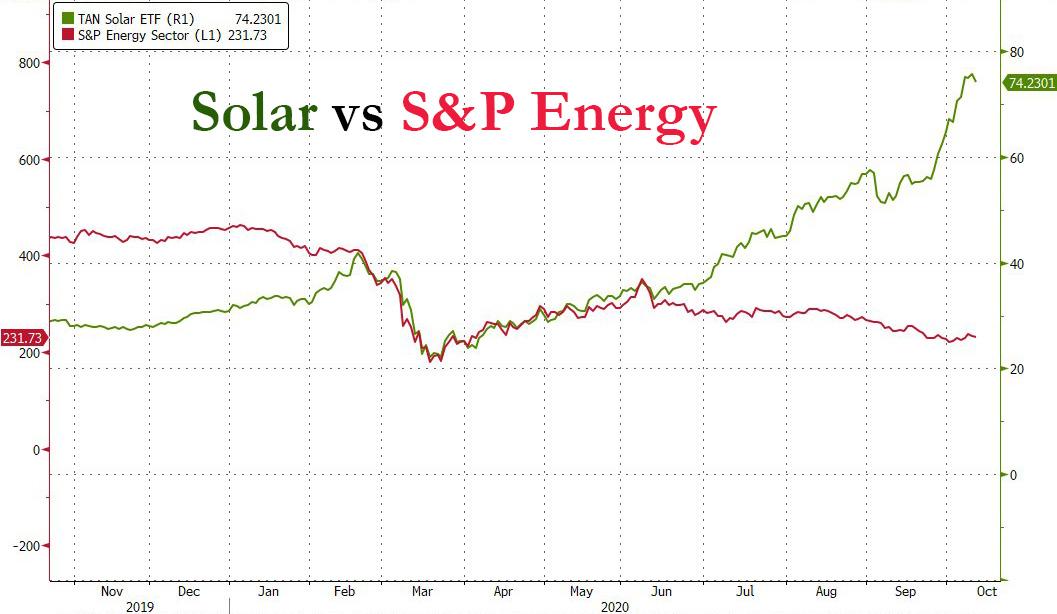
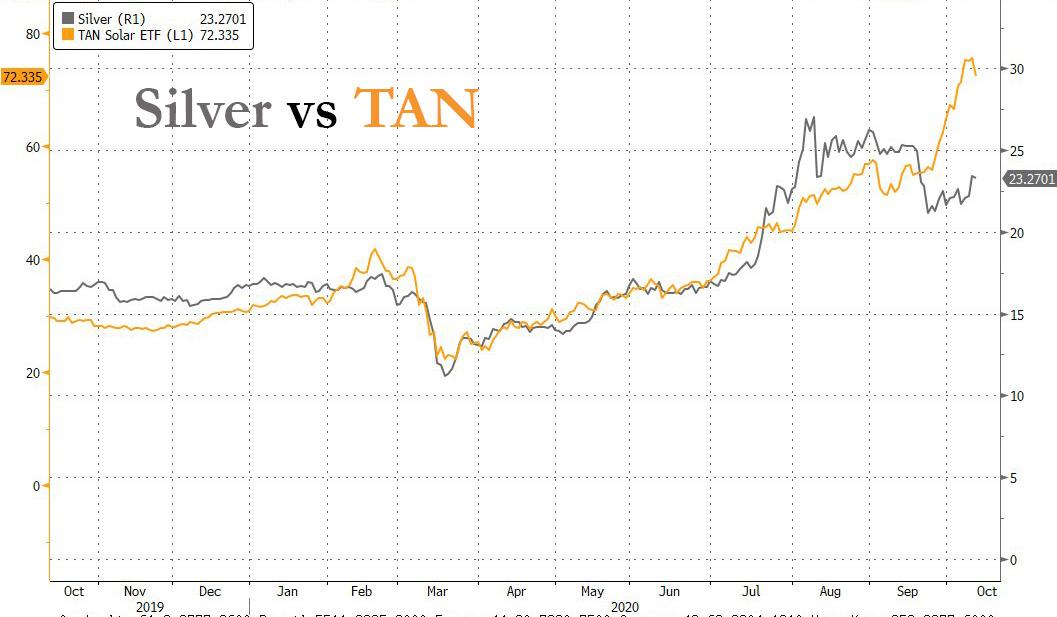
But while the broader “reflation vs deflation” trade has been widely discussed here, and elsewhere, one more targeted trade that has seen less coverage in the media has been the divergence between the legacy energy sector, represented by the S&P Energy Sector and most easily observed by the continued slide in such energy titans as Exxon and Chevron, and clean energy. The thesis is simple: a Biden administration will seek to punish “dirty” energy names while encouraging “green”, or solar, energy development. And a quick look at the recent underperformance in “legacy energy” vs the TAN solar ETF shows just how divergent positioning in this trade has been since early June.
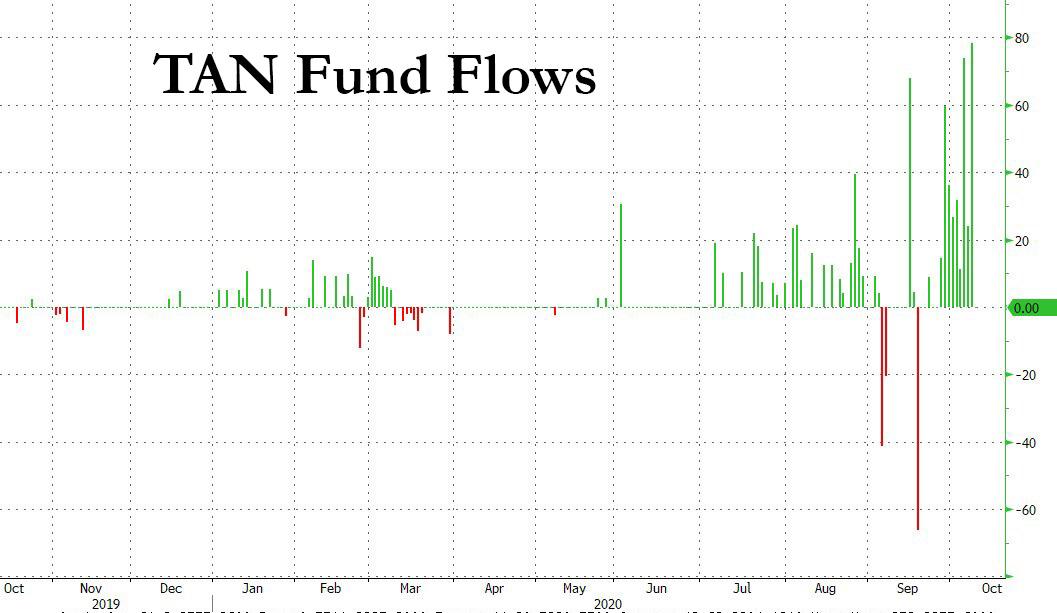
What is particularly notable about this divergence is that it again appears to be a function of Robinhood exuberance. As Bloomberg’s ETF guru Eric Balchunas writes, TAN has become “the Robinhood crowd’s new plaything as evidenced by the shattering of its weekly volume w/ $1b (top 2% among all ETFs).”
$TAN is Robinhood crowd’s new plaything as evidenced by the shattering of its weekly volume w/ $1b (top 2% among all ETFs). Record inflows too, aum now over $2b. $ICLN is sidekick seeing outsized interest as well esp w options. h/t @SarahPonczekpic.twitter.com/jDmS7Al5Nd
It’s not just record volumes, but record inflows too, with the ETF’s AUM now over $2BN following several weeks of nonstop inflows.
As Balchunas further notes, while Tan is up over 230% since March – making it one of the best performing ETFs of 2020 – “and is now getting extra kick from potential Blue Wave=green energy spend hopes”, it is still down 67% since inception. So lots more upside here.
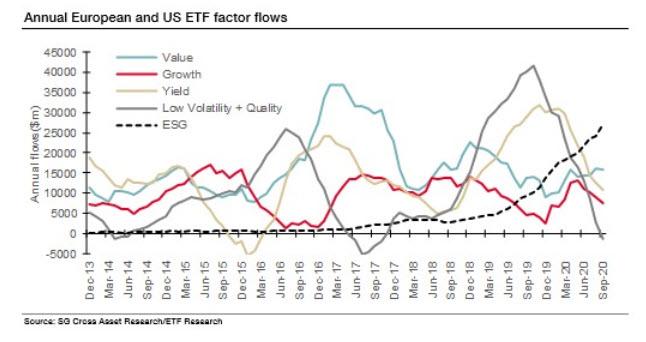
Of course, since solar stocks are in the “virtuous” category, these inflows will also count toward ESG assets, which as SocGen’s Andrew Lapthorne recently showed, have become the dominant factor for capital inflows. As Lapthorne recently wrote on the SocGen blog, “the trend is clear and whilst flows into equity factors (aka Smart Beta) product has remained fairly stable over the last 12 months (though low volatility/quality is a notable exception), ESG flows continue to rise month-on-month.” Whether it is due to bets on a “green” Biden admin or some other reason, but the ESG ETF category is now 50% of the AUM of the Value, Growth and Yield categories but, as Lapthorne notes, it has been around for far less time “and over the last year the flow into ESG ETFs has almost matched all the flow into the equity-factor based products.”
But back to TAN, which having emerged as the clearest beneficiary of the recent retail “green stock” euphoria, may also lead to the unintended consequence of sending silver surging in coming weeks.
As Goldman’s Mikhail Sprogis explains, “with global infrastructure stimulus tilting towards renewables, and solar in particular, silver stands out in the metals space as the obvious beneficiary. Solar investment accounts for around 18% of silver industrial demand, or 10% of silver total demand.” As a reminder, previously Goldman we argued that bullish exposure to solar is an important component in the bank’s $30/oz target (in addition to sharply higher gold prices on currency debasement).
Below we present some more thoughts from Goldman why the continued green frenzy could soon send silver sharply higher:
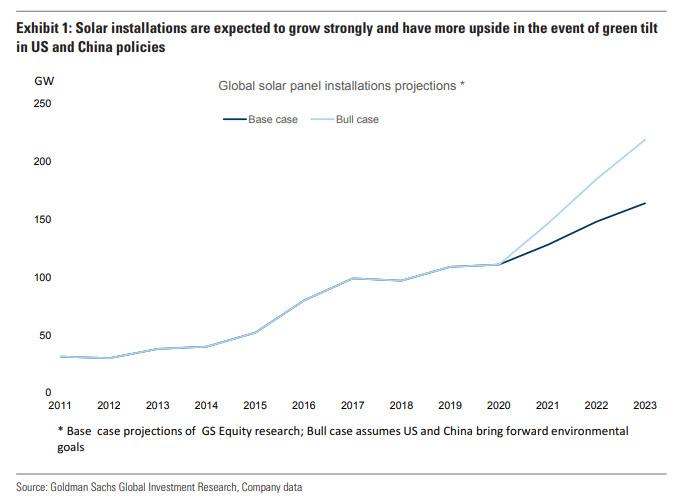
Our Equity analysts’ base case is that global solar installations will increase by 50% between 2019 and 2023 as the greenification trend accelerates. Importantly, there are potential upsides even to this ambitious target. Former US Vice President Biden has proposed a plan which involves installing 500 million solar panels in the US alone over the next 5 years. Our Equity analysts estimate that this could boost installation of US capacity from 15 GW per year to 30 GW. This represents a boost of almost 15% to global solar installations. Importantly, our Chinese clean energy team see potential upside to Chinese solar panel installations in the new 5-year plan. In their view, Chinese installation could reach 93 GW per year vs the current figure of 50 GW. This would represent a 40% boost to global installations.
The expected surge in solar installations per Goldman’s two cases – base and bull – is shown below:
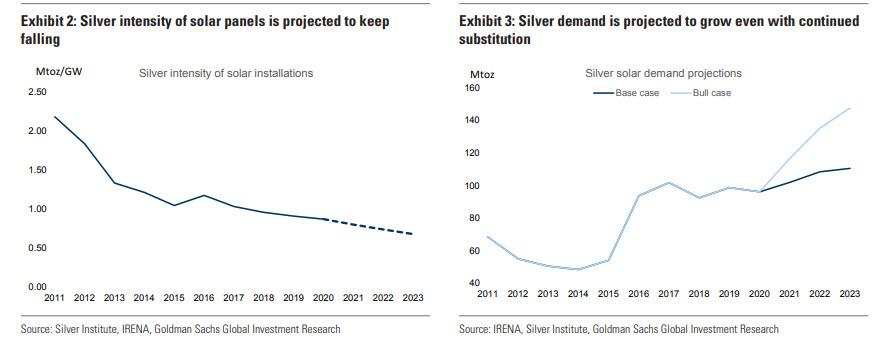
Of course, this aggressive expansion in solar facilities would mean far more demand for silver, and sure enough Goldman calculates that “silver demand should see decent growth” over the next 3 years, “although this could be significantly boosted should the Chinese and Biden-driven renewable acceleration happen. All in all, Goldman concludes that over the next 3 years solar should boost silver total industrial demand by 2% in the base case and by 9% in a bull case.
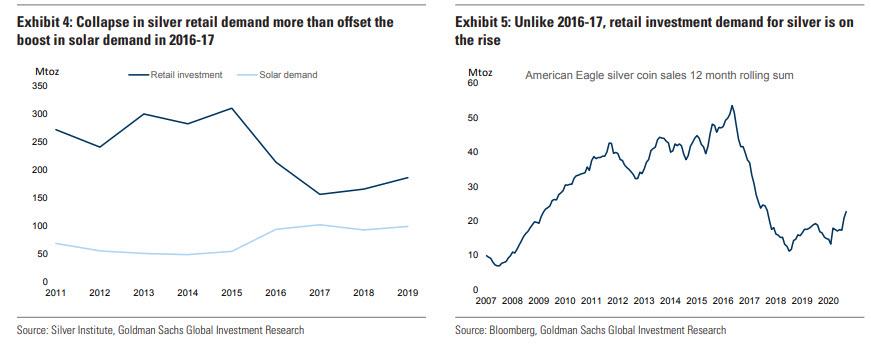
This won’t be the first time that silver solar demand has been a key price catalyst: it also happened in 2016-2017 but back then it led to only a brief period of silver outperformance vs gold, with Goldman explaining that the key reason for this was that the boost in industrial demand occurred simultaneously with a material decline in retail investment demand as the global economy entered the recovery stage, incentivizing a large rotation out of precious metals, and as such “the collapse in US retail demand was a key driver of the weakness.” However, this time around retail demand is actually increasing from a depressed level as the cyclical/inflationary risks facing the global economy are incentivizing more investment into precious metals, and silver in particular.
Furthermore, Goldman has calculated that while historically fluctuations in investment demand are the most important driver of silver prices, industrial demand matters too (silver’s beta to gold is around 1.55, while its beta to industrial demand is 1.07.) This means that if solar is successful in boosting industrial demand by 9%, this should lead to a 10% increase in silver prices, all else equal. And while this may seem small compared with the demand price relationship for base metals, Goldman’s analysts think it is reasonable given that a) silver industrial demand is only half of total demand; and b) jewelry, silverware and scrap are quite price-responsive and can be pushed out by higher industrial use. Also, a material tightness-driven rally, akin to 2011, should be prevented for now by the still very high level of on-ground stocks.
What does this mean for silver prices?
Well, according to the bank, in the event that both the Biden- and China policy-driven solar acceleration do materialize, Goldman’s model points to a 9.3% boost to its silver target. In addition, “solar is top of mind for most silver investors and, as such, any news flows that could be positive for silver, such as a Biden victory, could generate a rotation into the metal.”
Bottom line: Goldman once again goes long silver, expecting the precious metal to hit $30 in the coming months.
Earlier this year we initiated a long silver trade recommendation, and then closed out of after silver prices rallied by 50%, briefly touching our $30/toz target. Now, with silver at $24/toz and a few potential upward solar surprises in the coming months, we reopen the trade.
Goldman’s target may be conservative: one look at a chart of TAN vs Silver shows that if and when TAN’s momentum migrates to silver, $30/oz may be just the start.
via ZeroHedge News https://ift.tt/2SP9oIO Tyler Durden