Submitted by Mark Orlsey of PrismFP
After declaring duration was a snooze fest on Wednesday, we now get some action in outright duration (will spare you of more steepener talk). The oft cited micro reasons for the selloff has been 1) corporate deals and 2) bad month end longs. From a very big picture macro level, the selloff got kicked off by the growing belief that the global data is starting to bottom. These type of charts are starting to get widely circulated…

It’s a bit early to proclaim a bottom IMHO, but that is the building narrative in the market. China easing measures + FOMC “let it run hot” mentality will reverse the weak data trend. Thus Bunds, Gilts, and UST 10yrs are all seeing breakdowns (in price terms). But let’s look at some of the real macro reasons why rates are starting to breakout higher on a country specific level…
US 10yrs:
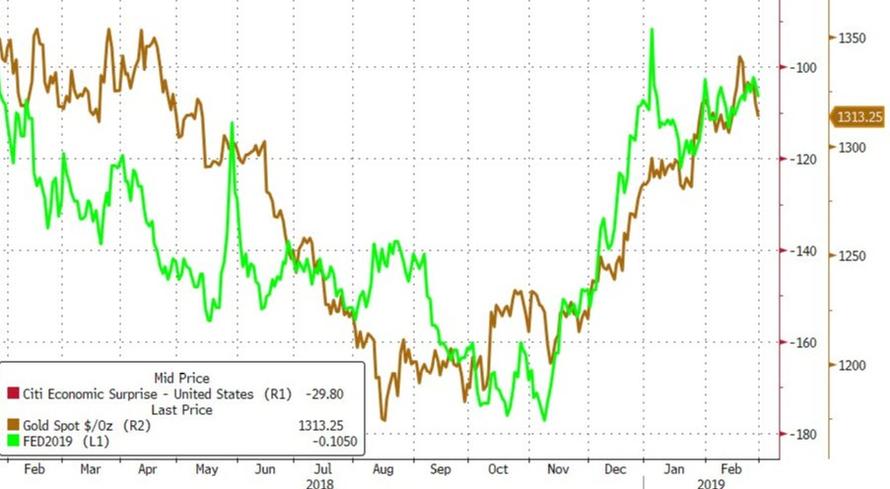
Checking the fancy PCA model Prism has built, we know that two of the primary drivers of yields are 1) oil and 2) breakevens (we can ignore $yen because we know rates drive $yen). We also all know breakevens are driven by oil, so oil is really THE primary catalyst for yields.
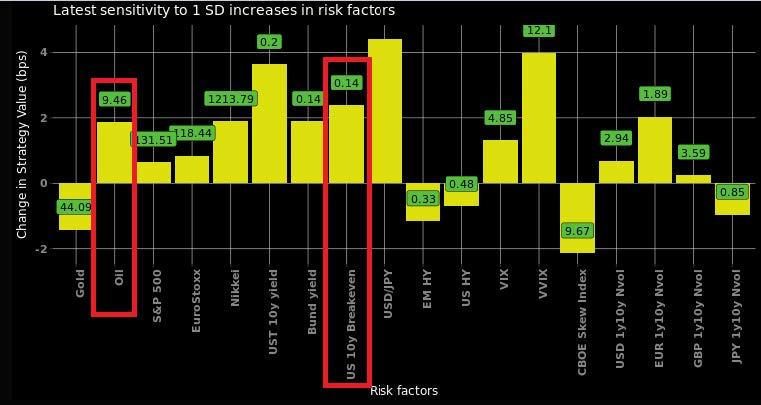
And as we can see from the below chart, in Q4 oil led breakevens lower which led yields lower. Now oil is bouncing and that is the major reason why rates are finally moving higher, not anything economic or Fed led.
US 10yr rates breaking out higher but still lag oil (purple) and breakevens (green)…
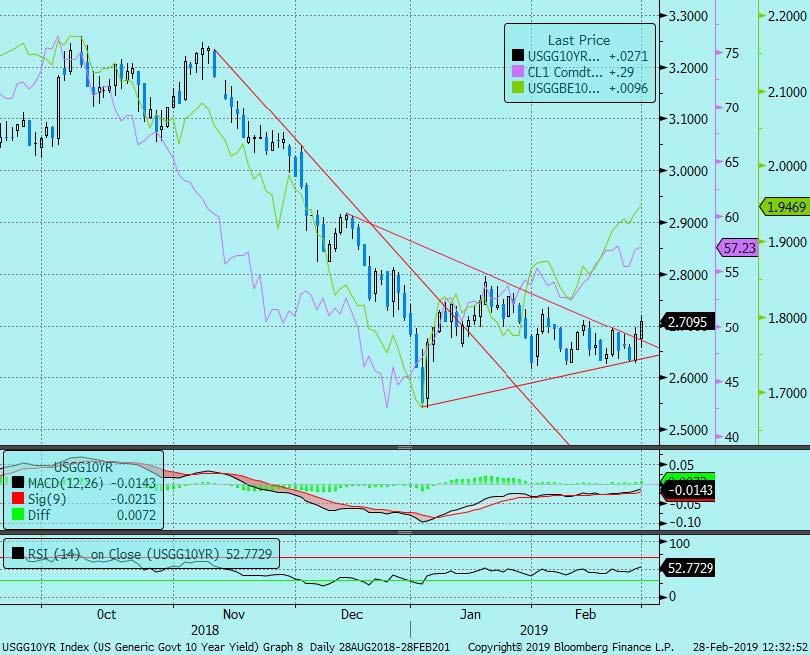
It is also notable that breakevens are actually HIGHER than oil. That makes complete sense based on everything we discussed in Wednesday’s note. Namely that the Fed is talking about letting inflation run above target so of course there is an additional firming of inflation expectations outside of energy.
If energy is leading US 10yr rates higher, you need to have an oil view. I would flag a bullish setup due to:
- Growing expectations of an extension of the successful OPEC supply cut in 2H
- A few Supertankers heading (possibly already here?) to the US to alleviate the glut (recall China loves the US light sweet crude product)
- Big Cushing draw this week
- Gas also breaking out so you are getting a coordinated bullish message in the energy complex
- US/China trade war deal potential
- Very positive seasonal period
- Strong technical setup
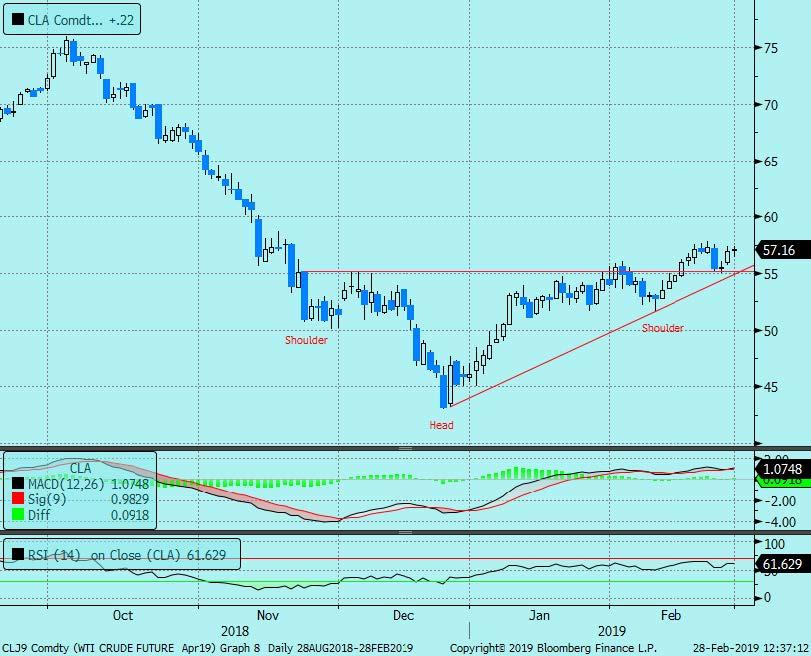
February, March, and April are the seasonal sweet spots for WTI…

WTI crude formed and broke the neckline of a bullish inverse head and shoulder pattern. It then retested that neckline which held which validates the bullish setup. Target is $67…
So given that 10yrs are still lagging the move in oil and breakevens, plus the bullish view that oil can go even higher would suggest you should look at long end downside (to fit the overall steepener view). I did a simple screen in Prism’s analytical model for the best structure in the 10yr space using the following as my guide:
- Delta of at least -10 and no more than -40
- Have downside limited to premium paid (so no 1×2’s etc.)
- Selecting what has the best leverage ratio for the “relative strike” (so same distance OTM and time to expiry throughout history)
- TYM9 121/119/118 1x3x2 put fly for ’17 (-15 delta)
This has a nice 6.5 to 1 max payout potential and covers the possible trade war resolution.
Bunds:
The selloff feels very much EU/UK led so what’s been going on in Bunds? First and foremost, positioning has gotten very skewed towards the idea that the ECB is on perma hold. Certainly all the recent data and ECB speak would point folks that way but that makes it susceptible to any sort of positive news.
Now those longs are getting tested with the growing talk of a new TLTRO announcement (along with the oil and global data bottoming theories) which is helping European yields shift higher. The idea is that TLTRO’s loosens credit which allows banks to lend which will be a tailwind for the EZ economy that desperately needs a tailwind.
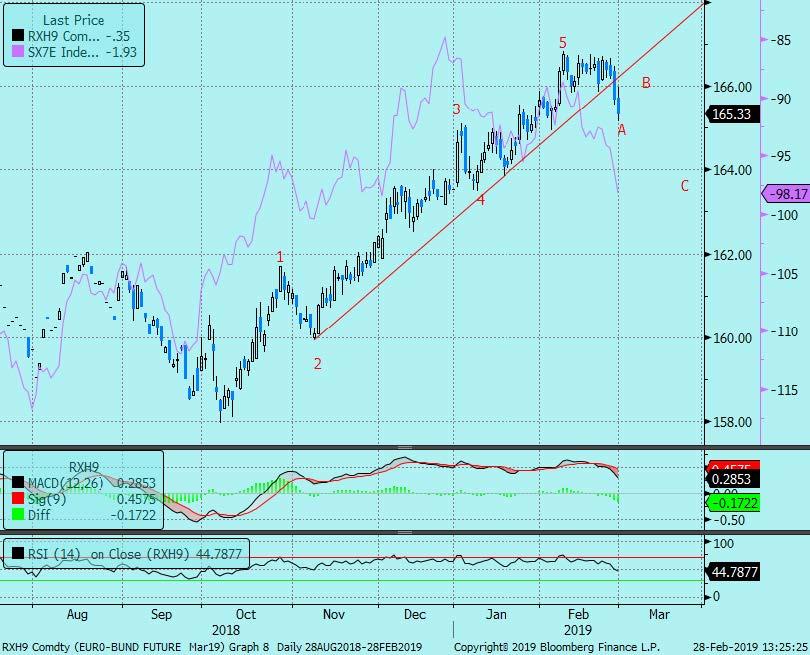
Most importantly, it is helping the floundering European banks. Thus Bunds are breaking down into an ABC correction and are starting to follow the EU bank index (inverted in purple) lower…
So for bunds, it is the combo of: the narrative of global growth bottoming + higher oil + LTRO expectations. Going back to PAM to screen for the best Bund downside using the same parameters gets to a simple expression:
- RXJ9 161.5 Put for 0.22 (-23 delta)
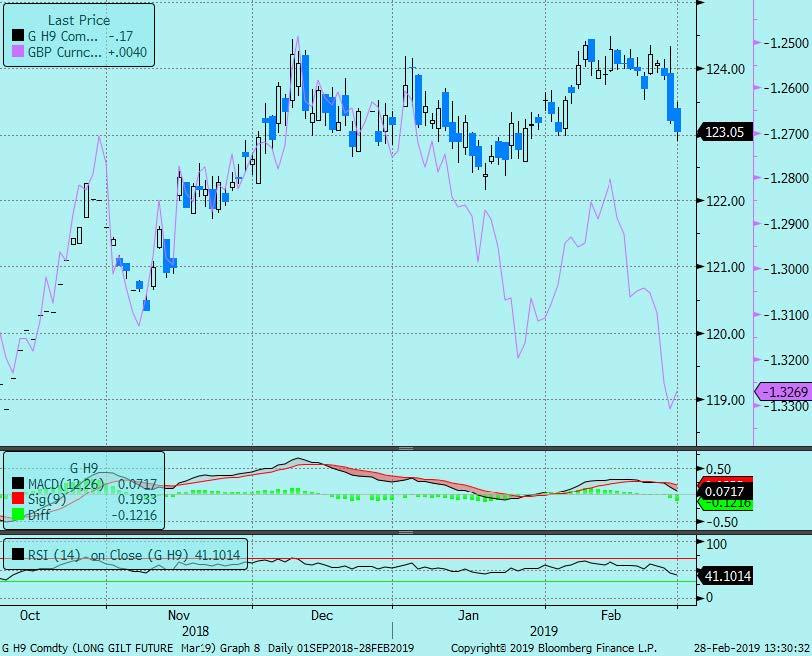
Gilts:
Gilts is a simple story of all of all the above mentioned reasons for TY and Bunds to move lower plus a more optimistic Brexit outlook. We therefore can see that Gilts are tracking GBP/USD (inverted in purple)…
So that’s the macro and micro explanations for the selloff. The complete list:
- Corporate deals
- Bad month end longs
- Growing belief that the global data is starting to bottom (mostly because of China stimulus)
- Oil and gas break out + the bullish setup for a move even higher
- Breakevens surging on the back of oil + Fed “let it run hot” rhetoric
- Expectations for a new round of TLTRO in the EZ
- Improved Brexit outlook
Therefore, it has become a perfect storm across the G3 for higher yields at a time when the market is still positioned for pessimism. The next question becomes: how deep can this fixed income correction become? Because we know what happens to risk assets if yields go too high….
Recall my view that this will be a long end phenomenon as central banks have pegged the front end. Thus my conviction in the steepener and why you should focus your downside on the long end not the front end.
If you believe my steepener narrative but are concerned about a deeper selloff, you can do a conditional bear steepener which looks much more attractive compared to bull steepeners as bull steepeners have been “picked over.” Let’s check our model one more time for the optimal expression:
- Sell OEM9P 97.375 Put vs. buying the 4EM9P 97.25 Put for flat
These puts are both out of the money by the same amount. Last year this would have been a tough trade given the Fed hiking stance led to a bear flattening. However, in this new regime with the Fed neutral (likely done hiking IMO) and talking a new inflation approach that would allow above target inflation; the days of reds leading the selloff are likely over.
If you compare 2019 to a recent prior year, it would be 2016 when the Fed was essentially on hold all year. You can see from the below regression that in hiking years like 2017 and 2018, the Eurodollar curve would bear flatten. In 2016, when the Fed was neutral, the ED curve bear steepened!
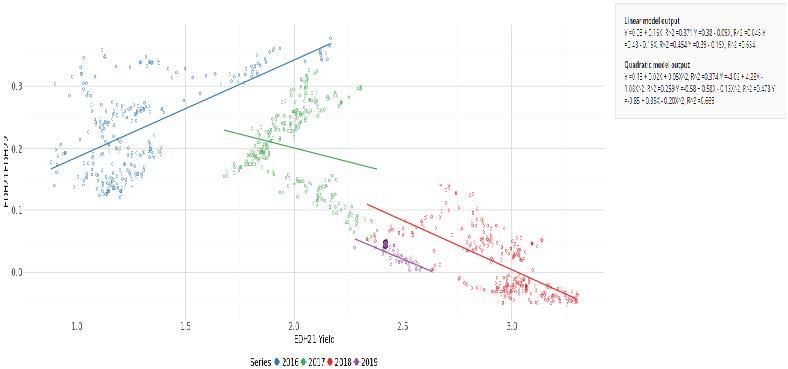
Therefore, fund a cheap “Gold” put by selling an expensive “Red” put. In the new regime, you will like the extra duration of Golds.
via ZeroHedge News https://ift.tt/2TlPaYN Tyler Durden