The social psychologist and New York University professor Jonathan Haidt wants journalists to stop being wishy-washy about the teen girl mental health crisis.
“There is now a great deal of evidence that social media is a substantial cause, not just a tiny correlate, of depression and anxiety, and therefore of behaviors related to depression and anxiety, including self-harm and suicide,” Haidt wrote recently in his Substack, After Babel, where he’s publishing essays on the topic that will also come out in the form of a book in 2024 tentatively titled, Kids In Space: Why Teen Mental Health is Collapsing.
In recent weeks, Haidt’s work has been the subject of significant online discussion, with articles by David Leonhardt, Michelle Goldberg, Noah Smith, Richard Hanania, Eric Levitz, and Matthew Yglesias that mostly endorse his thesis.
In a recent post, Haidt took journalists, such as The Atlantic‘s Derek Thompson, to task for continuing to maintain that “the academic literature on social media’s harms is complicated” when, in fact, the evidence is overwhelming.
I admire Haidt’s skill and integrity as a writer and researcher. He qualifies his view and describes complexities in the areas he studies. He acknowledges that teen depression has multiple causes. He doesn’t make unsupported claims, and you’ll never find bland assertions that “studies prove” in his work, which is regrettably common in mainstream accounts.
And he’s a model of transparency. Haidt posted a Google Doc in February 2019 listing 301 studies (to date) from which he has derived his conclusions, he began inviting “comments from critics and the broader research community.”
I don’t know Haidt personally and didn’t receive an invitation to scrutinize his research four years ago. But more recently, I decided to do just that. I found that the evidence not only doesn’t support his claim about teen health and mental health, it undermines it.
Let me start by laying out where I’m coming from as a statistician and longtime skeptical investigator of published research. I’m much less trusting of academic studies and statistical claims than Haidt appears to be. I broadly agree with John Ioannidis of Stanford University’s landmark 2005 paper, “Why Most Published Research Findings Are False.”
Gathering a few hundred papers to sift through for insight is valuable but should be approached with the assumption that there is more slag than metal in the ore, that you have likely included some egregious fraud, and that most papers are fatally tainted by less-egregious practices like p-hacking, hypothesis shopping, or tossing out inconvenient observations. Simple, prudent consistency checks are essential before even looking at authors’ claims.
Taking a step back, there are strong reasons to distrust all observational studies looking for social associations. The literature has had many scandals—fabricated data, conscious or unconscious bias, and misrepresented findings. Even top researchers at elite institutions have been guilty of statistical malpractice. Peer review is worse than useless, better at enforcing conventional wisdom and discouraging skepticism than weeding out substandard or fraudulent work. Academic institutions nearly always close ranks to block investigation rather than help ferret out misconduct. Random samples of papers find high proportions that fail to replicate.
It’s much easier to dump a handy observational database into a statistics package than to do serious research, and few academics have the skill and drive to produce high-quality publications at the rate required by university hiring and tenure review committees. Even the best researchers have to resort to pushing out lazy studies and repackaging the same research in multiple publications. Bad papers tend to be the most newsworthy and the most policy-relevant.
Academics face strong career pressures to publish flawed research. And publishing on topics in the news, such as social media and teen mental health, can generate jobs for researchers and their students, like designing depression-avoidance policies for social media companies, testifying in lawsuits, and selling social media therapy services. This causes worthless areas of research to grow with self-reinforcing peer reviews and meta-analyses, suck up grant funds, create jobs, help careers, and make profits for journals.
The 301 studies that make up Haidt’s informal meta-analysis are typical in this regard. He doesn’t seem to have read them with a sufficiently critical eye. Some have egregious errors. One study he cites, for example, clearly screwed up its data coding, which I’ll elaborate on below. Another study he relies on drew all of its relevant data from study subjects who checked “zero” for everything relevant in a survey. (Serious researchers know to exclude such data because these subjects almost certainly weren’t honestly reporting on their state of mind.)
Haidt is promoting his findings as if they’re akin to the relationship between smoking cigarettes and lung cancer or lead exposure and IQ deficits. None of the studies he cites draw anything close to such a direct connection.
What Haidt has done is analogous to what the financial industry did in the lead-up to the 2008 financial crisis, which was to take a bunch of mortgage assets of such bad quality that they were unrateable and package them up into something that Standard & Poor’s and Moody’s Investors Service were willing to give AAA ratings but that was actually capable of blowing up Wall Street. A bad study is like a bad mortgage loan. Packaging them up on the assumption that somehow their defects will cancel each other out is based on flawed logic, and it’s a recipe for drawing fantastically wrong conclusions.
Haidt’s compendium of research does point to one important finding: Because these studies have failed to produce a single strong effect, social media likely isn’t a major cause of teen depression. A strong result might explain at least 10 percent or 20 percent of the variation in depression rates by difference in social media use, but the cited studies typically claim to explain 1 percent or 2 percent or less. These levels of correlations can always be found even among totally unrelated variables in observational social science studies. Moreover the studies do not find the same or similar correlations, their conclusions are all over the map.
The findings cited by Haidt come from studies that are clearly engineered to find a correlation, which is typical in social science. Academics need publications, so they’ll generally report anything they find even if the honest takeaway would be that there’s no strong relation whatsoever.
The only strong pattern to emerge in this body of research is that, more often than you would expect by random chance, people who report zero signs of depression also report that they use zero or very little social media. As I’ll explain below, drawing meaningful conclusions from these results is a statistical fallacy.
Haidt breaks his evidence down into three categories. The first is associational studies of social media use and depression. By Haidt’s count, 58 of these studies support an association and 12 don’t. To his credit, he doesn’t use a “majority rules” argument; he goes through the studies to show the case for association is stronger than the case against it.
To give a sense of how useless some of these studies are, let’s just take the first on his list that was a direct test of the association of social media use and depression, “Association between Social Media Use and Depression among U.S. Young Adults.” (The studies listed earlier either used other variables—such as total screen time or anxiety—or studied paths rather than associations.)
The authors emailed surveys to a random sample of U.S. young adults and asked about time spent on social media and how often they had felt helpless, hopeless, worthless, or depressed in the last seven days. (They asked other questions too, worked on the data, and did other analyses. I’m simplifying for the sake of focusing on the logic and to show the fundamental problem with its methodology.)
The key data are in a table that cross-tabulates time spent on social media with answers to the depression questions. Those classified with “low” depression were the people who reported “never” feeling helpless, hopeless, worthless, or depressed. A mark of “high” depression required reporting at least one “sometimes.” Those classified with “medium” depression reported they felt at least one of the four “rarely” but didn’t qualify as “high” depression.
Social media time of Q1 refers to 30 minutes or less daily on average; Q2 refers to 30–60 minutes; Q3 is 60–120 minutes; and Q4 is more than 120 minutes.
My table below, derived from the data reported in the paper, is the percentage of people in each cross-tabulation, minus what would be expected by random chance if social media use were unrelated to depression.
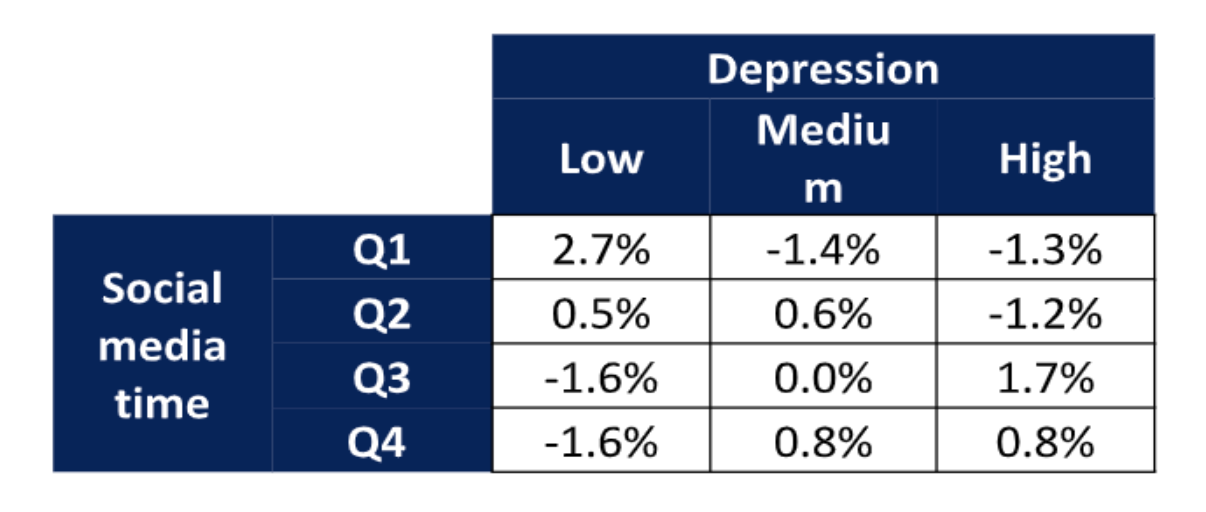
The paper found a significant association between social media time and depression scores using two different statistical tests (chi-square and logistic regression). It also used multiple definitions of social media use and controlled for things like age, income, and education.
But the driver of all these statistical tests is the 2.7 percent in the upper left of the table—more people than expected by chance reported never feeling any signs of depression and using social media for 30 minutes or less per day on average. All the other cells could easily be due to random variation; they show no association between social media use and depression scores.
A basic rule of any investigation is to study what you care about. We care about people with depression caused by social media use. Studying people who never feel any signs of depression and don’t use social media is obviously pointless. If the authors had found another 2.7 percent of their sample in the cell on the lower right (high social media time and at least sometimes feeling some sign of depression), then the study might have some relevance. But if you exclude non–social media users and people who have never felt any sign of depression from the sample, there’s no remaining evidence of association, neither in this table nor in any of the other analyses the authors performed.
The statistical fallacy that drives this paper is sometimes called “assuming a normal distribution,” but it’s more general than that. If you assume you know the shape of some distribution—normal or anything else—then studying one part can give you information about other parts. For example, if you assume adult human male height has some specific distribution, then measuring NBA players can help you estimate how many adult men are under 5 feet. But in the absence of a strong theoretical model, you’re better off studying short men instead.
This is sometimes illustrated by the raven paradox. Say you want to test whether all ravens are black, so you stay indoors and look at all the nonblack things you can see and confirm that they aren’t ravens.
This is obviously foolish, but it’s exactly what the paper did: It looked at non–social media users and found they reported never feeling signs of depression more often than expected by random chance. What we want to know is whether depressed people use more social media or if heavy social media users are more depressed. If that were the finding, we’d have something to investigate, which is the sort of clear, strong result that is missing in this entire literature. We’d still want statistical tests to measure the reliability of the effect, and we’d like to see it replicated independently in different populations using different methodologies, with controls for plausible confounding variables. But without any examples of depressed heavy social media users, statistical analyses and replications are useless window dressing.
The authors’ methodology can be appropriate in some contexts. For example, suppose we were studying blood lead levels and SAT scores in high school seniors. If we found that students with the lowest lead levels had the highest SAT scores, that would provide some evidence that higher lead levels were associated with lower SAT scores, even if high levels of lead were not associated with low SAT scores.
The difference is that we think lead is a toxin, so each microgram in your blood hurts you. So a zero-lead 1450 SAT score observation is as useful as a high-lead 500 one. But social media use isn’t a toxin. Each tweet you read doesn’t kill two pleasure-receptor brain cells. (Probably not, anyway.) The effects are more complex. And never feeling any signs of depression—or never admitting any signs of depression—may not be healthier than occasionally feeling down. Non–social media users with zero depression signs are different in many ways from depressed heavy users of social media, and studying the former can’t tell you much about the latter.
The use of statistics in this kind of study can blind people to simple logic. Among the 1,787 people who responded to the authors’ email, there were likely some people who became depressed after extensive social media use without any other obvious causes like neglect, abuse, trauma, drugs, or alcohol. Rather than gathering a few bits of information about all 1,787 (most of whom are irrelevant to the study, either because they’re not depressed or aren’t heavy social media users), it makes sense to learn the full stories of the handful of relevant cases.
Statistical analyses require throwing away most of your data to focus on a few variables you can measure across subjects, which allows you to investigate much larger samples. But that tradeoff only makes sense if you know a lot about which variables are important and your expanded sample takes in relevant observations. In this case, statistics are used without a sense of what variables are relevant. So the researchers draw in mostly irrelevant observations. Statistics will be dominated by the 1,780 or so subjects you don’t care about and won’t reflect the seven or so you do.
The logic is not the only issue with this study. The quality of the data is extremely poor because it comes from self-reports by self-selected respondents.
All of the 2.7 percent who drove the conclusions checked “never” to all four depression questions. Perhaps they were cheerful optimists, but some of them were probably blowing off the survey as quickly as possible to get the promised $15, in which case the fact that most of them also checked zero social media time doesn’t tell us anything about the link between social media use and depression. Another group may have followed the prudent practice of never admitting anything that could be perceived as negative, even in a supposedly anonymous email survey. And in any event, we cannot make any broad conclusion based on 2.7 percent of people, despite whatever p-value the researchers compute.
The measures of social media usage are crude and likely inaccurate. Self-reports of time spent or visits don’t tell us about attention, emotional engagement, or thinking about social media when not using it. Checking that you “sometimes” rather than “rarely” feel helpless is only distantly related to how depressed you are. Different people will interpret the question differently and may well answer more based on momentary mood than careful review of feelings over the last seven days, parsing subtle differences between “helpless” and “hopeless.” Was that harlequin hopelessly helping or helplessly hoping? How long you have to think about that is a measure of how clearly your brain distinguishes the two concepts.
The responses to the depression questions have been linked to actual depression in some other studies, but the links are tenuous, especially in the abbreviated four-question format used for this study. You can use indirect measures if you have strong links. If the top 5 percent of social media users made up 50 percent of the people who reported sometimes feeling depressed, and if 90 percent of the people who reported sometimes feeling depressed—and no others—had serious depression issues, then we could infer the heavy social media users had more than eight times the risk of depression as everyone else.
But weaker correlations typical of these studies, and also of the links between depression questionnaires and serious clinical issues, can’t support any inference at all. If the top 5 percent of social media users made up 10 percent of the people who reported sometimes feeling depressed, and if 20 percent of the people who reported sometimes feeling depressed had serious clinical issues, it’s possible that all the heavy social media users are in the other 80 percent, and none of them have serious clinical issues.
This is just one of the 70 association studies Haidt cited, but almost all of them suffer from the issues tabulated above. Not all of these problems were in all of the studies, but none of the 68 had a clear, strong result demonstrating above-normal depression levels of heavy social media users based on reliable data and robust statistical methods. And the results that were reported were all over the map, which is what you would expect from people looking at random noise.
The best analogy here isn’t art critics all looking at the Mona Lisa and arguing about what her smile implies; it’s critics looking at Jackson Pollock’s random paint smears and arguing about whether they referenced Native American sandpainting or were a symptom of his alcoholism.
You can’t build a strong case on 66 studies of mostly poor quality. If you want to claim strong evidence for an association between heavy social media use and serious depression, you need to point to at least one strong study which can be analyzed carefully. If it has been replicated independently, so much the better.
The second set of studies Haidt relied on were longitudinal. Instead of looking at a sample at a single time period, the same people were surveyed multiple times. This is a major improvement over simple observational studies because you can see if social media use increases before depression symptoms emerge, which makes the causal case stronger.
Once again, I picked the first study on Haidt’s list that tested social media use and depression, which is titled “Association of Screen Time and Depression in Adolescence.” It used four annual questionnaires given in class to 3,826 Montreal students from grades seven to 10. This reduces the self-selection bias of the first study but also reduces privacy, as students may fear others can see their screens or that the school is recording their answers. Another issue is since the participants know each other, they are likely to discuss responses and modify future answers to conform with peers. On top of that, I’m doubtful of the value of self-reported abstractions by middle-school students.
A minor issue is the data were collected to evaluate a drug-and-alcohol prevention program, which might have impacted both behavior and depression symptoms.
If Haidt had read this study with the proper skepticism, he might have noticed a red flag right off the bat. The paper has some simple inconsistencies. For example, the time spent on social media was operationalized into four categories: zero to 30 minutes; 30 minutes to one hour and 30 minutes; one hour and 30 minutes to two hours and 30 minutes; and three hours and 30 minutes or more. You’ll notice that there is no category from 2.5 hours to 3.5 hours, which indicates sloppiness.
The results are also reported per hour of screen time, but you can’t use this categorization for that. That’s because someone moving from the first category to the second might have increased social media time by one second or by as much as 90 minutes.
These issues don’t discredit the findings. But in my long experience of trying to replicate studies like this one, I’ve found that people who can’t get the simple stuff right are much more likely to be wrong as the analysis gets more complex. The frequency of these sorts of errors in published research also shows how little review there is in peer review.
Depression was measured by asking students to what extent they felt each of seven different symptoms of depression (e.g., feeling lonely, sad, hopeless) from zero (not at all) to four (very much). The key finding of this study in support of Haidt’s case is that if a person increased time spent on social media by one hour per day between two annual surveys, he or she reported an average increase of 0.41 on one of the seven scales.
Unfortunately, this is not a longitudinal finding. It doesn’t tell us whether the social media increase came before or after the depression change. The proper way to analyze these data for causal effects is to compare one year’s change in social media usage with the next year’s change in depression symptoms. The authors don’t report this, which suggests to me that the results were not statistically significant. After all, the alleged point of the study was to get longitudinal findings.
Another problem is the small magnitude of the effect. Taken at face value, the result suggests that it takes a 2.5-hour increase in social media time per day to change the response on one of seven questions by one notch. But that’s the difference between a social media non-user and a heavy user. Making that transition within a year suggests some major life changes. If nothing else, something like 40 percent of the student’s free time has been reallocated to social media. Of course, that could be positive or negative, but given how many people answer zero (“not at all”) to all depression symptom questions, the positive effects may be missed when aggregating data. And the effect is very small for such a large life change, and nowhere near the level to be a plausible major cause of the increase in teenage girl depression. Not many people make 2.5-hour-per-day changes in one year, and a single-notch increase on the scale isn’t close to enough to account for the observed population increase in depression.
Finally, like the associational study above, the statistical results here are driven by low social media users and low depression scorers, when, of course, we care about the significant social media users and the people who have worrisome levels of depression symptoms.
I looked at several studies in Haidt’s category of longitudinal studies. Most looked at other variables. The study “Social networking and symptoms of depression and anxiety in early adolescence” did measure social media use and depression and found that higher social media use in one year was associated with higher depression symptoms one and two years in the future, although the magnitude was even smaller than in the previous study. And it wasn’t a longitudinal result because the authors did not measure changes in social media use in the same subjects. The fact that heavier social media use today is associated with more depression symptoms next year doesn’t tell us which came first, since heavier social media use today is also associated with more depression symptoms today.
Of the remaining 27 studies Haidt lists as longitudinal studies supporting his contention, three avoided the major errors of the two above. But those three relied on self-reports of social media usage and indirect measures of depression. All the results were driven by the lightest users and least depressed subjects, and all the results were too small to plausibly blame social media usage for a significant increase in teen female depression.
Against this, Haidt lists 17 studies he considers to be longitudinal that either find no effect or an effect in the opposite direction of his claim. Only four are true longitudinal studies relating social media use to depression. One, “The longitudinal association between social media use and depressive symptoms among adolescents and young adults,” contradicts Haidt’s claim. It finds depression occurs before social media use and not the other way around.
Three studies (“Social media and depression symptoms: A network perspective,” “Does time spent using social media impact mental health?,” and “Does Objectively Measured Social-Media or Smartphone Use Predict Depression, Anxiety, or Social Isolation Among Young Adults?“) find no statistically significant result either way.
Of course, absence of evidence is not evidence of absence. Possible explanations for a researcher’s failure to confirm social media use caused depression are that social media use doesn’t cause depression or that the researcher didn’t do a good job of looking for it. Perhaps there was insufficient or low-quality data, or perhaps the statistical techniques failed to find the association.
To evaluate the weight of these studies, you need to consider the reputations of the researchers. If no result can be found by a top person who has produced consistently reliable work finding nonobvious useful truths, it’s a meaningful blow against the hypothesis. But if a random person of no reputation fails, there’s little reason to change your views either way.
Looking over this work, it’s clear that there’s no robust causal link between social media use and depression anywhere near large enough to claim that it’s a major cause of the depression increase in teen girls, and I don’t understand how Haidt could have possibly concluded otherwise. There’s some evidence that the lightest social media users are more likely to report zero versus mild depression symptoms but no evidence that heavy social media users are more likely to progress from moderate to severe symptoms. And there are not enough strong studies to make even this claim solid.
Moving on to Haidt’s third category of experimental studies, the first one he lists is “No More FOMO: Limiting Social Media Decreases Loneliness and Depression.” It found that limiting social media time to 10 minutes per day among college students for three weeks caused clinically significant declines in depression. Before even looking at the study, we know that the claim is absurd.
You might feel better after three weeks of reduced social media usage, but it can’t have a major effect on the psychological health of functional individuals. The claim suggests strongly that the measure of clinical depression is a snapshot of mood or some other ephemeral quality. Yet the authors are not shy about writing in their abstract, “Our findings strongly suggest that limiting social media use to approximately 30 minutes per day may lead to significant improvement in well-being”—presumably limits from the government or universities.
This study is based on 143 undergraduates participating for psychology course credits. This type of data is as low quality as the random email surveys used in the first study cited. The subjects are generally familiar with the type of study and may know or guess its purposes—in some cases they may have even discussed ongoing results in class. They likely communicated with each other.
Data security is usually poor, or believed to be poor, with dozens of faculty members, student assistants, and others having access to the raw data. Often papers are left around and files on insecure servers, and the research is all conducted within a fairly narrow community. As a result, prudent students avoid unusual disclosures. Subjects usually have a wide choice of studies, leading to self-selection. In particular, this study will naturally exclude people who find social media important—that is, the group of greatest concern—as they will be unwilling to limit social media for three weeks. Moreover, undergraduate psychology students at an elite university are hardly a representative sample of the population the authors wish to regulate.
Another problem with these types of studies is they are usually data-mined for any statistically significant finding. If you run 100 different tests at the 5 percent level of significance, you expect to find five erroneous conclusions. This study described seven tests (but there’s a red flag that many more were performed. Few researchers will go through the trouble of collecting data for a year and fail to get some publications out of it, and it’s never a good idea to report to a granting institution that you have nothing to show for the money.
This particular study had poor control. Students who limited social media time were compared to students with no limits. But imposed limits that severely restrict any activity are likely to have effects. A better control group would be students limited to ten minutes daily of television, or video games, or playing music while alone. Having an additional control with no restrictions would be valuable to separate the effect of restrictions versus the effect of the specific activity restricted. Another problem is researchers could only measure specific social media sites on the subject’s personal iPhone, not activity at other sites or on tablets, laptops, computers, or borrowed devices.
The red flag mentioned above is that the subjects with high depression scores were assigned to one of the groups—experimental (restricted social media) or control (no restrictions)—at a rate inconsistent with random chance. The authors don’t say which group got the depressed students.
In my experience, this is almost always the effect of a coding error. It happens only with laundry list studies. If you were only studying depression, you’d notice if all your depressed subjects were getting assigned to the control group or all to the experimental group. But if you’re studying lots of things, it’s easier to overlook one problematic variable. That’s why it’s a red flag when the researchers are testing lots of unreported hypotheses.
Further evidence of a coding error is that the reported depression scores of subjects who were assigned to abstain from Facebook promptly reverted in one week. This was the only significant one-week change anywhere in the study. That’s as implausible as thinking the original assignment was random. My guess is that the initial assignment was fine, but a bunch of students in either control or experimental group got their initial depression scores inflated due to some kind of error.
I’ll even hazard a guess as to what it was. Depression was supposed to be measured on 21 scales ranging from zero to 3, which are then summed up. A very common error on these Likert scales is to code those scales instead as 1 to 4. Thus someone who reported no signs of depression should have been a zero but gets coded as a 21, which is a fairly high score. If this happened to a batch of subjects in either the control or experimental group, it explains all the data better than the double implausibility of a defective random number generator (but only for this one variable) and a dramatic change in psychological health after a week of social media restriction (but only for the misassigned students). Another common error is to select for control or experimental accidentally using the depression score instead of the random variable. Since this was a rolling study, it’s plausible that the error was made for a period and then corrected.
The final piece of evidence against a legitimate result is that assignment to the control or experimental group had a stronger statistical association with depression score before assignment—which it cannot possibly affect—than with reduction in depression over the test—which is what researchers are trying to estimate.The evidence for the authors’ claimed effect—that restricting social media time reduces depression—is weaker than the evidence from the same data for something we know is false—that depression affects future runs of a random number generator. If your methodology can prove false things it can’t be reliable.
Speculations about errors aside, the apparent nonrandom assignment means you can’t take this study seriously, whatever the cause. The authors do disclose the defect, although only in the body of the paper—not in the abstract, conclusion, or limitations sections—and only in jargon: “There was a significant interaction between condition and baseline depression, F(1, 111) = 5.188, p <.05.”
They follow immediately with the euphemistic, “To help with interpretation of the interaction effect, we split the sample into high and low baseline depression.” In plain English, that means roughly: “To disguise the fact that our experimental and control groups started with large differences in average depression, we split each group into two and matched levels of depression.”
“Taking a One-Week Break from Social Media Improves Well-Being, Depression, and Anxiety: A Randomized Controlled Trial” was an experiment in name only. Half of a sample of 154 adults (aged 18 to 74) were asked to stop using social media for a week, but there was no monitoring of actual usage. Any change in answering questions about depression was an effect of mood rather than psychological health. The effect on adult mood of being asked to stop using social media for a week tells us nothing about whether social media is bad for the mental health of teenage girls.
None of the remaining experiments measured social media usage and depression. Some of the observational, longitudinal, or experimental studies I ignored because they didn’t directly address social media use and depression might have been suggestive ancillary evidence. If Facebook usage or broadband internet access were associated with depression, or if social media use were associated with life dissatisfaction, that would be some indirect evidence that social media use might have a role in teenage girl depression. I have no reason to think these indirect studies were better than the direct ones, but they could be.
If there were a real causal link large enough to explain the increase in teenage girl depression, the direct studies would have produced some signs of it. The details might be murky and conflicting, but there would be some strong statistical results and some common findings of multiple studies using different samples and methodologies. Even if there’s lots of solid indirect evidence, the failure to find any good direct evidence is a reason to doubt the claim.
What would it take to provide convincing evidence that social media is responsible for the rise in teenage girl depression? You have to start with a reasonable hypothesis. An example might be, “Toxic social media engagement (TSME) is a major causal factor in teenage girl depression.” Of course TSME is hard to measure, or even define. Haidt discusses how it might not even result from an individual using social media, the social media could create a social atmosphere that isolates or traumatizes some non-users.
But any reasonable theory would acknowledge that social media could also have positive psychological effects for some people. Thus it’s not enough to estimate the relation between TSME and depression, we want to know the full range of psychological effects of social media–good and bad. Studying only the bad is a prohibitionist mindset. It leads to proposals to restrict everyone from social media, rather than teasing out who benefits from it and who is harmed.
TSME might—or might not—be correlated with the kinds of things measured in these studies, such as time spent on social media, time spent looking at screens, access to high-speed Internet. The correlation might–or might not–be causal. But we know for sure that self-reported social media screen time cannot cause responses to how often an individual feels sad. So any causal link between TSME and depression cannot run through the measures used in these studies. And given the tenuous relations between the measures used in the studies, they tell us nothing about the link we care about, between TSME and depression.
A strong study would have to include clinically depressed teenage girls who were heavy social media users before they manifested depression symptoms and don’t have other obvious depression causes. You can’t address this question by looking at self-selected non–social media users who aren’t depressed. It would need meaningful measures of TSME, not self-reports of screen time.
The study would also have to have 30 relevant subjects. With fewer, you’d do better to consider each one’s story individually, and I don’t trust statistical estimates without at least 30 relevant observations.
There are two ways to get 30 subjects. One is to start with one of the huge public health databases with hundreds of thousands of records. But the problem there is that none have the social media detail you need. Perhaps that will change in the next few years.
The other is to identify relevant subjects directly, and then match them to nondepressed subjects of similar age, sex, and other relevant measures. This is expensive and time-consuming, but it’s the type of work that psychologists should be doing. This kind of study can produce all sorts of valuable collateral insights you don’t get by pointing your canned statistical package to some data you downloaded or created in a toy investigation.
This is illustrated by the story told in Statistics 101 about a guy who dropped his keys on a dark corner, but is looking for them down the block under a street light because the light is better there. We care about teenage girls depressed as a result of social media, but it’s a lot easier to study the college kids in your psychology class or random responders to internet surveys.
Most of the studies cited by Haidt express their conclusions in odds ratios—the chance that a heavy social media user is depressed divided by the chance that a nonuser is depressed. I don’t trust any area of research where the odds ratios are below 3. That’s where you can’t identify a statistically meaningful subset of subjects with three times the risk of otherwise similar subjects who differ only in social media use. I don’t care about the statistical significance you find; I want clear evidence of a 3–1 effect.
That doesn’t mean I only believe in 3–1 or greater effects. If you can show any 3–1 effect, then I’m prepared to consider lower odds ratios. If teenage girls with heavy social media use are three times as likely to be in the experimental group for depression 12 months later than otherwise similar teenage girls that don’t use social media, then I’m prepared to look at evidence that light social media use has a 1.2 odds ratio, or that the odds ratio for suicide attempts is 1.4. But without a 3–1 odds ratio as a foundation, it’s my experience that looking at any random data can produce plenty of lesser odds ratios, which seldom stand up.
Haidt is a rigorous and honest researcher, but I fear that on this issue he’s been captured by a public health mindset. Rather than thinking of free individuals making choices, he’s looking for toxins that affect fungible people measured in aggregate numbers. That leads to blaming social problems on bad things rather than looking for the reasons people tend to use those things, with their positive and negative consequences.
It is plausible that social media is a significant factor in the mental health of young people, but almost certainly in complex ways. The fact that both social media and depression among teenage girls began increasing about the same time is a good reason to investigate for causal links. It’s obviously good for social media companies to study usage patterns that predict future troubles and for depression researchers to look for commonalities in case histories. A few of the better studies on Haidt’s list might provide useful suggestions for these efforts.
But Haidt is making a case based on simplifications and shortcuts of the sort that usually lead to error. They treat individuals as faceless aggregations which obscures the detail necessary to link complex phenomena like social media use and depression. The studies he cites are cheap and easy to produce, done by researchers who need publications. Where the data used are public or disclosed by the researchers, I can usually replicate them in under an hour. The underlying data was generally chosen for convenience—already compiled for other reasons or studying handy people rather than relevant ones—and the statistical analyses were cookbook recipes rather than thoughtful data analyses.
The observation that most published research findings are false is not a reason to ignore academic literature. Rather, it means you should start by finding at least one really good study with a clear strong result and focus precisely on what you care about. Often, weaker studies that accumulate around that study can provide useful elaboration and confirmation. But weak studies and murky results with more noise than signal can’t be assembled into convincing cases. It’s like trying to build a house out of plaster with no wood or metal framing.
It’s only the clarity of his thought and his openness that makes Haidt vulnerable to this critique. Many experts only reference the support for their claims in general terms, or provide lists of references in alphabetical order by author instead of the logical arrangements Haidt provides. That allows them to dismiss criticisms of individual studies as cherry-picking by the critic. Another popular tactic is to couch unjustified assumptions in impenetrable jargon, and to obscure the underlying logic of claims.
On the other hand, I think I am delivering a positive message. It’s good news that something as popular and cherished as social media is not clearly indicted as a destroyer of mental health. I have no doubt that it’s bad for some people, but to find out more we have to identify those people and talk to them. We need to empower them and let them describe their problems from their own perspectives. We don’t have to restrict social media for everyone based on statistical aggregations.
The post The Statistically Flawed Evidence That Social Media Is Causing the Teen Mental Health Crisis appeared first on Reason.com.
from Latest https://ift.tt/J9EbHal
via IFTTT