Authored by Lance Roberts via RealInvestmentAdvice.com,
Market Rally Continues
Last week, we discussed that as the market hit new highs, further upside was likely limited. To wit:
“While the upside remains somewhat limited, given the already substantial advance this year, the rally will alleviate downside concerns momentarily. However, with that said, the extremely low level of volatility this year is reminiscent of 2017. The reason is that “stability” is fragile. In other words, stability ultimately leads to instability.“
For more information on the “instability of instability,” read “The Next Minsky Moment.”
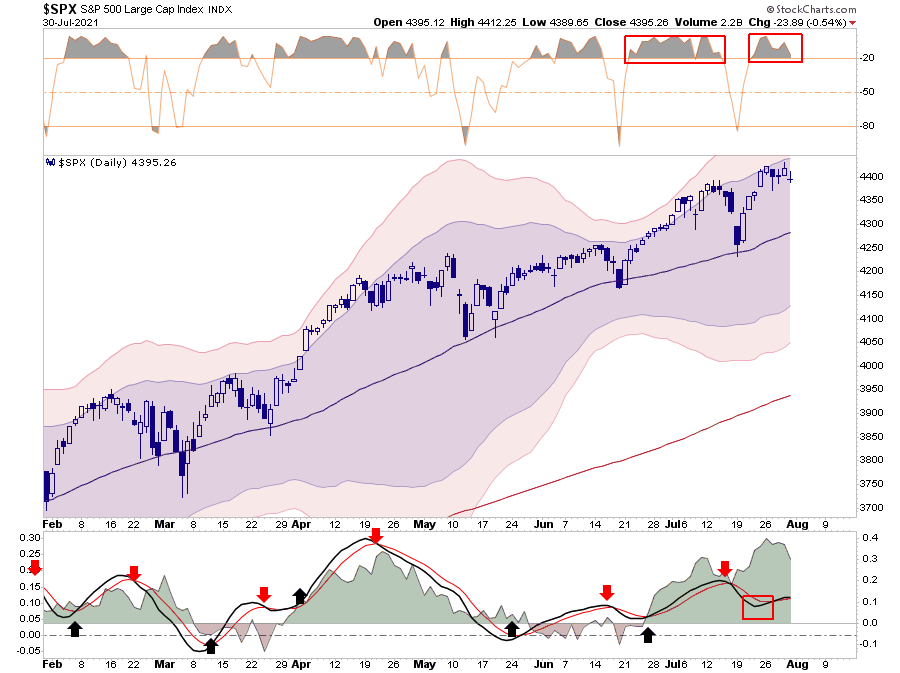
Not surprisingly, the market didn’t make much headway this past week, given the current extended and overbought conditions. For now, “buy signals” remain intact, which likely limits the downside over the next week. However, a retest of the 50-dma is certainly not out of the question.
With that said, we are entering into the two weakest trading months of the year. Stocktrader’s Almanac had a good note on why the rally could experience a “pause” over the next two months.
“For the past 33 years from 1988-2020 August and September are the worst two months of the year for DJIA, S&P 500, and NASDAQ. August is the worst for DJIA and S&P 500 and September is worst for NASDAQ.
Despite the persistence and resilience of this bull rally market internals and technicals are showing some signs of fatigue.“
-
Advancing issues have barely outpaced decliners in recent weeks.
-
New highs have been shrinking while new lows remain high.
-
Technical indicators are struggling to break through resistance.
-
Relative Strength, Stochastics and MACD are breaking down again.
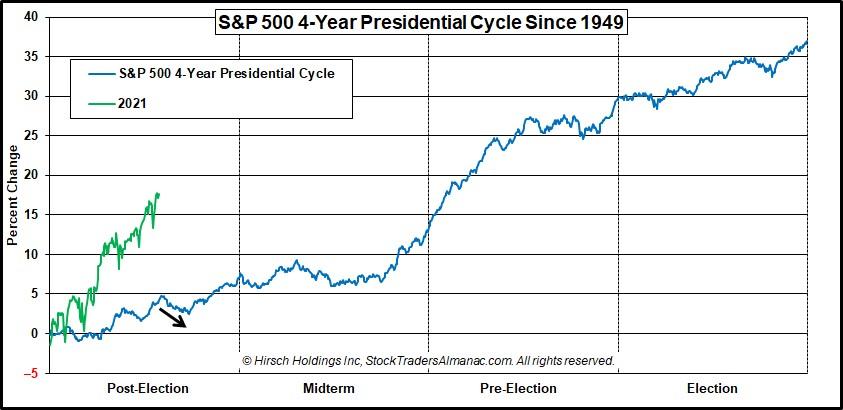
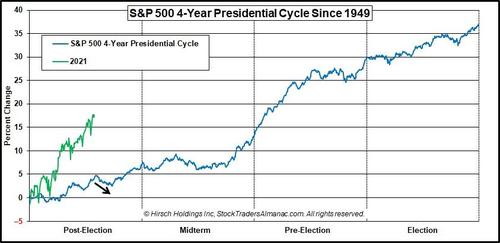
“The timing of a pause coincides with the weak seasonal patterns mentioned above during the worst months of the year August and September (not to mention Octoberphobia) as well as the 4-Year Presidential Election Cycle.”
6-Month Advances Are Rare
Given the bullish bias currently remains unfettered, and the Fed is still applying $120 billion a month in liquidity, there is no reason to be overly “bearish” at this juncture. Thus, while we are carrying slightly reduced exposure currently and have increased our “risk hedges” as of late, we remain nearly fully invested.
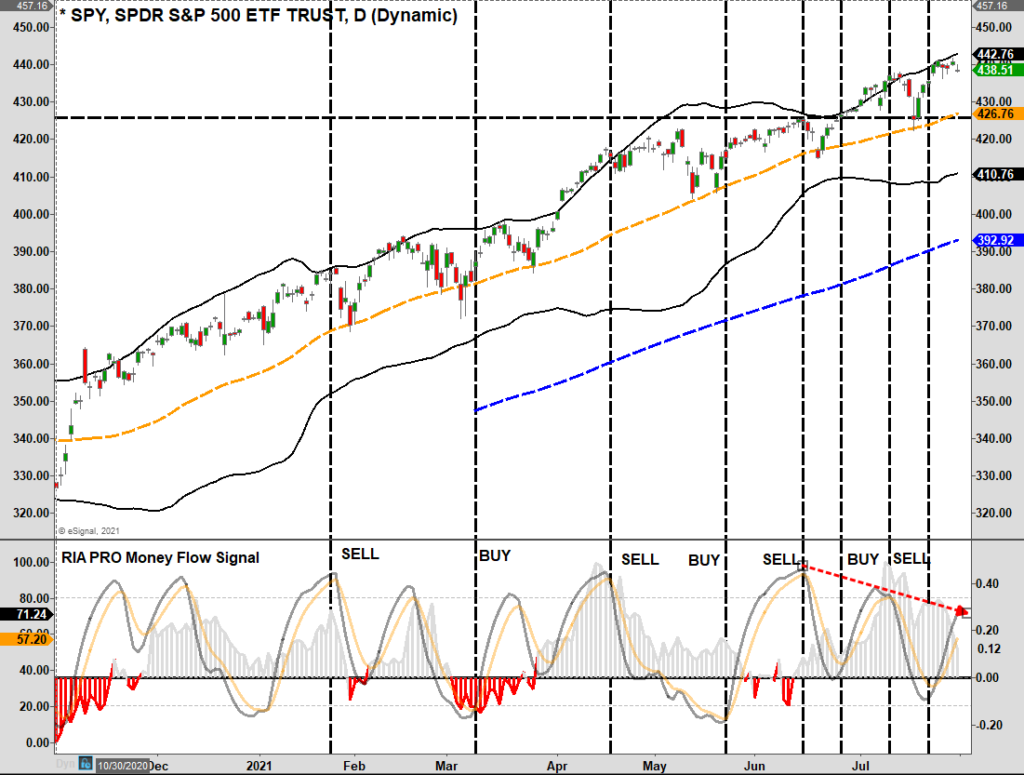
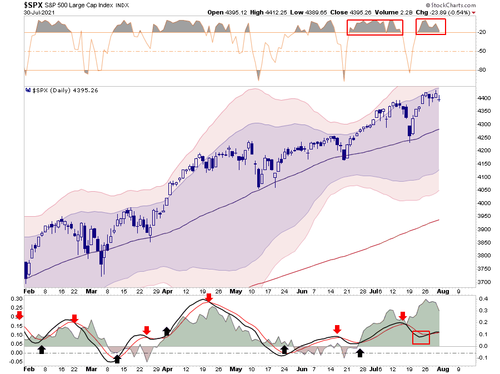
With our “money flow buy signals” triggered, such suggests there is support for stocks currently. Such means two things over the next week or so: 1) there is not a great deal of downside, and 2) there is not much upside either. Thus, a sideways consolidation and a pickup in volatility are likely. One concern is the “negative divergence” of money flows (bottom panel) against an advancing market. Such corresponds with the technical weakness we will discuss momentarily.
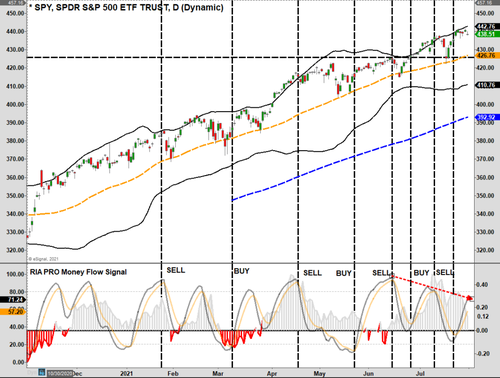
Therefore, given this backdrop, we increased portfolio hedges.
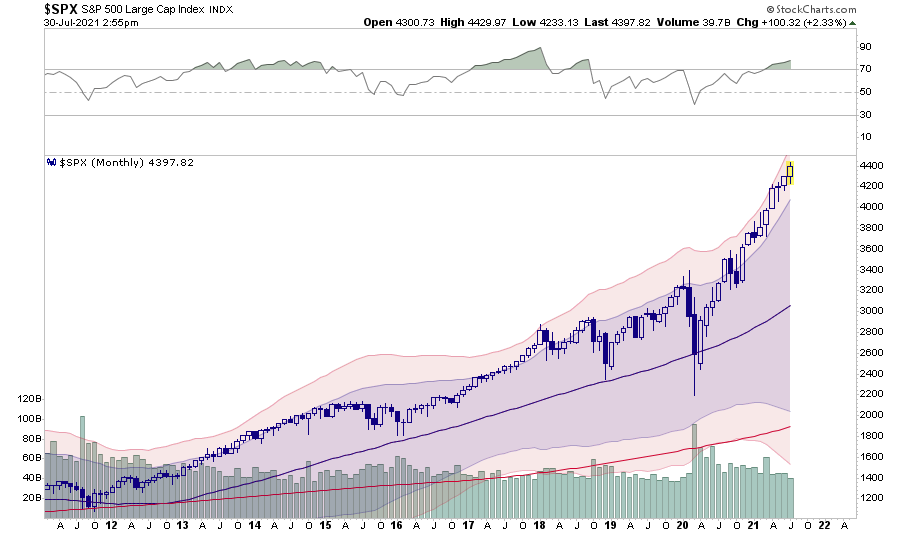
An additional “red flag” is the S&P 500 has had positive returns for 6-straight months. As shown in the 10-year monthly chart below, such streaks are a rarity, and when they do occur, they are usually met by a month, or more, of negative returns.
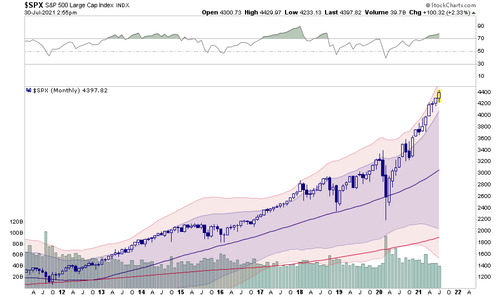
(It is also worth noting that when the 12-Month RSI is this overbought, larger corrective processes have occurred.)
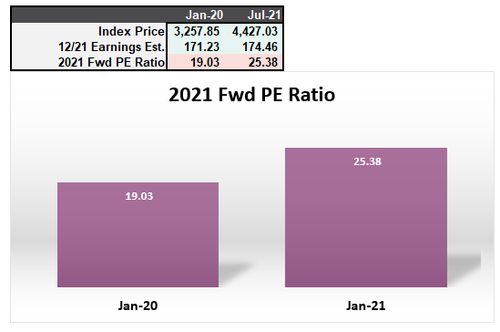
While prices have advanced sharply, the bullish mantra remains that “earnings” support the increase. While that “rationalization” may seem to have merit, investors are paying more today for the same expected earnings from January of 2020.
The Mirage Of Strong Earnings
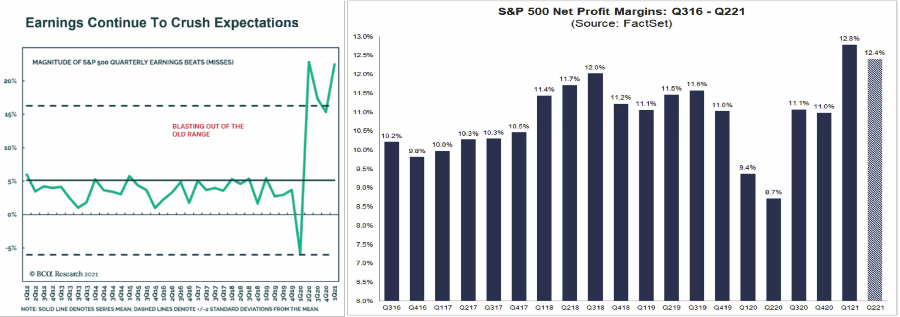
The second-quarter earnings season started with a bang, with several companies reporting earnings “knocking the cover off the ball.”
“Overall, 24% of the companies in the S&P 500 have reported earnings to date for the second quarter. Of these companies, 88% have reported actual EPS above the mean EPS estimate. Another 1% have reported actual EPS equal to the mean EPS estimate, and 11% have reported actual EPS below the mean EPS estimate. The percentage of companies reporting EPS above the mean EPS estimate is above the 1-year (83%) average and above the 5-year (75%) average.” – FactSet

It is not surprising that stocks are rallying to new highs again this week with those kinds of numbers.
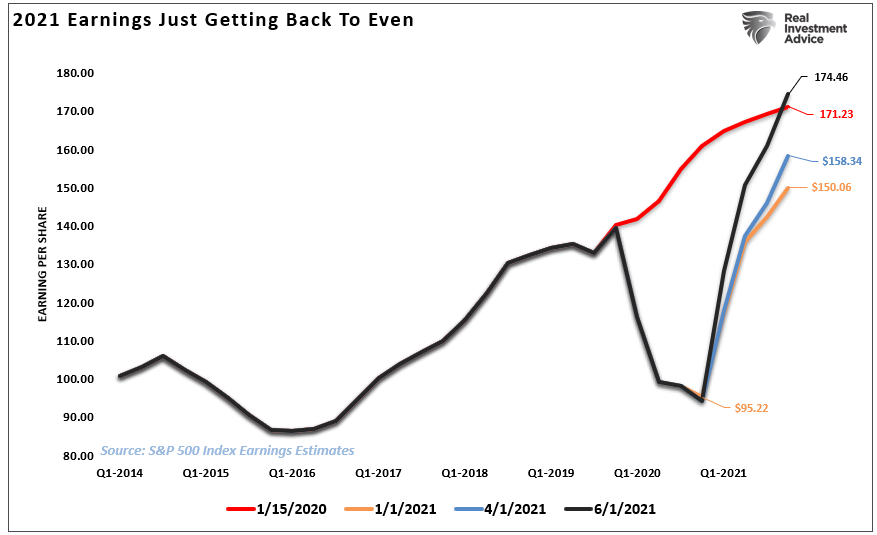
However, the longer-term problem for investors is that while the earnings were strong, they are only getting back to levels where they were supposed to be at the beginning of 2020. As shown, in January of 2020, the earnings estimate for the end of 2021 was $171/share. Currently, before estimates get downwardly revised, it is presently estimated that earnings will be just $174/share at the end of 2021.
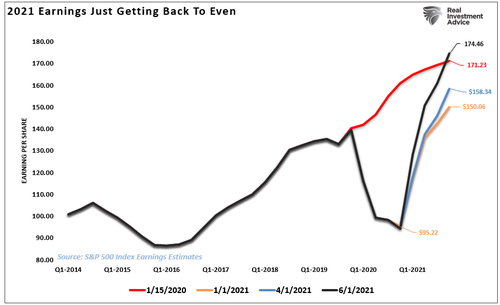
As noted, the problem for investors comes down to valuations. For example, in January of 2020, investors were paying 19x for 2-year forward earnings. Today, they are paying 25x earnings for essentially the same dollar amount of earnings.
While it gets lost in the daily media, the reality is the price of the market is outpacing actual earnings growth. More importantly, when looking back historically, we see that earnings growth isn’t as strong as headlines suggest.
We certainly understand that valuations have very little importance in the short term. For now, all that matters is price momentum. However, as investors, it is essential to remember that valuations have great importance longer-term.
Sales Are Worse
Of course, such doesn’t even come close to premiums paid for each dollar of “actual sales” generated by the underlying companies. As we noted in “Priced For Perfection,” sales will decline this quarter, driving the price-to-sales ratio to historical levels. To wit:
“Investors should not dismiss the above quickly. Revenue is what happens at the top line. Secondly, revenue CAN NOT grow faster than the economy. Such is because revenue comes from consumers, and consumption makes up 70% of the GDP calculation. Earnings, however, are what happens at the bottom line and are subject to accounting gimmicks, wage suppression, buybacks, and other manipulations.“
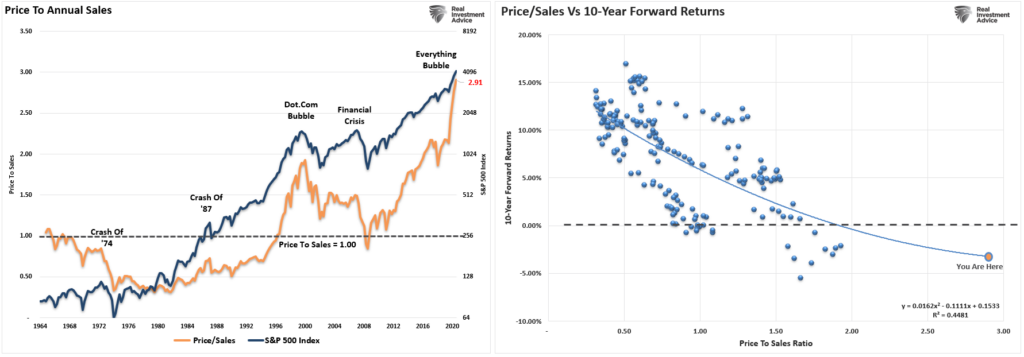
Currently, the price-to-sales (revenue) ratio is at the highest level ever. As shown, the historical correlation suggests outcomes for investors will not be kind.

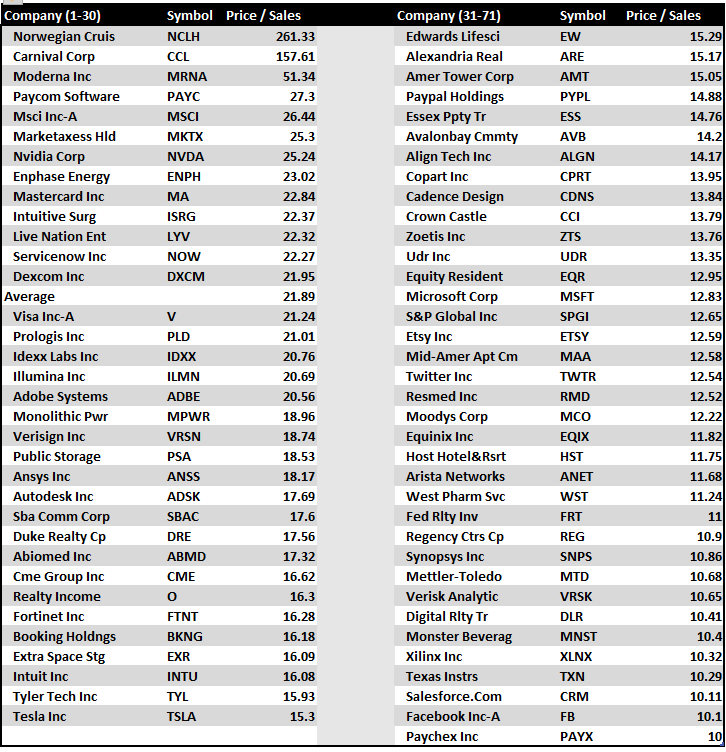
Currently, there are more than 70 companies in the S&P 500 trading above 10x sales. That is 14% of the entire index, one of the highest levels ever on record. (How many of these companies do you own?)

A Lesson From 2000
Why is that important? For that answer, let’s revisit what Scott McNealy, then CEO of Sun Microsystems, said in 2000.
“At 10-times revenues, to give you a 10-year payback, I have to pay you 100% of revenues for 10-straight years in dividends. That assumes I can get that by my shareholders. It also assumes I have zero cost of goods sold, which is very hard for a computer company.
That assumes zero expenses, which is hard with 39,000 employees. That assumes I pay no taxes, which is very hard. And that expects you pay no taxes on your dividends, which is kind of illegal. And that assumes with zero R&D for the next 10-years, I can maintain the current revenue run rate.
Now, having done that, would any of you like to buy my stock at $64? Do you realize how ridiculous those underlying assumptions are? You don’t need any transparency. You don’t need any footnotes.
What were you thinking?”
Of course, much of this is “forgotten history,” as many investors today were either a) not alive in 1999 or b) still too young to invest. However, for the newer generation of investors, the lack of “experience” provides no basis for the importance of “valuations” to future outcomes.
That is something only learned through experience.
GDP Eclipses Pre-Pandemic Level
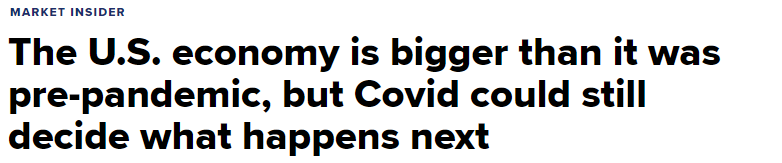
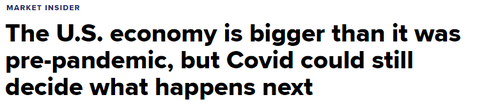
On Thursday, CNBC ran the following headline:
To wit:
“The U.S. economy is now larger than it was before the pandemic, but its growth rate may have peaked this year at a much slower pace than expected.” – Patti Dom, CNBC
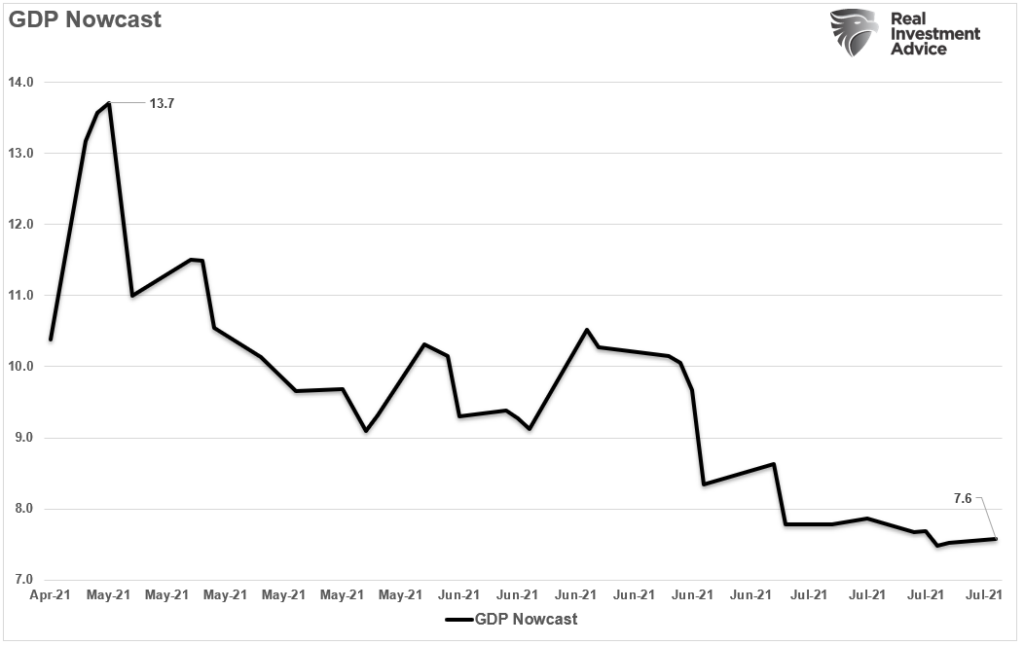
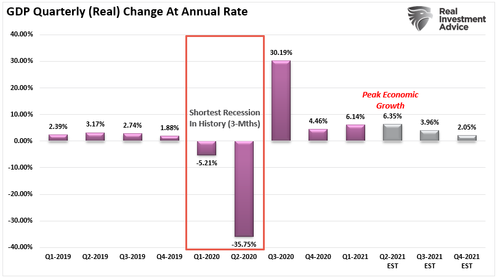
Patti is correct; economic growth just peaked.
The problem with the 6.5% annualized rate is it was more than 50% lower than the original estimates of 13.5%. More troubling was the report was even lower than the Atlanta Fed’s much-reduced 7.6% estimate.

What was missed by the mainstream media are two very critical factors.
-
The sharp decline in expected GDP growth rates suggests that “deflationary” pressures are present; and,
-
Given the relationship between economic growth and earnings, current estimates will be revised lower.
Over the next two quarters and fully into 2022, economic growth rates will decline back to 2% or less.
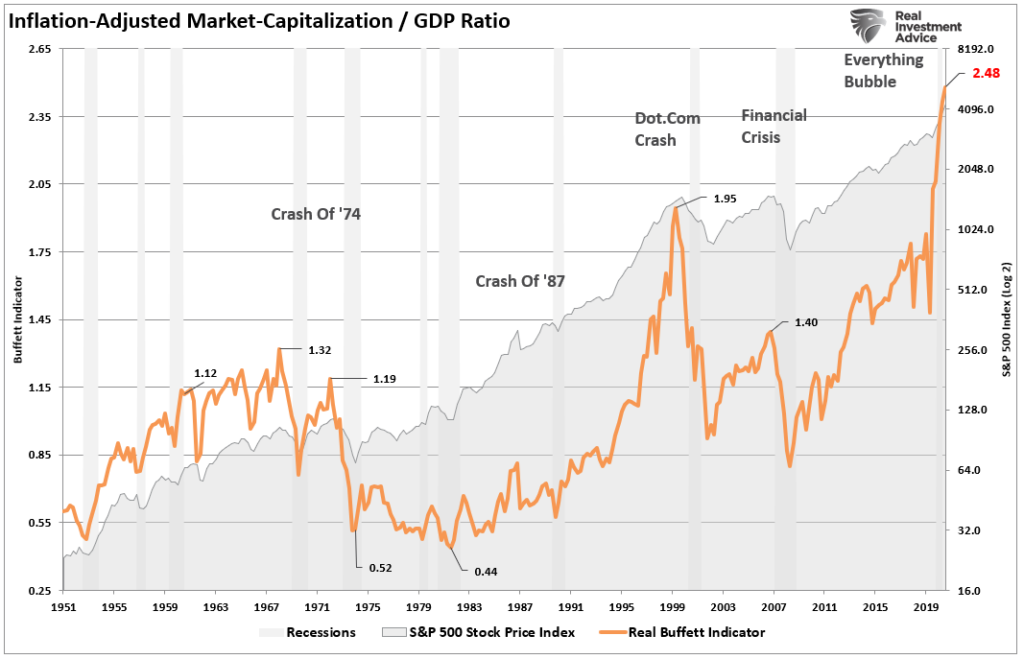
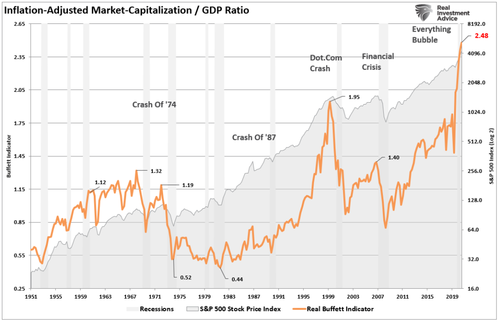
More importantly, the weaker than expected GDP report pushed the Market Capitalization / GDP ratio (inflation-adjusted) to a record high. But, again, given that revenues are a function of consumption (70% of the GDP calculation), earnings growth will weaken by default.
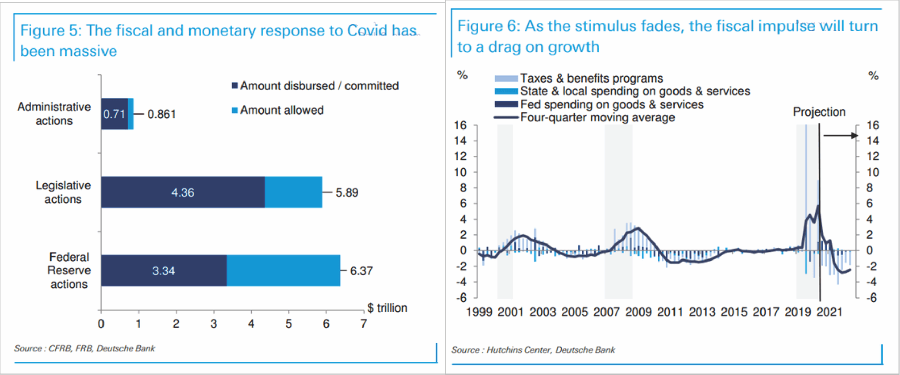
Lastly, while the economy is indeed larger than pre-pandemic, such is of little consolation. When you realize it took $8 Trillion in monetary stimulus (40% of the economy) to create $406 billion in growth from Q1-2020, it is a little underwhelming.
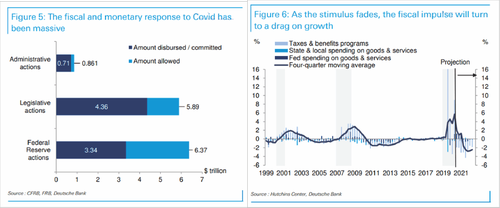
Next year, the fiscal impulse will become a drag.
Such will make it much harder to justify current valuations in a much slower economic growth environment.
Portfolio Update (Party On Garth)
For now, as noted above, the markets remain bullishly biased, and there seems little to derail that mentality currently. The weaker than expected economic growth rate gave the markets reassurance the Fed won’t “taper” anytime soon.
In the meantime, we continue to maintain nearly full equity exposure in our portfolio models. However, the one change we have been quietly making over the last two months is increasing the duration of our bond portfolios. Such is because the recent peak in interest rates is more telling about the economy’s outlook and markets than many would like to admit. (See Why Bonds Aren’t Overvalued.)
While the markets are indeed in “Party On Garth” mode, the current extended, overbought, and bullish conditions provide the necessary backdrop for a short-term correction.
As discussed over the last couple of weeks, August and September tend to be weaker performance months. Therefore, with the bulk of earnings soon behind us, the focus will turn back to the economy and the Fed.
In the near term, the most significant risk for the market comes from the Federal Reserve at the Jackson Hole Summit this summer. If there is a change in their outlook to a more “hawkish” stance or more detailed “taper” discussions, the markets may react negatively.
Another immediate risk could be a failure to pass additional stimulus in Congress or a movement to “lockdowns” due to the virus.
In conclusion, it is simple enough to say “I have no idea” what could derail the markets. Such is why we analyze the risk each week and try to make prudent and informed decisions about portfolio exposures and risk management.
It’s the best we can do for you and our clients.
Have a great weekend.