The moment of truth for Turkey’s executive president and currency manipulator-in-chief has arrived.
Turks are voting on Sunday in local elections which President Tayyip Erdogan has described as a matter of survival for Turkey and which were marred by lethal violence that left two party members dead in the country’s southeast.
While Erdogan, who last June won a presidential election which further cemented his rule by gaining executive powers, has become the country’s most popular, yet also most divisive, modern leader, he could be dealt an electoral blow with polls indicating his ruling AK Party (AKP) may lose control of the capital Ankara, and even Istanbul, the country’s largest city according to Reuters.
Erdogan exits a polling station during the municipal elections in Istanbul, Turkey, March 31
And with the stagflating economy in a deep recession following a currency crisis last year which saw the lira lose more than 30% of its value, some voters appeared ready to punish Erdogan, who has ruled with an increasingly uncompromising stance.
“I was actually not going to vote today, but when I saw how much they (AKP) were flailing, I thought this might be time to land them a blow. Everyone is unhappy. Everyone is struggling,” said 47-year-old Hakan after voting in Ankara.
The polling stations closed at 4 p.m. local time in eastern Turkey and an hour later in the rest of the country. While early indications from preliminary vote counts were expected two or three hours after voting closed, though a clear picture would take longer especially if the voting process is rigged, as some have warned may happen.
Ahead of the election, the lira once again tumbled forcing the central bank to briefly hike the overnight swap rate to a ludicrous 1300% and force a short squeeze; however with the elections now over, many expect the currency’s free fall will resume apace as Turkey’s economic woes and runaway inflation are only getting worse. Last week Erdogan blamed the country’s economic woes on attacks by the West, saying Turkey would overcome its troubles and adding he was “the boss” of the economy.
“The aim behind the increasing attacks towards our country ahead of the elections is to block the road of the big, strong Turkey,” Erdogan told a rally in Istanbul on Saturday.
Sunday’s elections, in which Turks vote for mayors and other local officials across the country, are the first since Erdogan assumed sweeping presidential powers last year and will be a reckoning for his government, which has come under fire for its economic policies and record on human rights.
Meanwhile, as on prior elections, Sunday’s vote was marred by violence in the southeast and Istanbul where two members of the small Islamist Felicity Party, a polling station official and an election observer, were shot dead in Malatya province, a party spokesman said. Media reports said one person had been detained. After voting in Istanbul, Erdogan said he was saddened by the incident and that it was being thoroughly investigated. Some 553,000 police and security force members were on duty for the vote nationwide.
Elsewhere, two people were hurt in the town of Diyarbakir, after being stabbed in a dispute between candidates, a hospital source told Reuters, while dozens of people were hurt in other election-related clashes in the southeast.
One person was stabbed as 15 people clashed in a row between candidates in Istanbul’s Kadikoy district, a police source said.
* * *
With all eyes now on the results, defeat in Ankara or Istanbul would end nearly a quarter of a century of rule by Erdogan’s AKP or its predecessors in Turkeys’ two most important cities and deal a symbolic blow to Turkey’s leader; it is unclear if such a result would prompt Erdogan to become less confrontational or seek to further tighten his grasp on control.
Ahead of the vote, the main opposition Republican People’s Party (CHP) and Iyi (Good) Party formed an electoral alliance to rival that of the AKP and its nationalist MHP partners. The pro-Kurdish opposition Peoples Democratic Party (HDP), which Erdogan has accused of links to Kurdish militants, is not fielding candidates for mayor in Istanbul or Ankara, which is likely to benefit the CHP.
“Before, this city did not have the services I have now seen. I gave my vote to the AK Party for services to continue,” said tradesman Haci Ahmet Beyaz, 43.
In typical fashion, in the days leading up to the vote Erdogan held over 100 rallies across the country and blasted his rivals as terrorist supporters and warned that if the opposition candidate wins in Ankara, residents would “pay a price”. His opponents have denied the accusations and challenged his characterisation of the elections as a matter of survival.
“We’re electing mayors. What does this have to do with the country’s survival?” Kemal Kilicdaroglu, head of the CHP, told a rally in Eskisehir.
We will bring you the election results as soon as they are released.
via ZeroHedge News https://ift.tt/2VdVKP3 Tyler Durden
Maybe it’s because she just cost their community 25,000 high-paying jobs (plus hundreds, maybe thousands, of ancillary jobs supporting those workers) by helping to drive Amazon out of New York. Or maybe it’s because, after nearly four months in office, she still hasn’t found space for an office in the Bronx. Or maybe it’s because she’s too busy “engaging” with her nearly 4 million twitter followers to respond to constituents’ messages.
Whatever the case may be, the New York Post reported on Sunday that “Girl from the Bronx” Alexandria Ocasio-Cortez has angered many activists in her district. And now they are complaining to their hometown tabloid that the rep they voted for over Democratic Party leader Joe Crowley has ignored them since arriving in Washington.
AOC
Constituents seeking help from AOC, or her office, for issues involving the preservation of a local animal shelters, cleaning up parks, fixing problems at a local post office branch and forcing Amtrak to clean up graffiti on its property in the borough, have been unable to reach anyone from her team. Calls to phone numbers for her Queens and DC offices lead to automated voicemail services that direct constituents to her website. From there, they can request time to meet with AOC.
“I thought AOC would be our savior, but that’s not the case,” complained Roxanne Delgado, a local activist who said she has tried for months to get in touch with the congresswoman for help saving an animal shelter and to clean up parks in the district.
Delgado, 40, says she has made numerous calls to Ocasio-Cortez’s offices in Washington and Queens and sent a barrage of tweets after the freshman lawmaker encouraged residents during a recent visit to a Bronx public library to hit her up on social media.
When the Post tried to call AOC’s office, it met with a similar response: radio silence.
“NO email or contact on @AOC’s page except DC number which has full #voicemail and no one picks up,” Delgado tweeted on Monday.
The Post made several calls to both the Washington and Queens offices last week. The same recording at both numbers gives Ocasio-Cortez’s Web site and doesn’t allow a caller to leave a message.
Indeed, despite all of AOC’s boasting about being “Alex from the Bronx”….
🎶 Don’t be fooled by the plaques that we got, I’m still / I’m still Alex from the Bronx 🎶 pic.twitter.com/eO68AGxn2z
…Many of her constituents are already convinced that she has abandoned them in favor of appearing on Late Night TV, pushing her ‘Green New Deal’ and planning lunches with Elizabeth Warren.
Another Bronx constituent told a community gathering last month that they needed Ocasio-Cortez for a sitdown with post-office officials to sort out difficulties he was having with mail delivery.
“I want AOC or a representative from AOC to be there,” Anthony Vitaliano, a former cop and Community Board 11 member, said at a Feb. 28 board meeting.
Vitaliano, 78, also wants Ocasio-Cortez to pressure Amtrak to clean up graffiti at property it owns on Tremont Avenue.
“You know, I appreciate what she’s doing, but she has to represent us,” he told the board gathering, where other elected officials – from the city and state but not AOC’s office – sent staffers.
Vitaliano told The Post: “She has to address these local issues. Her district is everywhere else in the US. Her heart is not in The Bronx.”
AOC’s indifference to her constituents’ needs has made some nostalgic for Joe Crowley, the Congressman and boss of the Queens Democratic Party, who always had his people at community meetings, willing to listen to constituents’ concerns.
By contrast, he said, residents’ needs received much more attention under Rep. Joe Crowley, whom Ocasio-Cortez unseated in a surprise primary upset last year.
The longtime congressman’s Bronx district representative, Thomas Messina, regularly attended community board meetings, according to Vitaliano.
“Tommy cared about us,” Vitaliano said.
Further insulting her constituents, Ocasio-Cortez’s team brushed off these complaints when approached by the Post, saying only that they are trying their best to find office space in the Bronx, and that “if anybody has any leads”, to let them know.
via ZeroHedge News https://ift.tt/2CL5fO8 Tyler Durden
Liquidity injections and zero interest rate policies disguise risk and may give a false sense of security…
This risk could not be more evident today. Not only have we seen large downgrades to consensus growth estimates and central banks’ expectations of GDP and inflation, leading indicators also point to a much weaker economy ahead.
There are similarities with 2008 that we should not ignore.
A massive China stimulus inflates risky assets and commodities.
Poor macro and earnings data is ignored by markets assuming that all will improve in the second half of the year.
Yield curves invert. 15 economies now have 30-year yields lower than LIBOR overnight rates.
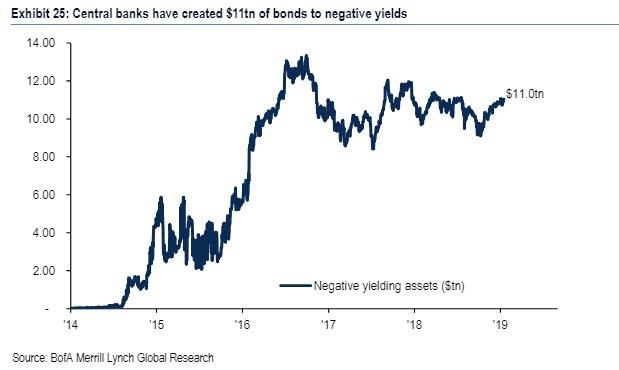
The figure of negative yield debt rises to $11 trillion.
Financial repression is at all-time highs while leading indicators point to a growing risk of recession.
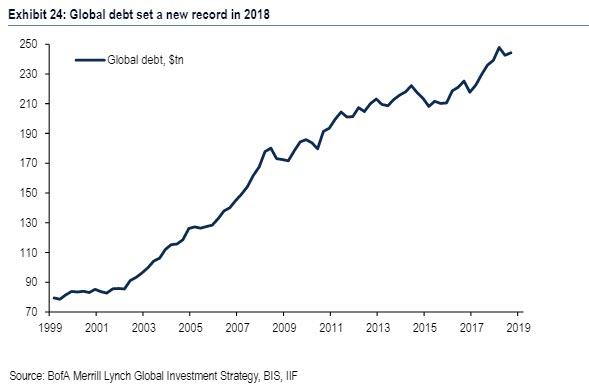
In the first quarter of 2019, stocks have added $9.3 trillion in market capitalization, bonds have gained almost $2 trillion in value. Meanwhile, the Conference Board Index of leading indicators has plummeted for the major economies. The Citi Economic Surprise Index has also fallen, particularly in March, despite a small bounce in the Eurozone at the beginning of the year. Global trade growth, machine equipment orders and manufacturing indices remain poor… while debt soars to another record-high of $244 trillion according to the Bank of International Settlements and the IIF.
The difference with the Asian or the 2008 crisis is that this time the excess risk is hidden under central banks’ balance sheets and will continue to do so.
So, if risk is hidden under a perennial money supply-growth carpet, why should we worry? Because the endgame is not likely to be a 2008-style bang, but a slow, painful and unstoppable zombification of the global economy. As the evidence of stagnation rises, governments get more nervous. What do they do? Stop the monetary madness? Allow high productivity sectors to thrive? Promote deleveraging and prudent investment? No. More white elephants, massive unproductive spending at the expense of taxpayers and savers in what is likely to be yet another massive transfer of wealth from salaries and savers to governments with fancy names.
Investors are forced into riskier assets for lower returns and the crowding out of productive sectors in favour of government and crony subsidised sectors accelerates, sending money velocity lower, productivity growth collapses and mainstream economists hail the financial repression madness with the excuse that “there is no inflation”, while citizens all over the world complain and demonstrate -rightly- against the rise in cost of living. Intensifying financial repression under the “there is no inflation” excuse is the most ludicrous mantra ever. It is like running a car at full speed down a highway under the premise that “we have not crashed yet”.
Many economists defend the zombification of economies under a false social premise. The argument is the following: What is bad about following the example of Japan? It has low unemployment, its debt is cheap and the economy survives rather well. It is a social contract and debt does not matter.
Everything is wrong with this argument. Japan’s low unemployment has nothing to do with monetary and fiscal policy and everything to do with demographics and lack of immigration. Japan’s low cost of debt is not a blessing. It is the result of using the savings of citizens to perpetuate an almost-Ponzi scheme that does not prevent the country from spending more than 20% of its budget on interest expenses. The idea that it is irrelevant because the Treasury buys more bonds tells us how insane we are defending such policies. It is a massive kick-the-can policy transferring the risk to the next generations. It is no wonder that Japanese citizens don´t spend or invest as much as their central planners would want them too. They are not stupid. They know that the government is going to confiscate wealth via monetary and fiscal means at some point. This endless debt machine makes the economy less dynamic, and stagnation is guaranteed. But the strength of the Yen and the low cost of Japanese debt are only supported by the high level of international reserves and strong financial flows of the country. Japàn keeps its imbalances because it is one of the few that has undertaken this concerted policy of zombification. This cannot be transferred to the rest of the world, because the result would not be Japanese-style stagnation but Argentina-style crisis chain.
The fact that Japan has survived two decades of stagnation with the wrong Keynesian policies should not be an excuse to do the same, but an opportunity to do the opposite.
The idea that Quantitative Easing has failed to spur growth and healthy recovery of the world economy is correct. The thought that the mistakes of quantitative easing are solved by outright currency printing and more government crowding out of the productive economy is simply ludicrous. You do not correct mistakes with a bigger mistake.
via ZeroHedge News https://ift.tt/2WBHOyA Tyler Durden
Ten years after central banks launched the greatest monetary experiment in history, pushing rates to zero or lower in an attempt to reflate away an unsustainable debt load while purchasing $12 trillion in securities to prop up risk assets, we are back where we started with deflation once again emerging as the biggest threat to the world, over $10 trillion in sovereign bonds yielding below 0%, and after a disastrous attempt at renormalizing monetary policy, the market is convinced the Fed will cut rates in the next few months.
But besides the greatest roundtrip in monetary policy over the past decade, few things are as they were in 2009.
To demonstrate that, BofA’s Michael Hartnett has published its latest “Hitchhiker’s Guide to the Investment Universe”, which is a primer for investors on the size, composition, risks, returns, flows, valuations of bond & equity universe. The report also finds that, as expected, Wall Street is still “too big to fail”, “Japanification” of growth and rates is prevalent, tech is dominant, there is $175 trillion of assets, there are 536 zombie companies, tech represents 26% of market cap, analysts miss bond yield forecasts by 100bps annually, and much more.
Below we list 20 stunning facts from the report, highlighting Wall Street life, the investment universe and everything…
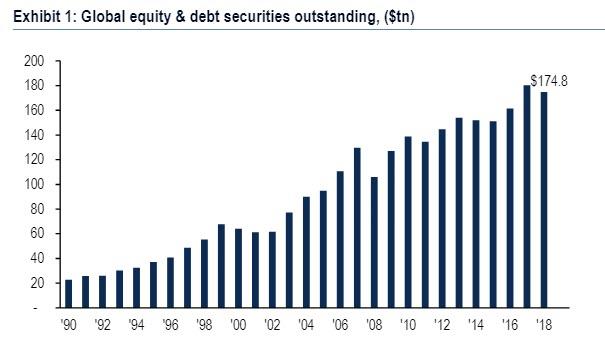
1. $175tn: current value of global financial assets, 2X the size of global GDP
Wall St. is still “too big to fail”: The total value of global stocks & bonds outstanding has jumped by 8x since 1990, from $23tn to $175tn today.
Global asset values are 2X the size of the global economy; Global asset values fell in 2018 from $180tn to $175tn. .
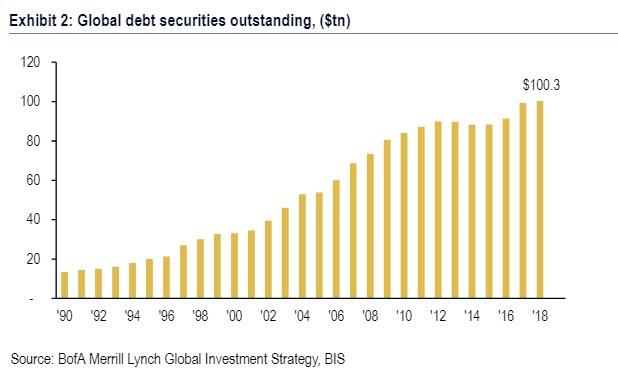
Global debt outstanding is now $100tn, up from just $13tn back in 1990; Debt represents 57% of global financial assets.
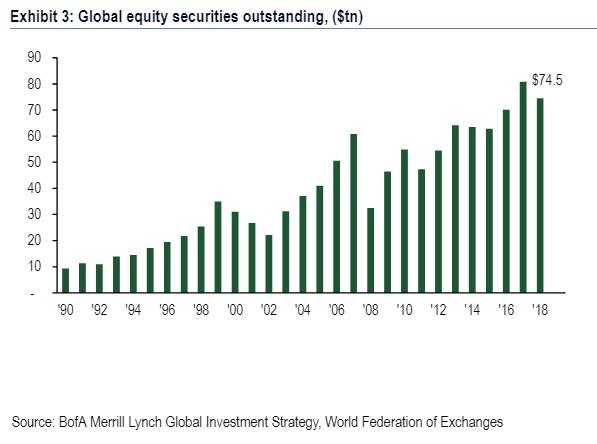
The value of global equities outstanding has similarly surged from $9tn in 1990 to $75tn today. World stocks equities tripled in value between the Global Financial Crisis (GFC) lows in Mar’09 to their most recent peak of $90tn in Jan’18.
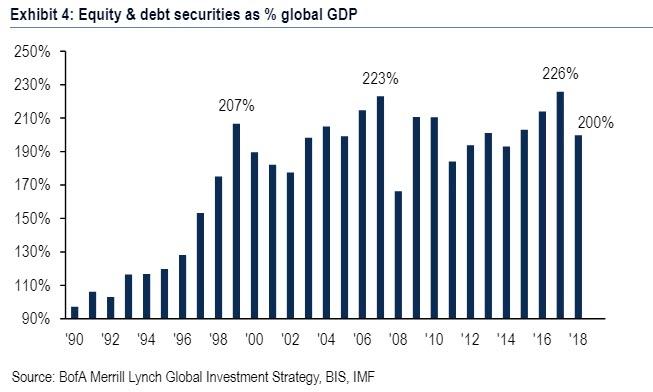
Financial assets are now 200% of global GDP; back in 1990 they were 97%. The most recent peak in financial assets as a % global GDP in 2017 was 226%, just above the 2007 highs.
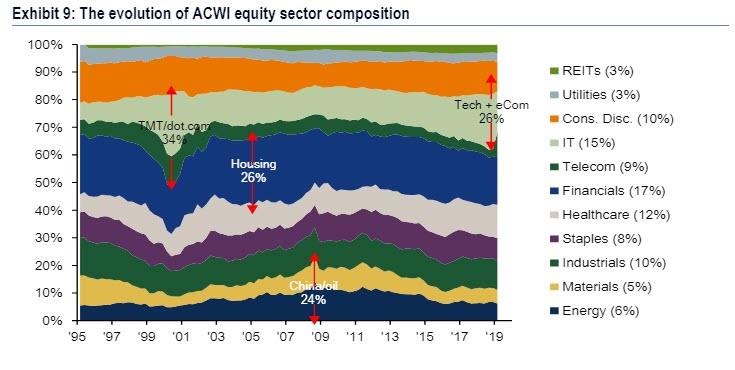
2. 26%: US tech & e-commerce as % of US equity market capitalization
The past 10 years have witnessed the 2nd great bull market in technology in the past 25 years. In 2018, tech & e-commerce sectors accounted for 26% of total market cap (21% today); rivaling prior sector extreme: in the 2000 dot.com bubble TMT was at 34%; in the 2006 housing bubble financials were 26%, and in 2008 during the China/oil bubble, energy & material sectors @ 24%.
T
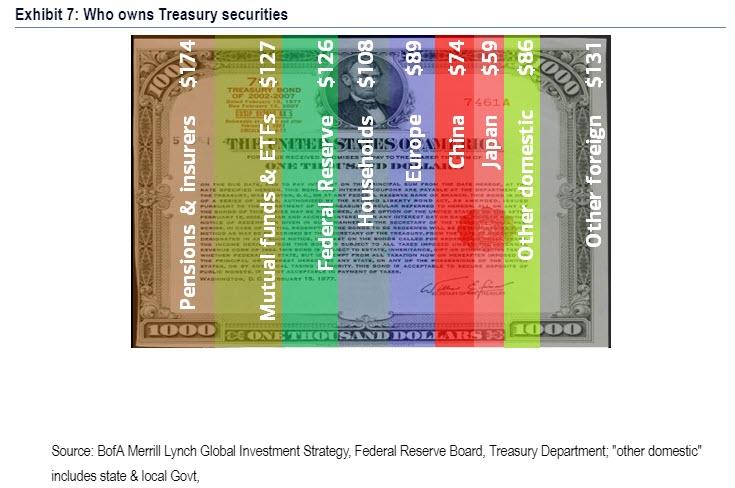
3. 7%: US Treasury market owned by China, largest of any country
China, the world’s second largest economy, is the world’s biggest single country foreign owner of US government debt. Pensions & Insurers (17.4%), mutual funds & ETFs (12.7%) and the Federal Reserve (12.6%) hold the most securities outright.
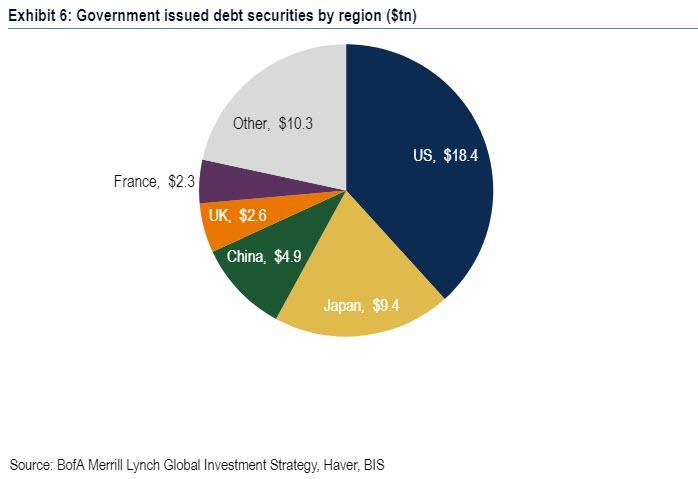
The US Treasury market is by far the largest government bond market in the world accounting for $18.4tn of debt securities: almost $4 of every $10 of government debt outstanding is a US Treasury. The next 4 largest government bond markets are Japan, China, UK & France.
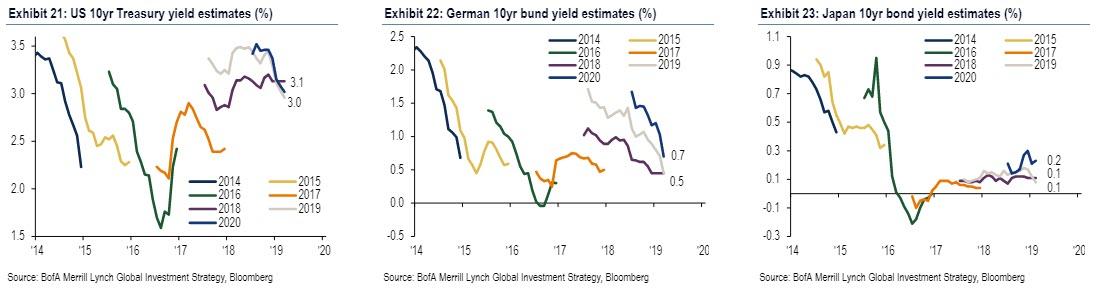
4. 0.2%: the end-2020 consensus forecast for Japan’s 10-year JGB yield
Additionally, every year since 2014 Treasury yields have been forecasted to end each year above 3%; every year they have failed to do so. Across the Atlantic, in the past 6 years the consensus has over-predicted German bond yields by on average 100 basis points. And the forecast for the 10-year JGB yield at the end of 2020 is a pitiful 0.2%. The “Japanification” of global interest rates of the past 10-years thus continues apace.
5. Four deflationary Ds of excess Debt, bank Deleveraging, tech Disruption, and aging Demographics explain the consistent undershoot of inflation expectations.
The inability of monetarism to boost wages and income in the world’s largest economic regions is sparking a populist backlash amongst electorates.
6. There is $11 trillion in global negatively yielding bonds
One reason growth & inflation has disappointed in the past 10 years is the ever-growing level of debt, which is not “multiplying” into economic activity, but is rather leading consumers & companies to increase savings and suppress “animal spirits”. As of Q3 2018 global debt equaled $244.2tn, equivalent to 318% of world GDP.
While debt is at a record high, interest rates are close to record lows. The reason is the unprecedented intervention in debt markets by central banks. “Financial suppression” means there are $11.0tn of bonds trading with negative yields today.
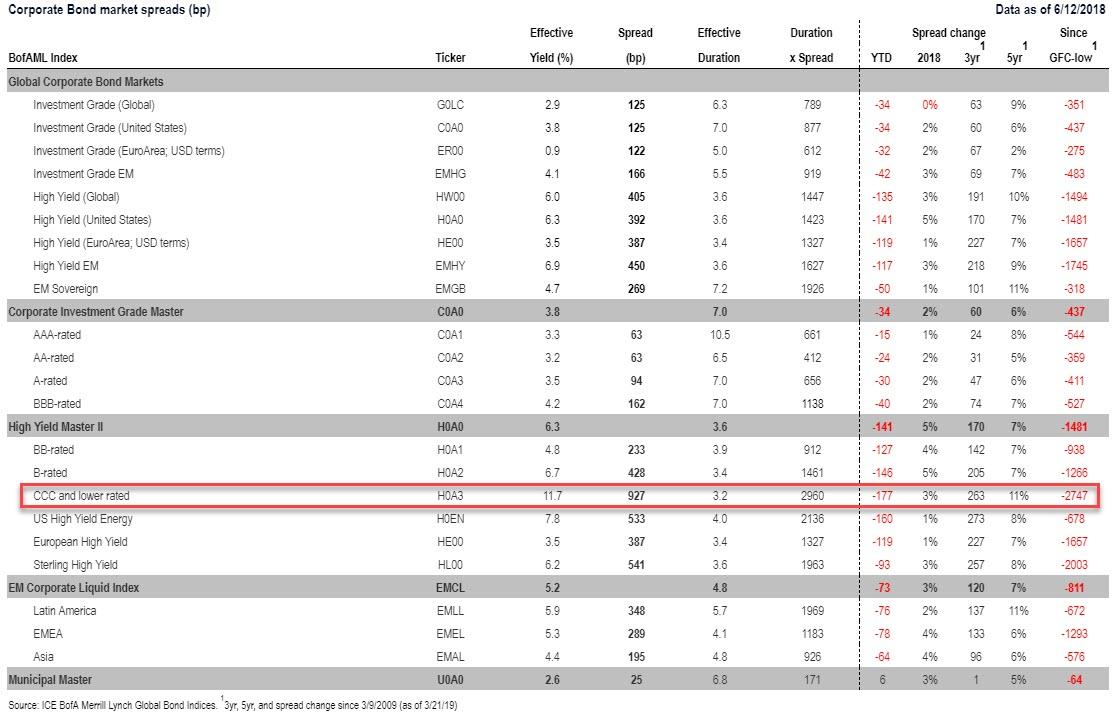
7. 2747bps: the staggering drop in US CCC High Yield bond spreads since 2009
8. 2018: 1st year since 2000 that cash outperformed bonds and stocks
This table shows global cross-asset total returns since 2000, in USD terms. Annualized asset returns since QE began in 2009: US stocks 15%, global HY bonds 12%, Treasuries 2%, cash 0%, commodities -1%. In 2018, cash outperformed bonds and stocks for the first time since 2000.
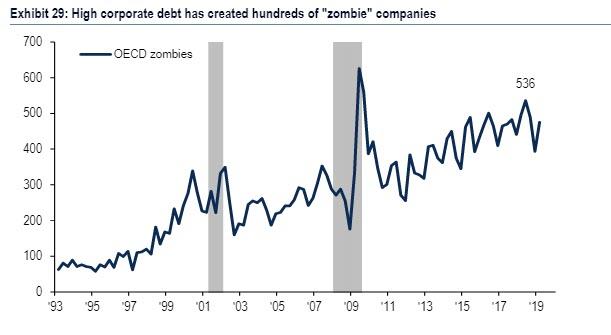
9. 536: the number of zombie companies in the world, 13% of total
Ominously, low interest rates and the ability of lower-rated companies to issue debt has led to a rise in the number of “zombie” companies, i.e. companies that are extremely indebted and are unable to stay on their feet without the current backdrop of historically low interest rates. In 2018, the number of “zombie” companies, defined as companies with profits (EBIT) less than interest payments totaled 536, not far off the highs seen during the Global Financial Crisis (626).
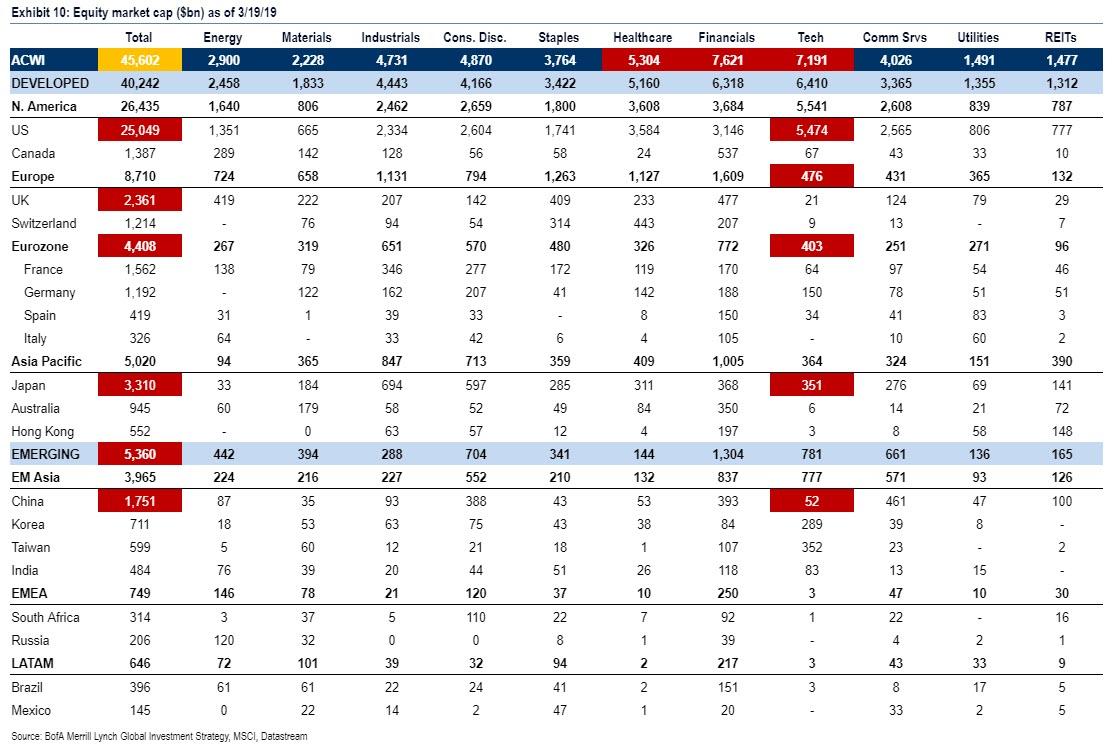
10. $5.5tn: market cap of US tech sector, >entire market cap of Emerging Markets
he second tech bubble: US tech is now by far the biggest individual sector in the global stock market at $5.5tn market cap, larger than all EM stocks ($5.4tn) and Eurozone stocks ($4.4tn); and 3x the size of all other tech sectors combined.
The second largest equity market, Japan, is almost 8x smaller ($3.3tn) than the US ($25.0tn). Financials ($7.6tn) remain the largest outright global sector but now only account for 16.7% of global stocks, well below their prior peak of 26.1% in Jan’07.
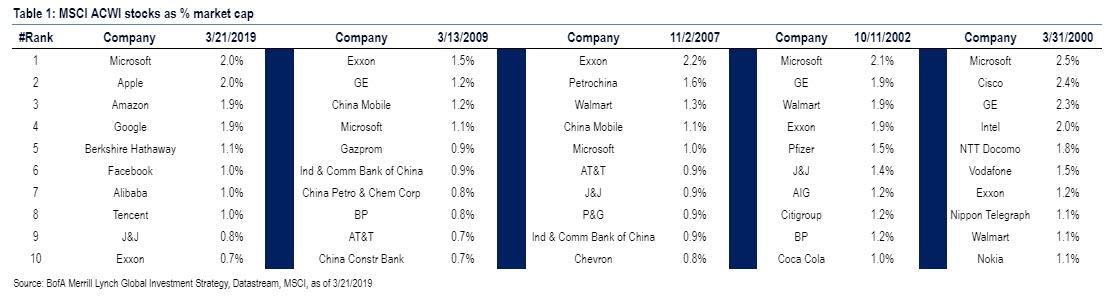
US tech companies account for 5 of the 7 largest companies in the world by market capitalization, and 7 of the top 10 companies in the world are tech companies. Microsoft is the only company to feature in the top 10 stocks throughout the 21st century.
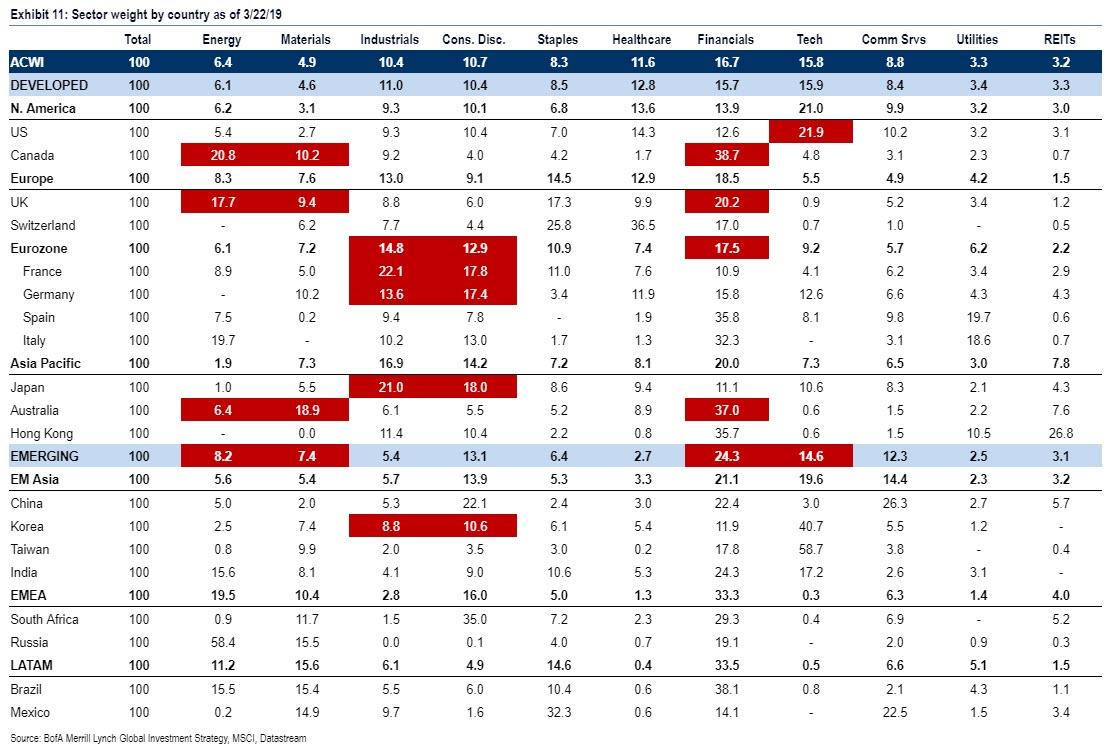
11. 1/3: financials as % market cap >1/3 in Canada, Spain, Italy, Australia, Brazil
Tech (14%) now plays a substantial role in Emerging Markets, but the financial sector (24%) is the main driver of EM; this is a major change from 2008 when energy & resources represented 36% of the EM index. As a result, the catalyst for EM to outperform has shifted from commodity prices to global rates. Eurozone equities are highly cyclical and disproportionately reliant on financials, notably Italy (32%) and Spain (36%). The Eurozone’s next structural bull market awaits the end of the current era of negative interest rates.
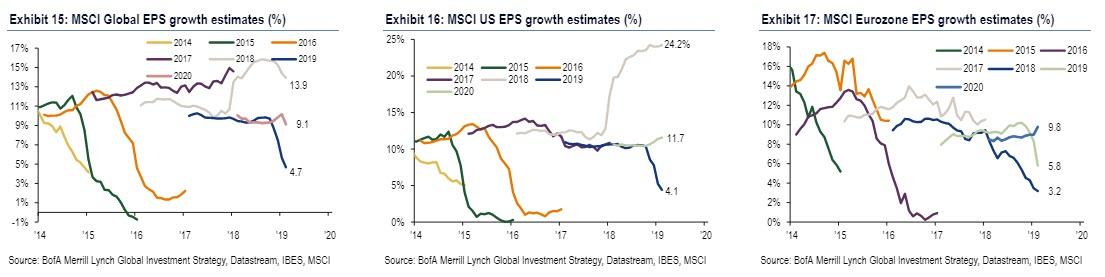
12. 4%: Global EPS growth forecast in 2019, down from 24% in 2018
The US economic cycle is set to become the longest in history in July 2019; but US, Eurozone & Chinese growth has repeatedly struggled to exceed expectations. The inability of economic growth to hit “escape velocity” helps explains why global profits have consistently missed expectations, most notably in Europe. Years of big upside surprises to EPS have typically been the results of one-off policy interventions, for example the 2018 US tax cuts.
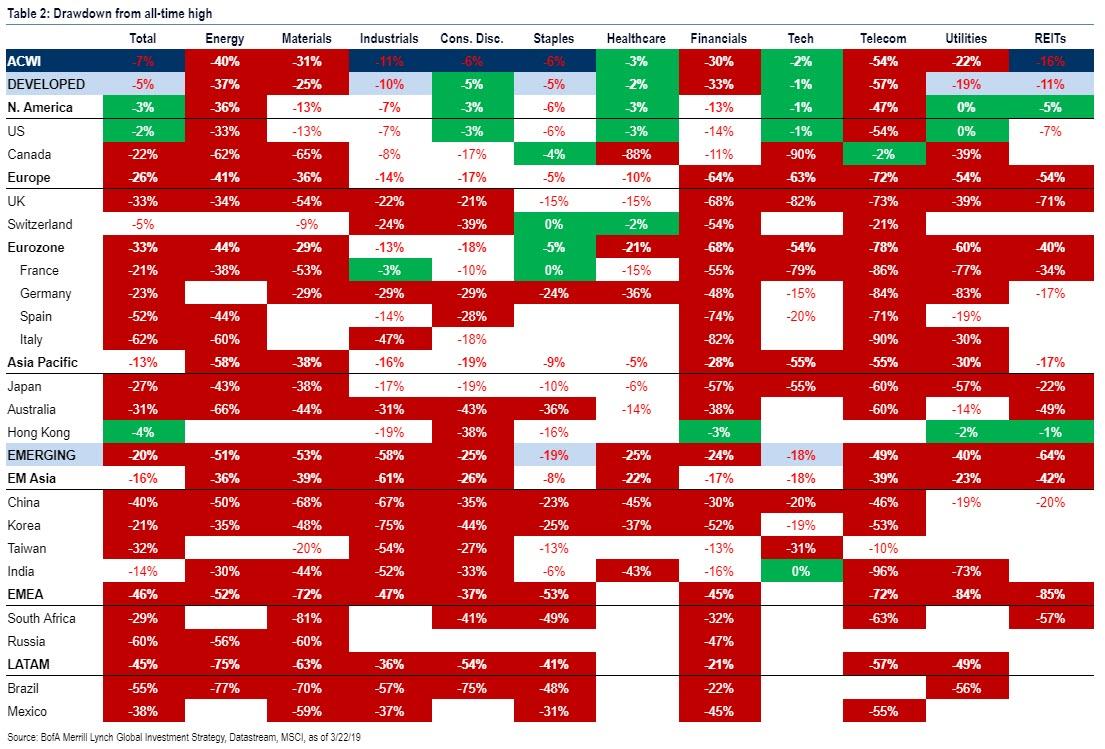
13. 3498: the level at which the S&P 500 bull market becomes the biggest ever
This chart shows how far equities are from their all-time highs, in US dollar (green = <5% from high, white = 5-20% from high, red = >20% from high). US equity market -3% from all-time high; stark contrast to Japan (27% from high), Eurozone (33%), China (40%), Spain (52%), Italy (62%).
14. 68%: the rise in stock price needed for Eurozone banks to reach old highs
Of particular note, Eurozone banks are still 67% off their all-time highs, Korean industrials 75%, Italian financials 82%, South African materials 81%.
15. 67%: the % of the global equity market >20% away from its all-time high
10 years into the bull market, only 9% indices within 5% of all-time highs, 24% are within 20% and a 67% in “bear markets”, i.e. >20% away from highs.
16. 17bps: the CDS of the “safest” company in the world, Nestle
These tables show the largest 25 companies, ranked by market cap & credit default swap spreads, as well as the most creditworthy countries. Nestle is the creditworthy mega cap in financial markets (CDS = 17bp), Alibaba the least (CDS = 84bp). Switzerland (12bp) overtook Germany (13bp) as the most creditworthy country in May 2018; the least is Venezuela (7760bp, peak was 15559bp in Nov’17). US & European most creditworthy sectors = European & US IG healthcare; least = European discretionary HY, US staples HY (Bloomberg).
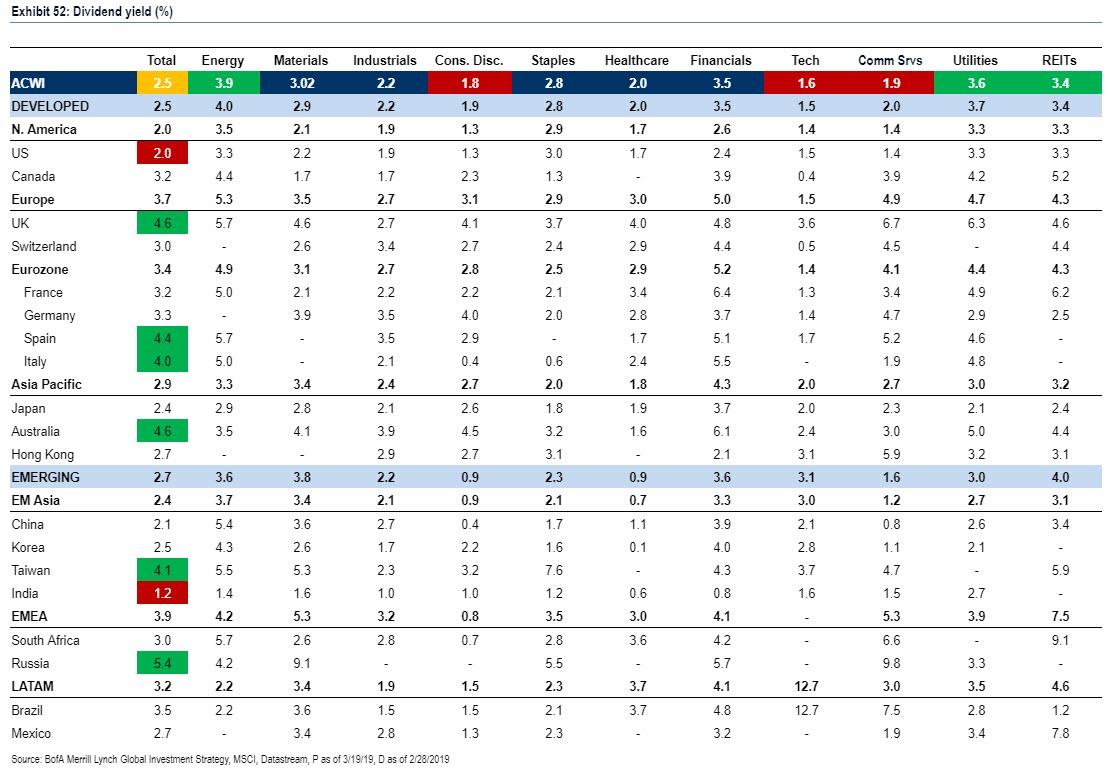
17. 2.5%: dividend yield of global equity index, below its historic average of 2.9%
This table shows dividend yields around the world: it shows that global equities currently yield 2.5%. Dividend yields in excess of 3.5% (cheap) can be found in Russia, Australia, UK, Spain, Italy, Taiwan, energy, utilities, REITs. Dividend yields below 2% (expensive): India, US, tech, discretionary, communications.
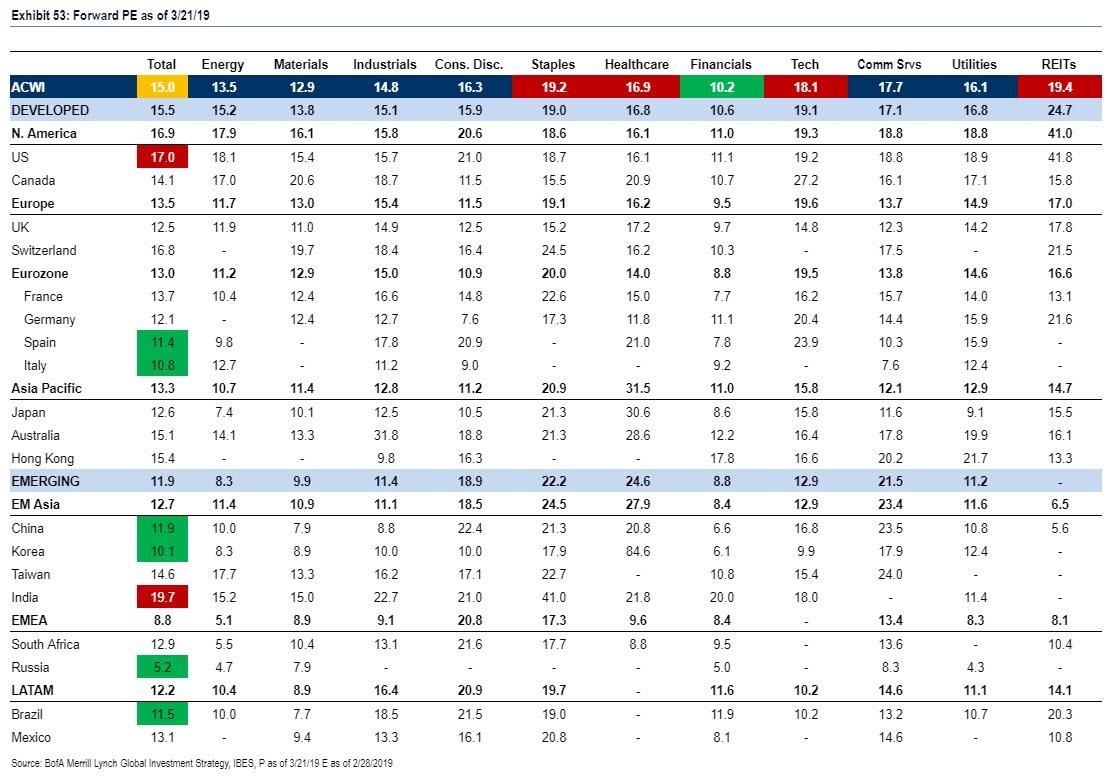
18. 15X: price-earnings ratio of the global equity index, below its 15.7X average
This table shows price/earnings ratios based on 12-month forward earnings. Global equities are currently trading on a forward P/E multiple of 15.0x. P/E multiples above 17x (expensive): India, US, REITs, staples, tech, healthcare. P/E multiples below 12x (cheap): Russia, Korea, Italy, Brazil, Spain, China, financials.
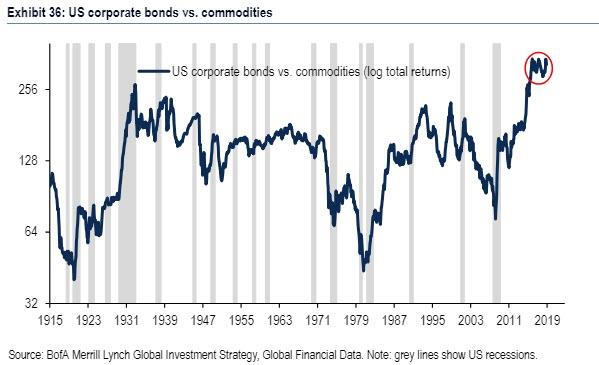
19. 100: corporate bond prices relative to commodity prices close to 100-year high
This chart shows the performance of US corporate bonds vs. commodities in the past 100 years. US corporate bonds hit an all-time high versus commodities in June 2017, exceeding the prior high set during the Great Depression in 1933; they remain close to that high today.
20. 2002: last time commodities best performing asset class (as they are in 2019)
via ZeroHedge News https://ift.tt/2COxYBI Tyler Durden
With far left candidates and policies on the rise in America, it’s no surprise that for the first time ever, more young people say they’d prefer to live in a socialist country over a capitalist one.
Whether it’s free healthcare, free college tuition, or universal basic income, students around America increasingly support higher taxes on the wealthy in order to pay for these progressive policies. But would they support similar policies if they had skin in the game?
To find out, Campus Reform‘s Cabot Phillips went to Florida International University in Miami to test the waters on a “Socialist GPA” policy in which students with higher GPAs would be forced to “spread the wealth” and give some of their GPA points to students with lower GPAs.
Despite the overwhelming number of students who initially said they’d support socialist policies, few agreed to go along with such a plan.
“I’m all for helping, but I wouldn’t give some of my points… I’ve lost a lot of sleep so I don’t know if that would be fair,” one student said…
…while another answered no because “I like, study all day for my grades.”
Yet another student, after expressing her support for socialism in America conceded, “I guess it would be kind of hypocritical for me to say no.”
Another student, trying to justify his refusal to abide by such a policy, said, “you study for your grades, and they reflect how much time you’re studying.”
What did the rest of the students have to say when asked why it was any different when it came to spreading the financial wealth?
WATCH:
via ZeroHedge News https://ift.tt/2CHhM59 Tyler Durden
Days after Trump’s Secretary of State Mike Pompeo demanded that Russia “cease its unconstructive behavior” by landing a transport plane full of Russian troops in Caracas last Saturday, the Kremlin has responded – essentially telling Washington to pound sand – and that their troops will remain in Venezuela “for as long as needed” according to the Independent.
In the latest indication the crisis in Venezuela is taking on elements of a proxy battle between the former Cold War rivals, a spokeswoman for Russia’s foreign ministry said the troops had been dispatched to fulfil “military contracts”.
“They are involved in the implementation of agreements in the sphere of military and technical cooperation,” said Maria Zakharova, according to the AFP, adding that the troops would stay there “for as long as needed”.
“Russia is not changing the balance of power in the region, Russia is not threatening anyone,” she said. –Independent
Last week we also noted that new satellite images reveal a major deployment of S-300 air defense missile systems to a key air base south of Caracas shortly after Russia arrived.
On Wednesday while meeting with the wife of opposition leader Juan Guaidó, President Trump called on Russia to pull its troops out of Venezuela, warning that “all options” were on the table to make that happen.
When asked by a reporter about the Russian troops, Trump said “Russia has to get out. What’s your next question.” When asked if that sentiment had been conveyed to the Kremlin, Trump replied: “They know. They know very well.”
President Trump, aka Putin’s puppet, on Venezuela: “Russia has to get out.” | pic.twitter.com/dIUgw2xdKO
The United States, UK and other Western nations claim that last year’s elections in Venezuela were unfair, while President Maduro and his supporters have pointed to the testimony of independent election observers who say it was legitimate. Guaidó declared himself president in January, finding the immediate support of 50 nations led by the United States.
Maduro, meanwhile, has refused to accept Western aid – suspecting it will be used as a guise to smuggle weapons to the opposition.
Last month, Mr Maduro refused to allow US aid into the country, pointing to previous incidents in Latin America when the US had smuggled weapons to anti-government forces in such shipments. His country has been working with the UN to increase the distribution of food and other supplies, amid claims of shortages of basic necessities.
On Thursday, Reuters said an internal UN report suggested about a quarter of Venezuelans were in need of humanitarian assistance.
The report painted a dire picture and estimated 94 per cent of its 28.8m people were living in poverty. It said 3.4m people had fled, with a further 1.9m expected to follow in this year. –Independent
More recently, Maduro blamed the United States for a series of power outages, claiming over Twitter that the Trump administration was engaged in an “electrical war” which was “announced and directed by American imperialism against our people.”
via ZeroHedge News https://ift.tt/2FMWrcA Tyler Durden
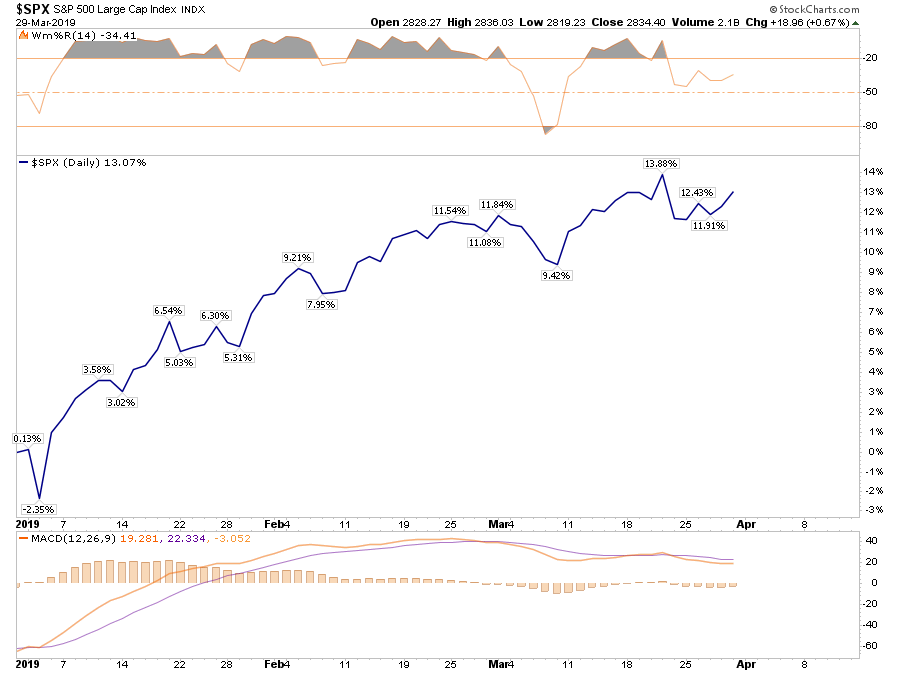
Friday wrapped up the first quarter of 2019, and it was the best quarterly performance since 2009. As shown in the chart below, if you bought the bottom, you are “killing it.”
However, you didn’t.
Despite all of the media “hoopla” about the rally, the reality is that for most, they are simply getting back to even over the last year.
That is, assuming you didn’t “sell the bottom” in December, which by looking at allocation changes, certainly appears to be the case for many.
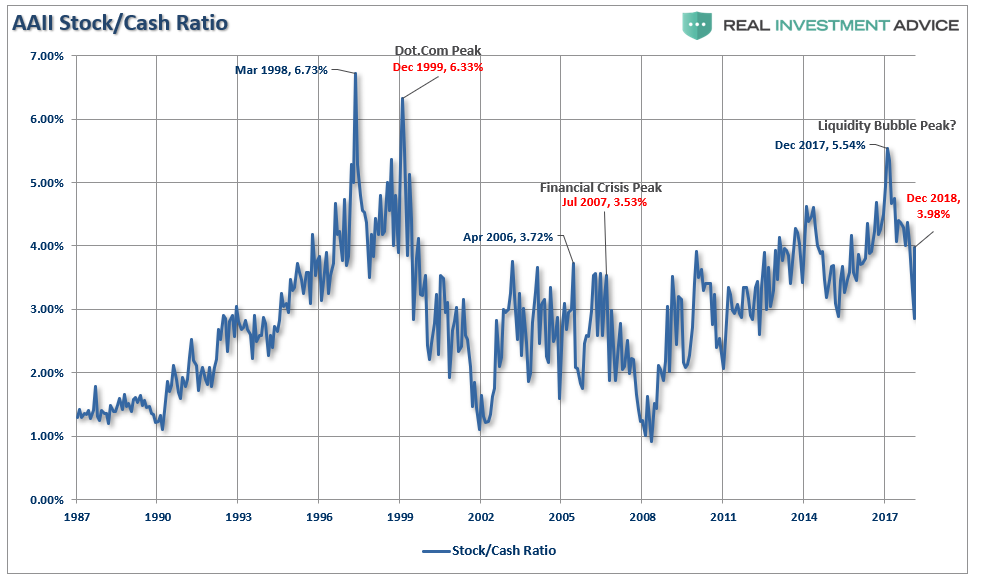
If we deconstruct the ratio we can see the rotation a bit better
Not surprisingly, historically speaking, investors had their peak stock exposure before the market cycle peak. As the market had its first stumble, investors sold. When the market bounces, investors are initially reluctant to chase it. However, as the rally continues, the “fear of missing out or F.O.M.O” eventually forces them back into the market. This is how bear market rallies work; they inflict the most pain possible on investors both on the bounce and then on the way back down.
However, for the moment, we are still in the midst of a bear market rally. This will be the case until the market breaks out to new highs. Only then can we confirm the previous consolidation is complete and the bull market has been re-established.
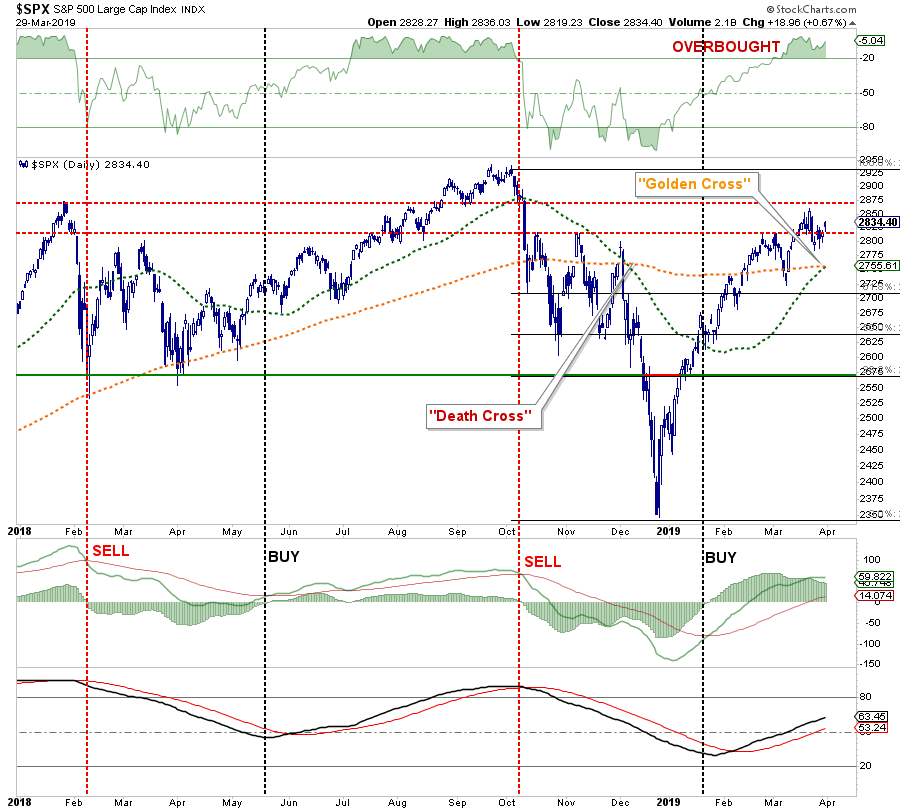
The good news is on a very short-term basis, the market IS INDEED bullishly biased and coming off an extremely strong first quarter rally. The current momentum of the market is strong as bullish optimism has regained a foothold.
But, as we noted for our RIA PRO Subscribers last week, (Free 30-Day Trial with Code: PRO30) complacency has moved back to extremes which suggests that a further rally isn’t “risk free.”
“The graph below is constructed by normalizing VIX (equity volatility), MOVE (bond volatility) and CVIX (US dollar volatility) and then aggregating the results into an equal-weighted index. The y-axis denotes the percentage of time that the same or lower levels of aggregated volatility occurred since 2010. For instance, the current level is 1.91%, meaning that only 1.91% of readings registered at a lower level.
“Beyond the very low level of volatility across the three major asset classes, there are two other takeaways worth pondering.
The peak -to- trough -to- peak cycle over the last year was measured in months not years as was the case before 2018.
Secondly, when the index reached current low levels in the past, a surge in volatility occurred soon after that. This does not mean the index will bounce higher immediately, but it does mean we should expect a much higher level of volatility over the next few months.”
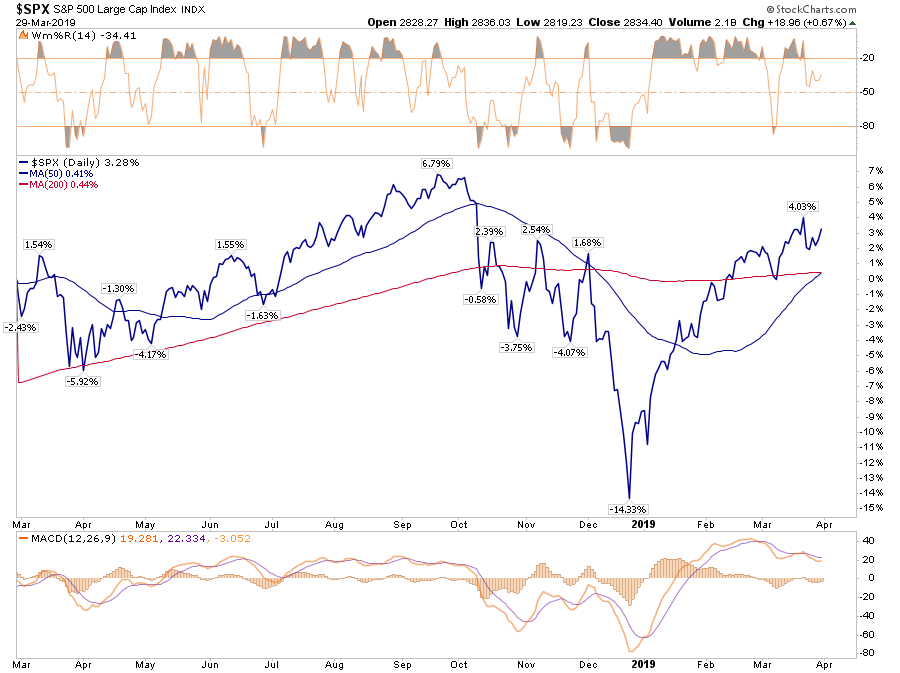
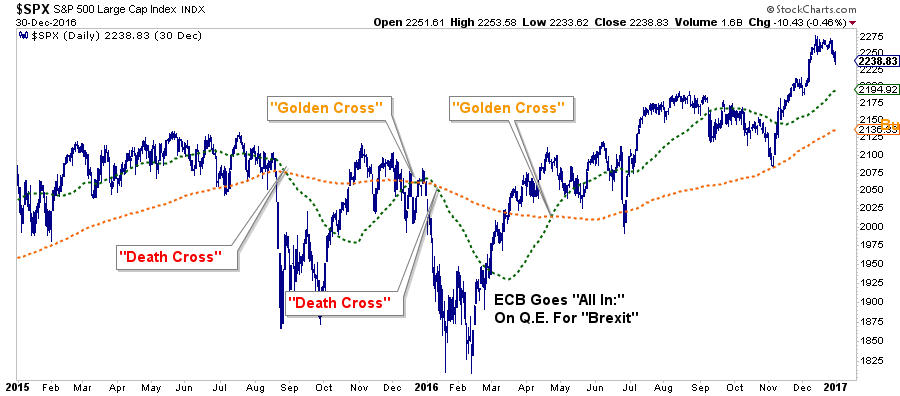
Nonetheless, the markets are close to registering a “golden cross.” This is some of that technical “voodoo” where the 50-day moving average (dma) crosses above the longer-term 200-dma. This “cross” provides substantial support for stocks at that level and limits downside risk to some degree in the short-term.
Over the next couple of weeks, you are going to see a LOT of commentary about “the Golden Cross” buy signal and why this means the “bull market” is officially back in action. While “golden crosses” are indeed bullish for the markets, they are not an infallible signal. The chart below shows the 2015-2016 market where investors were whipsawed over a 6-month period before massive Central Bank interventions got the markets back on track.
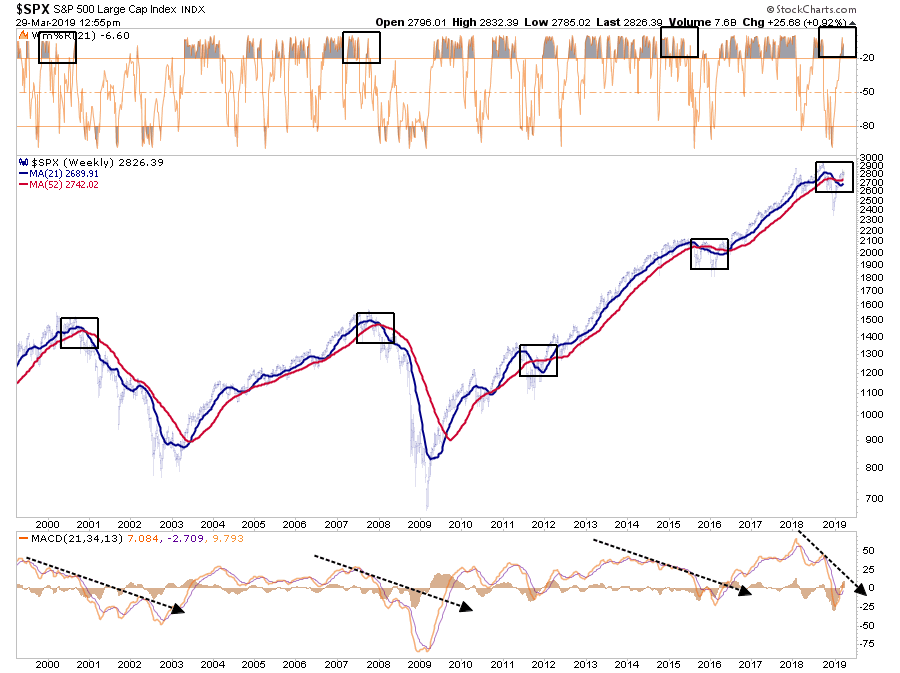
The next chart shows the longer-term version of the chart above using WEEKLY data. The parameters are set for a slightly longer time frame to reduce the number of “false” indications. I have accentuated the moving averages to have them more clearly show the crosses.
The one thing that you should notice is the negative “cross over” is still intact AND it is doing so in conjunction with an extreme overbought weekly condition and a “negatively diverging” moving average divergence/convergence (MACD) indicator. This combined set of “signals” has only been seen in conjunction with the previous market peaks.(As noted, the corrections of 2012 and 2015-16 were offset by massive amounts of Central Bank interventions which are not present currently.)
From a portfolio management standpoint, what should you do?
In the short-term the market remains bullishly biased and suggests, with a couple of months to go in the “seasonally strong” period of the year, that downside risk is somewhat limited.
Therefore, our portfolio allocations:
Remain long-biased towards equity risk
Have a balance between offensive and defensive sector positioning
Are tactically positioned for a trade resolution (which we will sell into the occurrence of.)
However, the analysis also keeps us cautious with respect to the longer-term outlook. With the recent inversion of the yield curve, deteriorating economic data, and weaker earnings prospects going forward, we are focused on risk management and capital controls. As such we are:
Continuing to carry slightly higher levels of cash
Overweight bonds
Have some historically defensive positioning in portfolios.
Continue to tighten-up stop-loss levels to protect gains, and;
Have outright hedges ready to implement when needed.
Ignore The Yield Curve…They Said
In the World War II real-time strategy (RTS) game Company of Heroes, released on September 12th, 2006, the engineer squad would sometimes say:
“Join the army they said. It’ll be fun they said.”
Since then, the statement has become a common meme on the internet to espouse the disappointment derived from various actions from doing the laundry to getting a job.
Well, the latest suggested action, which will ultimately lead to investor disappointment, is:
“Ignore the yield curve they said. It’ll be fun they said.”
“Historically, equity markets tended to produce some of the strongest returns in the months and quarters following an inversion. Only after [around] 30 months does the S&P 500 return drop below average,”
While the statement is not incorrect, it is advice that will ultimately lead to disappointment.
In 1998, for example, as the bull market was running hot. There was “no recession in sight,” and investors were repeatedly advised to ignore the yield curve because “this time was different.”
After all, at that moment in history, it was perceived to be a “new paradigm.” The internet was changing the world and making old metrics, like earnings, relics of the past. It was even suggested at the time that “investing like Warren Buffett was like driving Dad’s old Pontiac.”
Over the next two years, that advice held true as bullish optimism seemed well founded. It was in early 2000 that Jim Cramer issued his Top 10-Stock Picks for the next decade.
The problem is that no one ever said “sell.”
While it was great that gains were made during the period between the initial yield curve inversion and the peak of the market, all of those gains, plus much more, were wiped out in the ensuing decline. Values in portfolios were returned to where they were roughly a decade earlier by the time the decline was officially over.
Since the majority of mainstream financial advice never suggest selling, investors had no clue that if they had gone to cash in 1998, they saved themselves both a lot of grief and years of losses needing to be recovered.
It was just an anomaly.
That was the belief at the time. Following the “Dot.com” crash, the entire tragic event was considered an anomaly; a once-in-a-100-year event which would not be replicated anytime again soon.
But just 4-years later, in 2006, investors were once again told to ignore the yield curve inversion as it was a “Goldilocks economy” and “sub-prime mortgages were contained.” While many of the individuals who had told you to stay invested leading up to 2000 peak were mostly gone from the industry, a whole new crop of media gurus and advisors once again told investors to “ignore the yield curve.”
For a second time, had investors just sold when the yield curve inverted, the amount of damage that would have avoided more than paid off for the small amount of gains missed as the market cycle peaked.
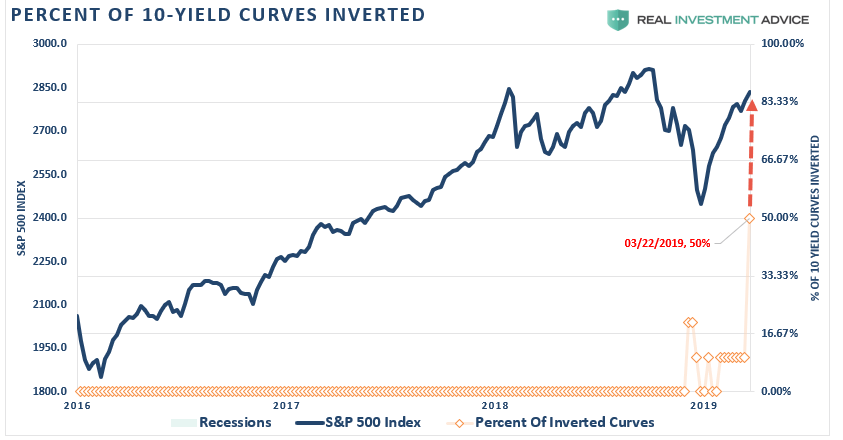
This quad-panel chart below shows the 4-previous periods where 50% of 10-different yield curves were inverted. I have drawn a horizontal red dashed line from the first point where 50% of the 10-yield curves we track inverted. I have also denoted the point where you should have sold and the subsequent low.
As you can see, in every case, the market did rally a bit after the initial reversion. However, had you reduced your equity-related risk, not only did you bypass a lot of market volatility (which would have led to investor mistakes anyway) but ended up better off than those trying to just ride it out.
That’s just history
Oh, as we noted last week, we just hit the 50% mark of inversions on the 10-spreads we track.
This time is unlikely to be different.
More importantly, with economic growth running at less than 1/2 the rate of the previous two periods, it will take less than half the amount of time for the economy to slip into recession.
While I am not suggesting you sell everything and go to cash today, history is pretty clear that you will likely not miss much if you did.
What Can You Do?
I don’t disagree that the markets could certainly rise from here, in the short-term. I answered this question last week:
“Are we going to hit new highs you think, or is this a setup for the real correction?”
The answer is “yes” to both parts.
The mainstream media’s advice is simply:
“Since you don’t know when a bear market will start, you just have to ride it out.”
This is the problem with the mainstream media and the majority of the financial advice in the world today.
It is not required that you know precisely when one market cycle ends and another begins.
Investing isn’t a competition. It is simply a game of survival over the long-term. While it is critically important we grow wealth while markets are rising, it is NOT a requirement to obtain every last incremental bit of gain there is. Staying too long at the poker table is how you leave broke.
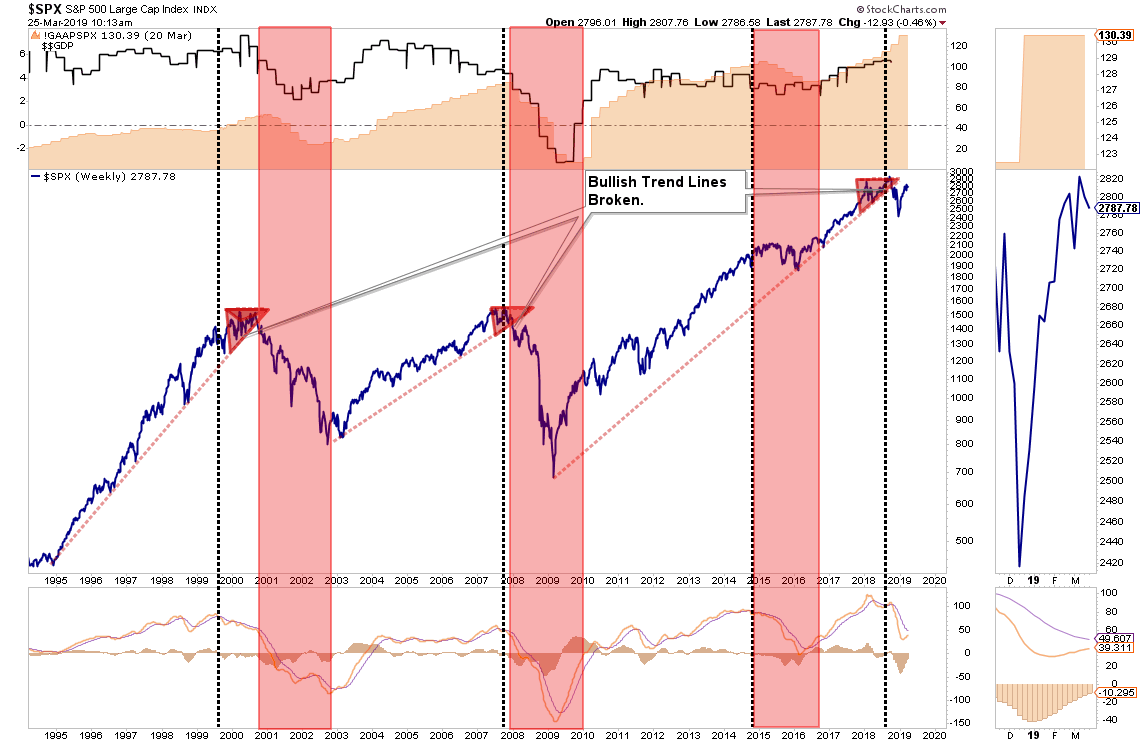
There are three important things worth pointing out:
The top panel is GAAP earnings (what companies REALLY earn) and nominal GDP.
The black vertical line is when the markets begin to “sniff out” something is not quite right.
The red bars are when “expectations” are disappointed.
Pay attention to these longer-term trend changes as historically they signify bigger issues with the market.
It is unlikely this time is different. There are too many indicators already suggesting higher rates are impacting interest rate sensitive, and economically important, areas of the economy. The only issue is when investors recognize the obvious and sell in the anticipation of a market decline.
The yield curve is clearly sending a message which shouldn’t be ignored and it is a good bet that “risk-based”investors will likely act sooner rather than later. Of course, it is simply the contraction in liquidity that causes the decline which will eventually exacerbates the economic contraction. Importantly, since recessions are only identified in hindsight when current data is negatively revised in the future, it won’t become “obvious” the yield curve was sending the correct message until far too late to be useful.
While it is unwise to use the “yield curve” as a “market timing” tool, it is just as unwise to completely dismiss the message it is currently sending.
via ZeroHedge News https://ift.tt/2FO8qH6 Tyler Durden
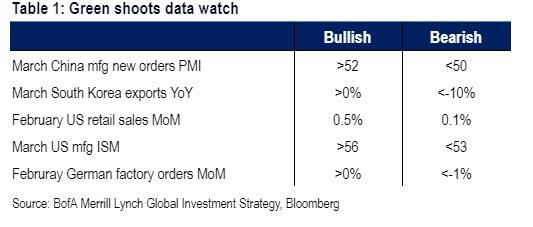
In previewing the “green shoots” catalysts to watch for the second quarter after a dismal, for the economy Q1, BofA’s Michael Hartnett listed five key data points which will set the quarterly mood early, and which included US retail sales and manufacturing ISM, South Korean export orders, February German factory orders and, last but not least, China’s manufacturing new orders PMI
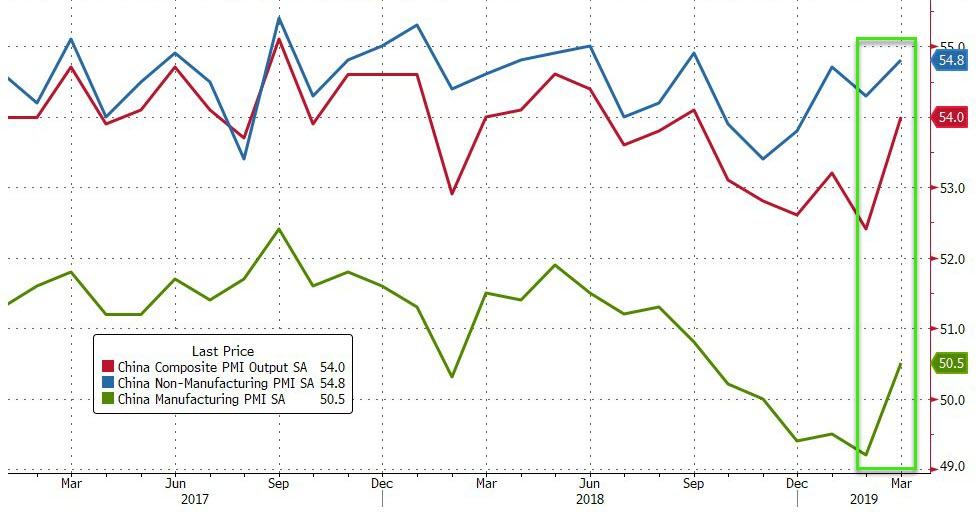
Well, overnight we got the last one when China confirmed prior speculation of a rebound in the economy, when the National Bureau of Statistics reported that China’s manufacturing PMI rebounded strongly from a contractionary 49.2, and printing at 50.5, its first expansion since September 2018, and beating estimates of a 49.6 reading. The non-manufacturing PMI continued its recent improvement, rising to 54.8, also the best reading since last September, as both the services and construction PMIs strengthened, and resulted in the composite PMI rising to 54.0 from 52.4.
Almost all major sub-indexes imply better growth momentum.
While the production index was 3.2% higher at 52.7, the new orders sub-index was 1.0% higher at 51.6, just why of Hartnett’s 52.0 bullish “green shoot” cutoff. The employment sub-index edged up 0.1% to 47.6 from 47.5.
More importantly, trade indicators also strengthened – the imports sub-index rose to 48.7 from 44.8, and the new export order went up to 47.1, vs. 45.1 in February. Both trade-related indexes have recovered from the bottom seen in late 2018 and early 2019, but are still below the levels in 2017/early 2018.
Inventory indicators also rose with the raw material inventories index 2.1% higher at 48.4, and the finished goods inventory index increased by 0.6pp in March to 47.0 (both indicators remain below their long-term averages).
Price indicators continued to climb – the input price index rose by 1.6% to 53.5, and the output price index was 2.9% higher at 51.4. By enterprise type, data suggest manufacturing PMI went up for medium and small-sized manufacturing enterprises in March and declined for large manufacturing enterprises.
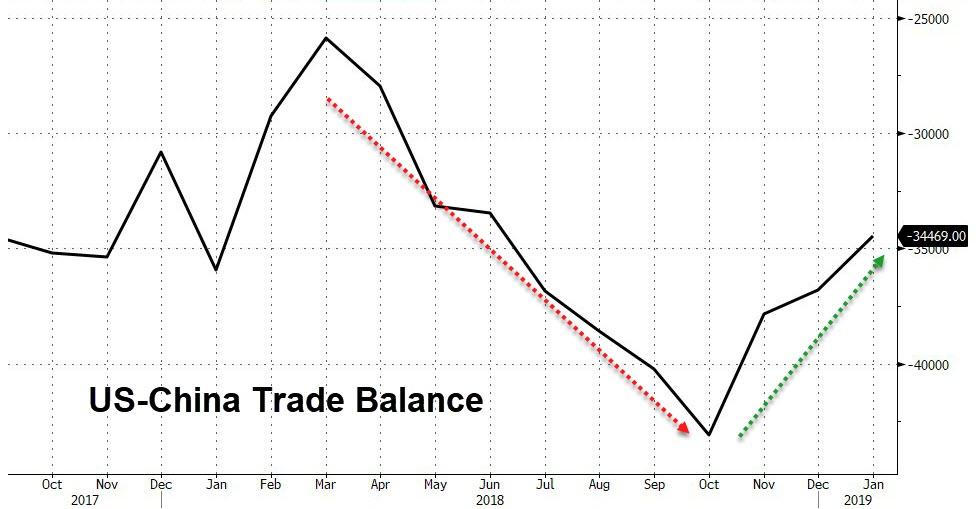
Curiously, the improvement in trade indicators took place even as China’s record trade surplus with the US faded in recent months:
The official non-manufacturing PMI (which according to Goldman Sachs estimates is comprised of the service and construction sectors at roughly 80%/20% weightings) also increased to 54.8 in March vs 54.3 in February. Both services and construction PMIs strengthened. The services PMI edged up by 0.1% to 53.6, and the construction PMI increased 2.5% to 61.7.
What prompted the rebound in the PMI? after an unprecedented credit injection earlier in the year, in addition to better underlying growth momentum, higher commodity prices and Chinese New Year holiday seasonality may have contributed to the rebound according to Goldman Sachs which sees a few factors contributing to a higher manufacturing PMI in March:
higher commodity prices rose in March which could add upward bias to the manufacturing PMI readings;
activities resuming after the Chinese New Year holiday could also push up manufacturing PMI in March vs February – in historical years when the Chinese New Year date was similar to this year, March NBS manufacturing PMI rebounded by an average of 1.7% vs February;
underlying growth momentum may have also improved as the previous policy easing started to show its support to overall economic growth.
On the non-manufacturing side, construction PMI was stronger partially due to the Chinese New Year seasonality, and partially also supported by stronger infrastructure investment activities. Services PMI also improved – logistics, transportation and securities industry activities were strong in March, while real estate activities stayed weak. In sum, NBS PMI data suggest better growth in Q1 compared with Q4 last year.
Whatever the reason behind the rebound, much of its has already been priced in with the Shanghai Composite, the year’s best performing major index, posting nearly double the return of the S&P in the first quarter.
More importantly, with China’s PMI now signalling an key inflection point for both the Chinese and global economy, and the early stages of an economic rebound, the Sunday print will likely serve to push Asian stocks sharply higher on the first day of the quarter.
But the biggest implication from the rebound in Chinese data, is what implications it may have on the ongoing US-China trade negotiations, because as the Global Times’ Editor in Chief wrote overnight, the Chinese are now “less worried” about the trade war, as “they feel the US is not as powerful as they had thought and the impact the trade war has on their life is not that big. This will seriously weaken psychological advantage of US side in trade talks.”
One year since the trade war started, the Chinese have been less worried about it. They feel the US is not as powerful as they had thought and the impact the trade war has on their life is not that big. This will seriously weaken psychological advantage of US side in trade talks.
To be sure, the (goalseeked) Chinese data will be used by Beijing as a bargaining chip to make more forceful demands in bilateral trade negotiations, as it can now asset that the worst consequences of the trade war are now in the rearview mirror, and as a result US leverage over China’s economy is now declining.
via ZeroHedge News https://ift.tt/2U54dqY Tyler Durden
Frustrated Brits are getting jerked around by the ham-handed rollout of the UK’s new porn blocks, which would ban anyone from watching porn until they verify that they’re an adult, according to the Independent.
The new ban has been in the works for over a year, however internal confusion over how it should be implemented has resulted in confusion and delay.
Rumours had swirled in recent weeks that the blocks could be imminent, after a series of newspapers suggested that the ban would be introduced on 1 April. But that date had never been confirmed, and appears to have emerged amid complete confusion about when they would actually be introduced. –Independent
The new rules mandate that adults prove their age via an over-the-counter card they can purchase from a shop, or uploading their ID online.
Digital Minister Margot James said last year that the age verification rules would be in force by Easter of this year.
“Age verification measures, urgently needed to help prevent children being exposed to harmful and inappropriate content, need to be brought in as soon as possible,” said Javed Kahn – CEO of Barnardo’s children’s charity.
“Accessing the internet in an age-appropriate way is important for children and young people, and can be a positive opportunity to learn, keep in touch with friends and have fun. But the risks of being exposed to age-sensitive and harmful content such as pornography needs to be acknowledged and addressed.”
A representative for the UK’s Safer Internet Centre explained that the complexity of the rollout is unsurprising.
“What they are actually proposing to do is quite a bit more difficult and a lot less simple than it has been reported as,” said the organization’s helpline manager, Carmel Glassbrook, who added “Nobody at the Safer Internet Centre is expecting it be a smooth and fast process at all.”
Privacy rights advocates are livid
“They’ve had over a year to get this right,” said Myles Jackman, a UK lawyer who specialises in obscenity law and sexual freedoms. “It was supposed to come into effect in April 2018 and we have consistently flagged privacy and data security issues along with free speech concerns.”
“The delays have been very much to do with the fact that privacy has been considered at the last minute and they’re having to try to find some way to make these services a bit safer,” said Jim Killock, executive director of the Open Rights Group.
“We should know all of the details of what they are proposing.”
via ZeroHedge News https://ift.tt/2UgDF5D Tyler Durden
On the 34th day of the recent government shutdown at 4 p.m., a huge cloud billowed out from Pad 39A at the Kennedy Space Center. It had been produced by a successful static test fire of the Falcon 9, which will ferry American astronauts to the International Space Station sometime in the next few months. It will be the first such flight since the retirement of the space shuttle in 2011, essentially marking an American return to manned spaceflight.
On the day of the test fire, about 95 percent of NASA’s workforce was on furlough, having been deemed non-essential to government functioning. How did NASA manage such a milestone with a skeleton crew?


 On the 34th day of the recent government shutdown at 4 p.m., a huge cloud billowed out from Pad 39A at the Kennedy Space Center. It had been produced by a successful static test fire of the Falcon 9, which will ferry American astronauts to the International Space Station sometime in the next few months. It will be the first such flight since the retirement of the space shuttle in 2011, essentially marking an American return to manned spaceflight.