Authored by Sven Henrich via NorthmanTrader.com,
Yes I am beating the drums a bit as people are getting all bullish because the next central bank rate cutting cycle is about to begin. Yesterday I outlined why things are much worse during this cycle as ever more debt has been accumulated and rate cuts are coming from the weakest rate hike cycle in history with many countries still on negative rates.

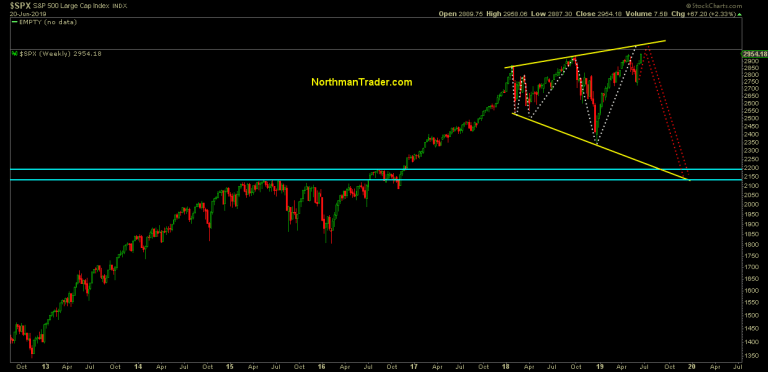
Yes, equities may still go higher on this central bank capitulation, or they may not, I’ve defined technical risk in context of this megaphone structure:
But forget all that for the moment. Why are central banks reacting? Why the talk of aninsurance cut?
I tell you why: Because recession risk is real and imminent and they know it, they just won’t say it.
Let me prove it to you with a few charts.
$SPX making new highs? Great. Guess which sector is not making new highs? Not even close?
$BKX, the banking index. Compare this performance to $SPX highs on January 2018 and you get this:
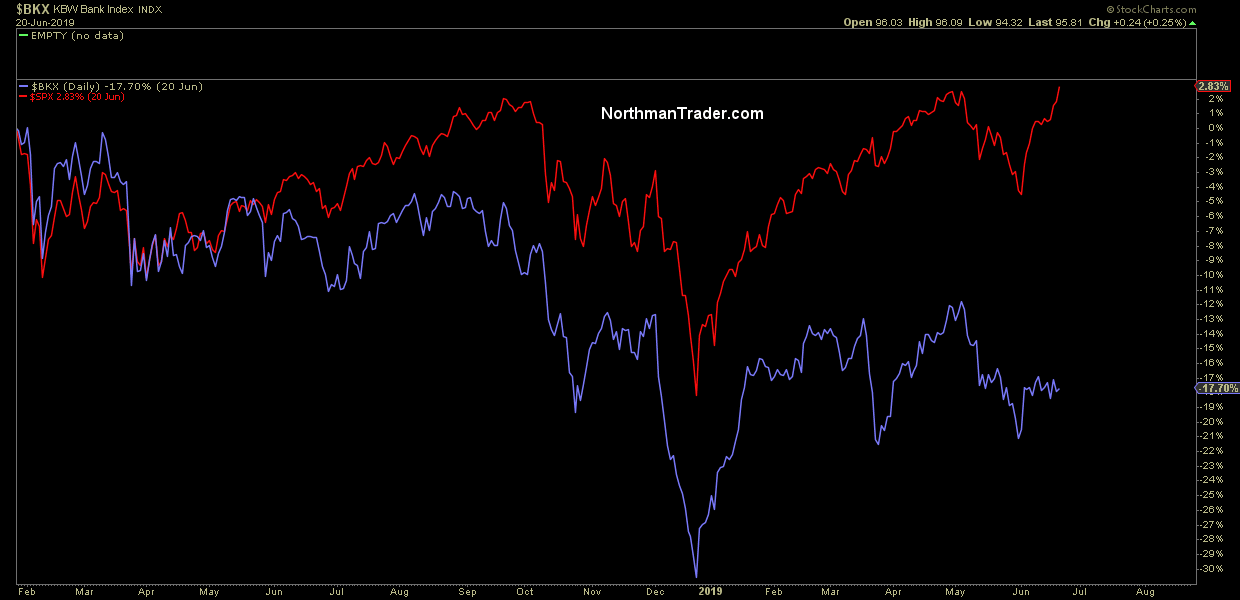
That’s a 20% difference in performance if anyone’s counting.
That a long ways away from the coordinated global growth story. Banks are reacting in part to the drop in yields. It’s the same story we’ve seen plenty before, the one that says the banking sector is sniffing out a coming recession.
Here: 1999 leading up to the March 2000 top:
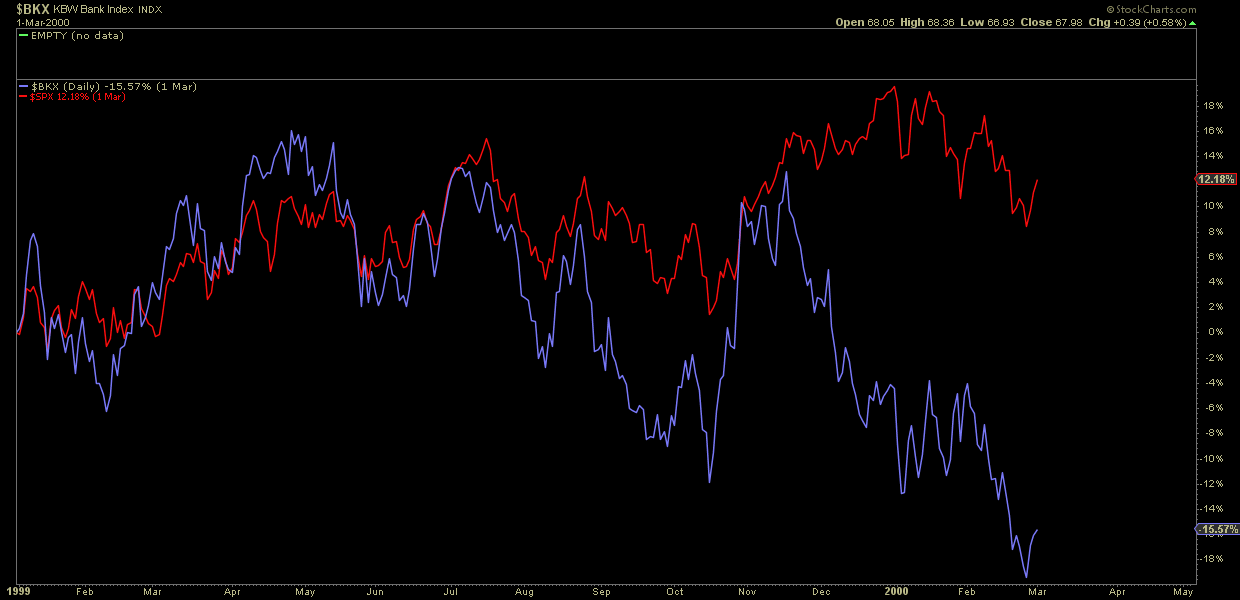
$BKX started to underperform well in advance of the final $SPX highs.
Same story in 2006-2007:
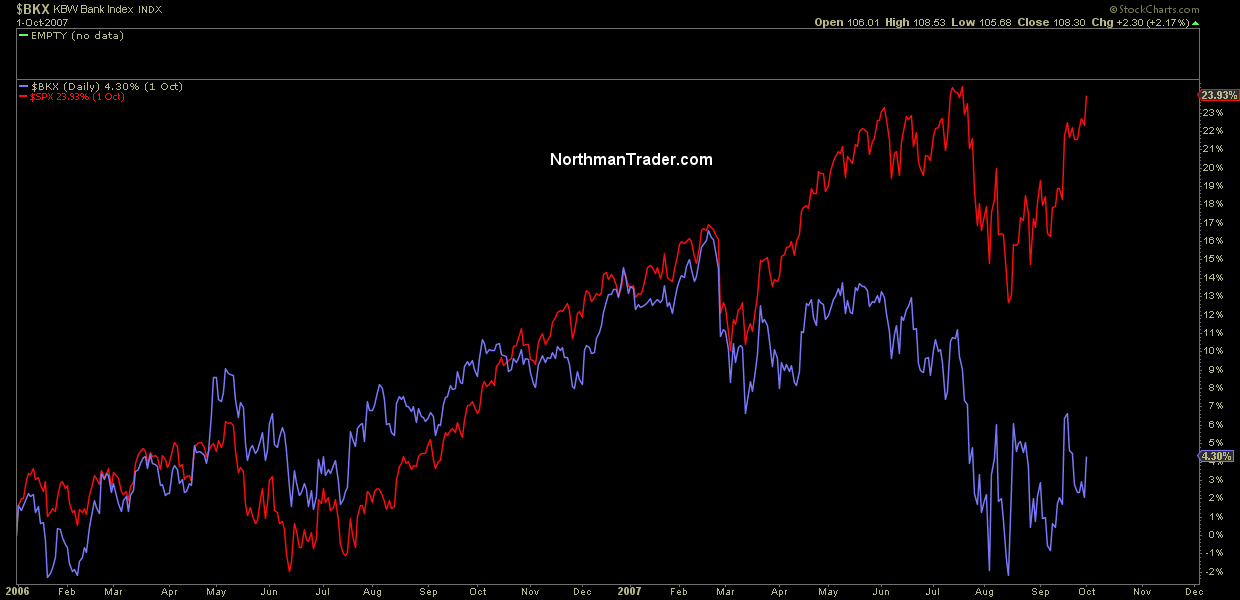
$SPX made a new all time high in October 2007, banks stayed very much behind and did not participate in the final rally to the highs.
Look familiar?
Here’s the earlier chart going back to January 1, 2018:
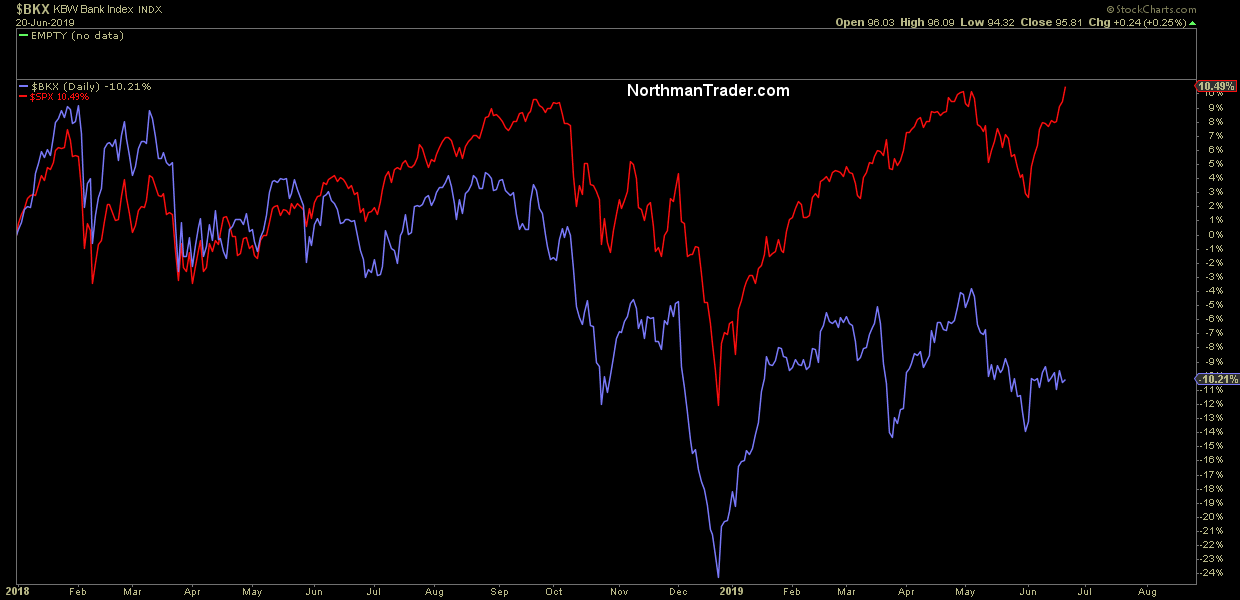
Banks haven’t even flinched during this week’s rally. I trust you spot the trend.
And guess what all these periods have in common?
Yup, yield curves heading to inversion on the 10 year/3 month:
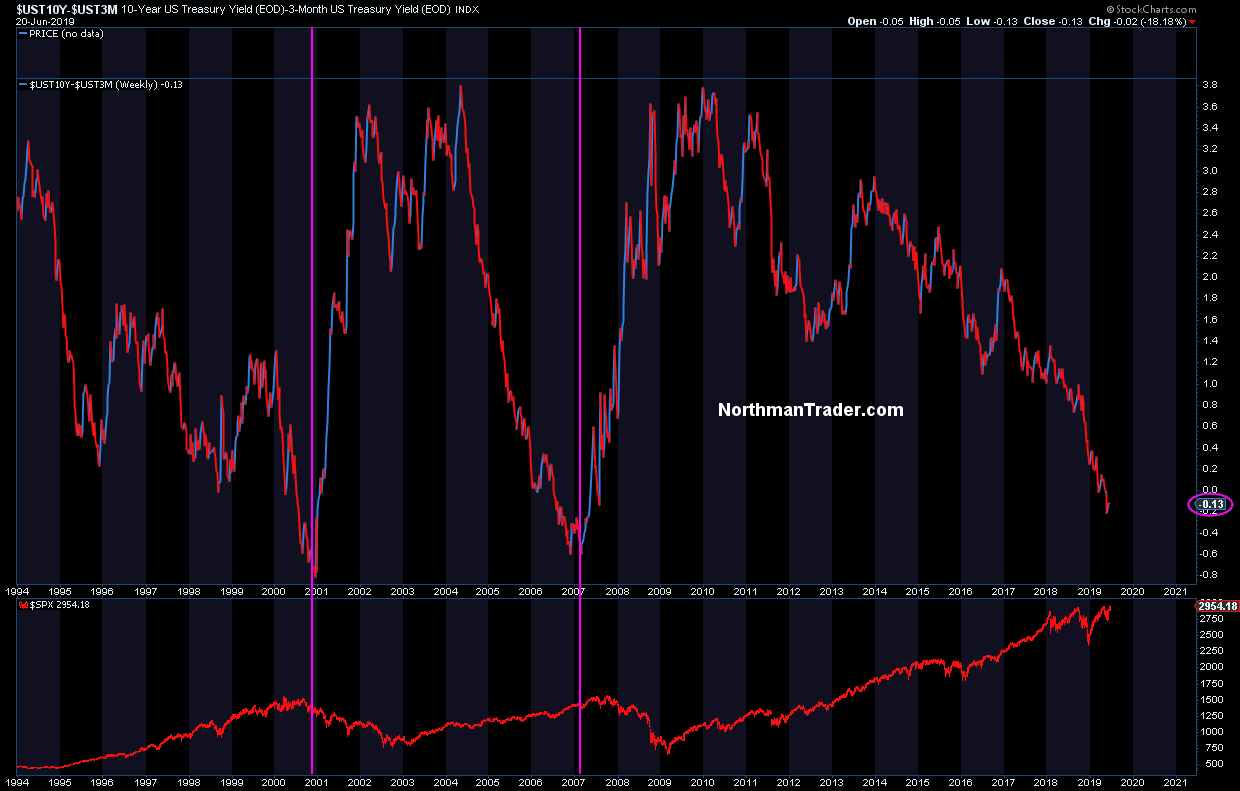
All that’s missing for the freakout is the sudden steepening of the curve. And that’s what the Fed is watching and is reacting to.
If only there were signs….Oh wait, what’s this?
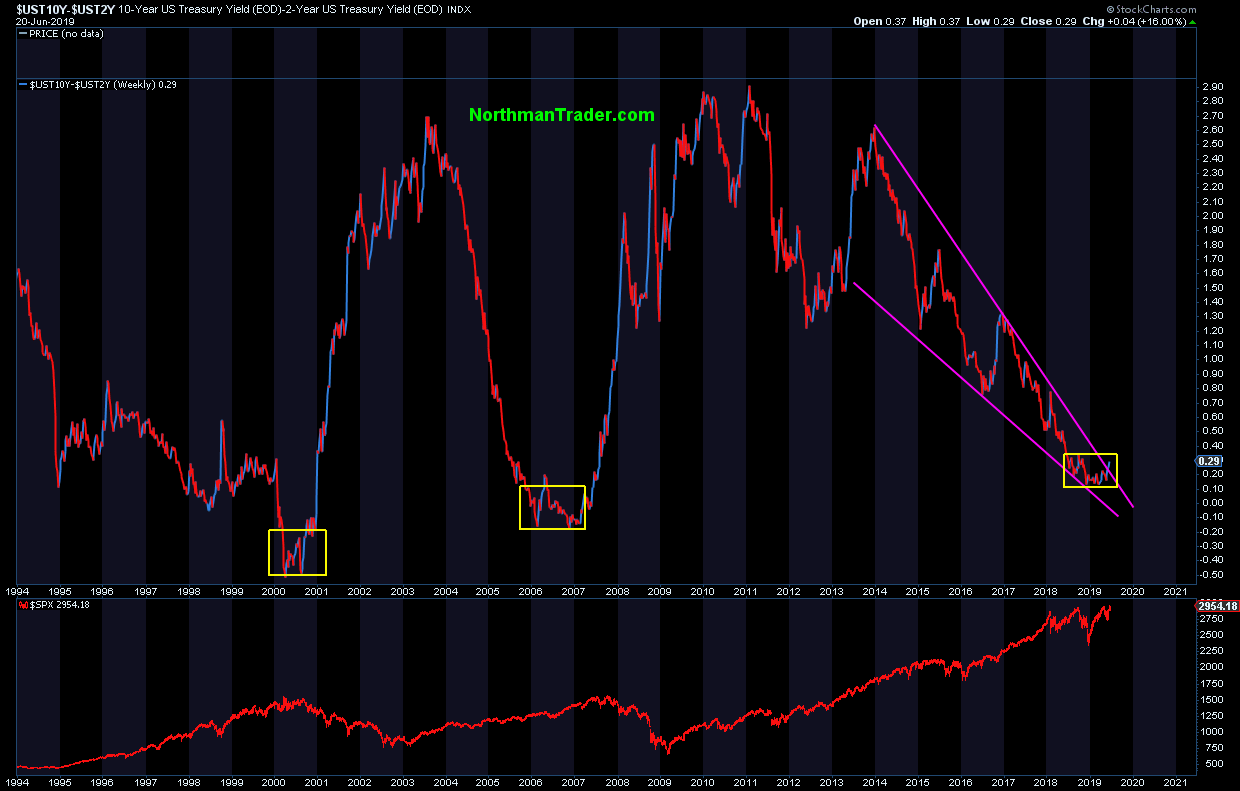
That’s the 10year/2year suspiciously looking to break outside a multi year wedge pattern following a consolidation period. Not inverted, but nevertheless steepening. To be fair the last 3 recession saw an inverted 10year-2 year. But then the last 3 recessions didn’t see $13 trillion in negative yielding debt.
What is steepening here from inversion is the 5 year/2 year yield curve.
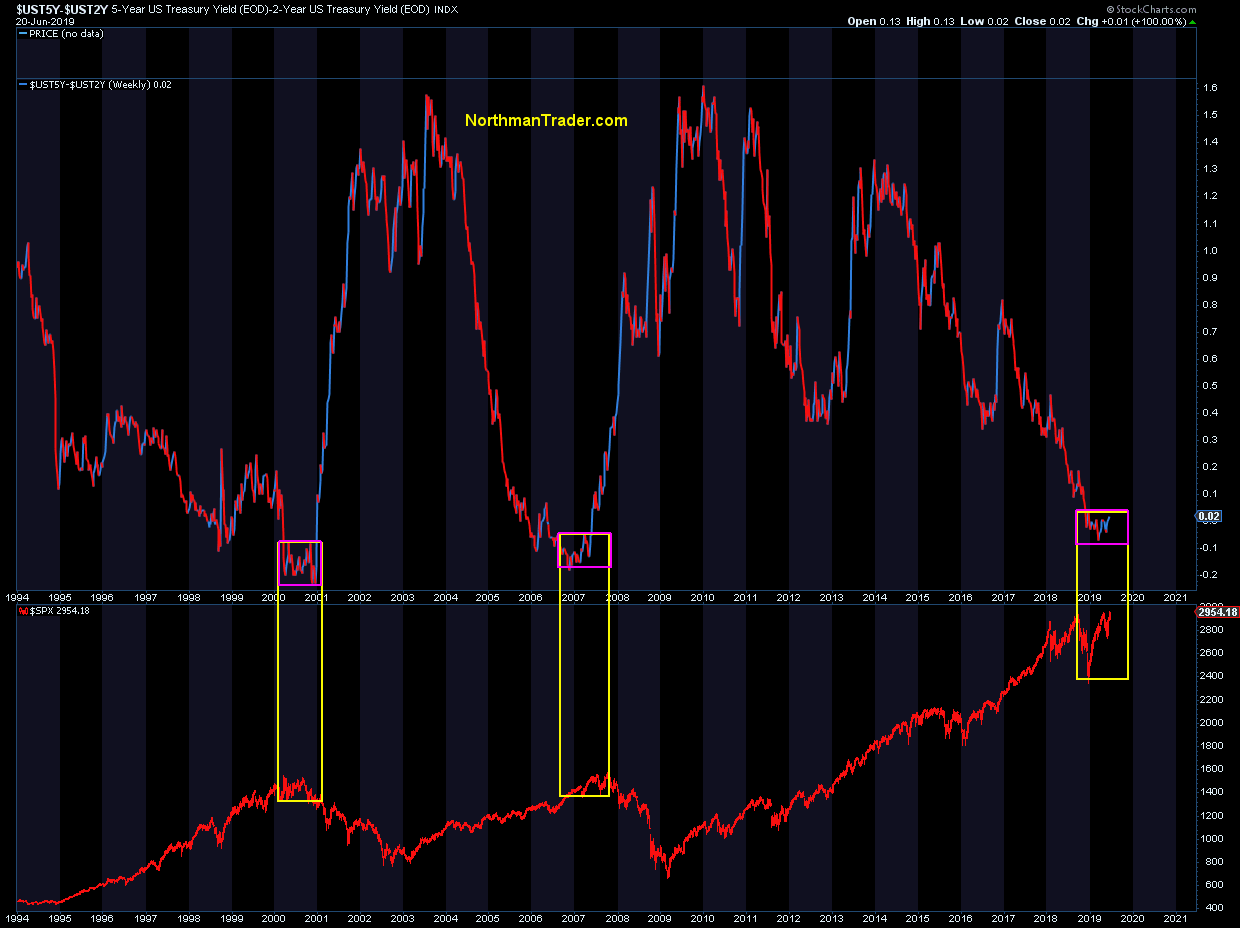
Still barely noticeable, but it is the move next out of these consolidation patterns that has shown in the past to be fast, furious and steep.
And there is one yield curve where we can actually observe a rapid steepening already taking place:

Oh look, coinciding with previous events of extreme low unemployment at the end of business cycles.
Still wondering why the banks are lagging and the Fed is freaking? Then I can’t help you. The charts tell the story better than I can.
Watch this space.
* * *
For the latest public analysis please visit NorthmanTrader. To subscribe to our market products please visit Services.
via ZeroHedge News http://bit.ly/2WRwo9r Tyler Durden