Let’s set the stage. After 7 years of zero percent interest rates, the Fed started draining liquidity from the market in December 2015 by tightening rates 25 basis points.
Over the next four years, the Fed continued to tighten and launched QE runoff, letting the SOMA portfolio shrink, effectively putting more Treasurys back into the market. At the same time, the Treasury was issuing a massive about of debt. The landscape was set.
Just when the Fed was draining liquidity, more Treasurys were coming into the market via QE runoff and new issuance.
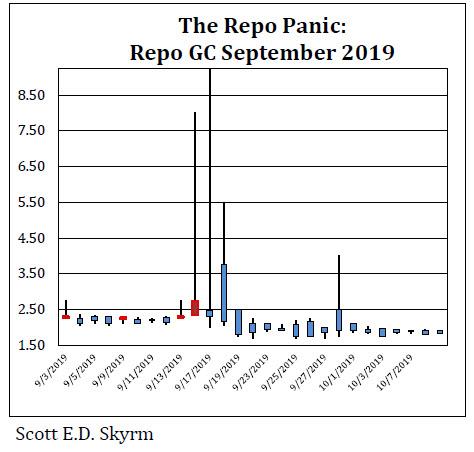
On Monday and Tuesday, September 16 and 17, GC Repo rates spiked higher, trading as high as 8.00% on Monday and 9.25% on Tuesday.
An incredible amount of volatility. But note, on both days, rates closed within their normal trading range. Strange. Though rates spiked so high, at the end of the day (especially on Monday) there was still enough cash for everyone to get funded. Regardless. Then, as a result, the Fed dusted off their RP operations program and entered the market for the first time in years.
The Repo Panic of September 2019 had a major impact on the market for six months. It was a liquidity event that pushed rates higher and created a lot anxiety. But don’t let anyone fool you.
The official history was written claiming insufficient bank reserves blah blah blah. But the answer is simple. There were too many US Treasurys in the market (ZH: and not enough liquidity).
The resurrection of the Fed’s RP program helped smooth day-to-day spikes, but the relaunch of aggressive QE buying removed enough Treasurys to stabilize the market.
via ZeroHedge News https://ift.tt/32D3PTq Tyler Durden
Ex-JPMorgan Trader Sentenced To 8 Months In Prison For FX Bid-Rigging Tyler Durden
Thu, 09/17/2020 – 15:25
Two years after former HSBC head of currency trading, Mark Johnson, became the first person to be convicted in a global crackdown of currency rigging and was sentenced to two years in a U.S. prison, moments ago a former JPMorgan trader became the second person to be sentenced to eight months in prison for his role in a foreign-exchange bid-rigging scheme.
Bloomberg reports that Akshay Aiyer was sentenced Wednesday by Manhattan District Judge John Koeltl. Last November, Aiyer was found guilty of conspiring with traders at other banks in chat rooms, on telephone calls and at social gatherings to coordinate bids and fix prices of African, European and Middle Eastern currencies while leading customers to believe they were competing with each other.
In 2017, Johnson was convicted of front-running a $3.5 billion client order, but as Bloomberg reminds us, a U.K. court declined to extradite Johnson’s underling, Stuart Scott, and three British traders accused of similar conduct were acquitted by a jury in New York in 2018. U.K. investigators dropped a criminal probe into individual traders after determining they didn’t have enough evidence.
Even though Aiyer’s sentence was lower than that sought by prosecutors, the conviction was a victory for the government, which has a mixed record of prosecuting foreign-exchange traders. In addition to the prison term, Aiyer was also sentenced to two years of supervised release and a $150,000 fine.
Aiyer, a native of India who worked at JPMorgan from 2006 until he was fired in 2015, had requested that the judge sentence him to a term of probation with a period of home confinement. His lawyers argued that he had no criminal history and was convicted of a crime in connection with conduct that was “widespread in the foreign-exchange industry.” So just like in the case of the gold rigging discussed earlier, we again learn that market manipulation were “widespread” begging the question – just what do regulators do all day?
Prosecutors had asked the judge to sentence Aiyer to as many as 46 months behind bars as recommended by federal sentencing guidelines, saying a prison term was necessary to “reflect his guilt of a serious crime.” They argued that he and his co-conspirators worked to rig the market “in order to line their own pockets, with no regard for the victims they left in their wake,” and that Aiyer had shown no remorse for his conduct. As Bloomberg adds, at his sentencing Aiyer asked the judge to show compassion, saying he has suffered a lot over the last six years and that the experience has been the worst of his life. “I’ve lost my job, I’ve ruined my career.”
Johnson and Aiyer are just two of the more than half a dozen traders charged by the US in relation to misconduct in the currency markets; banks around the world have paid more than $10 billion in FX rigging penalties since the crackdown began. Citigroup, Barclays, RBS and JPMorgan all pleaded guilty in 2015 to rigging currency exchange rates and agreed to pay about $2.5 billion to the Justice Department as part of a $5.8 billion settlement with regulators.
Aiyer’s attorney, Martin Klotz, said prosecutors overstated the impact of his trading activity at nearly $277 million, saying Aiyer himself likely gained only thousands of dollars and any profits to JPMorgan probably coming in under $1 million.
In other words, steal $1 million on Wall Street and get a wrist-slap and a few months in Club Fed. Steal $1 million anywhere else, and get ready for an extended stay in Federal pound me in the ass prison.
Prosecutors relied on testimony from two alleged conspirators, former Citigroup trader Christopher Cummins and ex-Barclays banker Jason Katz, who pleaded guilty and testified for the government. Defense lawyers argued that Cummins and Katz had been colluding with other traders for years before they even met Aiyer and were simply trying to avoid prison.
via ZeroHedge News https://ift.tt/3myOXx6 Tyler Durden
The OPEC+ group will allow non-compliant members to take until the end of the year to compensate for their overproduction, Saudi Arabia’s Prince Abdulaziz bin Salman said on Thursday as he slammed laggards in compliance for trying to “outsmart the market.”
OPEC+ had given laggards in compliance, such as Iraq and Nigeria, until the end of September to cut more production on top of their share of the cuts to make up for what they overproduced in May, June, and July.
Iraq has signaled that it could ask the OPEC+ panel to allow it to extend the period in which it should compensate for its lack of compliance through November, instead of by the end of September.
At the beginning of the OPEC+ Joint Ministerial Monitoring Committee (JMMC) on Thursday, the energy minister of OPEC’s de facto leader Saudi Arabia said in prepared remarks that “using tactics to over produce and hide non-compliance have been tried many times in the past, and always end in failure,” Argus reported.
“Attempts to outsmart the market will not succeed and are counterproductive when we have the eyes, and the technology, of the world upon us,” the minister said, Javier Blas, Chief Energy Correspondent at Bloomberg News, noted.
Prince Abdulaziz bin Salman didn’t name any countries in particular, but the fact that he was sitting next to Suhail Al Mazrouei, the Energy Minister of the most recent – and somewhat surprise – overproducer in the deal, the UAE, has analysts saying that he is chastising every member of the OPEC+ group that flouted their quotas in recent months.
“Full compliance is not an act of charity,” the Saudi energy minister also said, noting that “repeated promises that are not carried through in a timely fashion may have temporary positive impact, but if these are not delivered, they can come back to bite us all.”
The false promises discredit not only the ones who have made them, but also undermine the OPEC+ goal, Prince Abdulaziz bin Salman said, and noted “the market can’t be fooled continually.”
via ZeroHedge News https://ift.tt/3hGufIa Tyler Durden
Walmart Announces Pay Raises For 165,000 Hourly Workers As It Eliminates Their Quarterly Bonuses Tyler Durden
Thu, 09/17/2020 – 14:55
Walmart announced sweeping changes to staffing in its U.S. stores, which include restructuring the leadership roles at its Supercenters and raising pay for some of its salaried and hourly employees, according to a company press release on Thursday.
Today we’re introducing new leadership roles and cross-training opportunities, giving our associates more ways to grow their careers. As a result, more than 165,000 associates will receive a raise! Read more: https://t.co/v2SFcjrUakpic.twitter.com/SLVC21DU7l
The retail giant announced the following new positions: store lead (formerly co-manager), coach (formerly assistant manager) and team lead (formerly department manager). Walmart said its new “team-based operating model” is similar to one implemented Sam’s Club over the past year and in Neighborhood Market stores this year. According to Walmart, the move will increase cross-training opportunities for employees.
Across the store, we’re creating small teams of associates who will be cross-trained and given ownership of the work and their area for everything from in-stock to visual standards. This means they’ll gain more skills and be able to support associates who want to take time off or just need extra help during a busy shift. For example, associates who prepare fresh food will be trained to maintain pricing and standards in their area – giving them broader skill sets that allow them to help customers and grow their own careers.
Additionally, Walmart will raise wages for its salaried digital, asset protection and auto care center assistant manager employees. The new wage for the hourly team lead roles start at between $18 and $21 an hour and can go up to $30 an hour in Supercenters. Minimum wages for hourly associates in the deli and bakery areas are going up from $11 an hour to $15 an hour or higher. Pay will also be raised for several hourly auto care center roles with most getting an increase of $1 or more per hour.
In total, about 165,000 hourly staffers will see a raise, Walmart said in a memo outlining the move, but the program will also trim the ranks of leaders per store, and could prompt some to leave. That said, the company clarifies that all current employees will continue to be able to work at Walmart, even if they are not selected for one of the new roles.
“For example, associates who prepare fresh food will be trained to maintain pricing and standards in their area – giving them broader skill sets that allow them to help customers and grow their own careers,” the release said.
As Bloomberg notes, the changes are part of a broader rethinking of how to most efficiently deploy Walmart’s 1.5 million-person U.S. workforce in a more digital age. The pandemic, which has spurred demand for groceries and household essentials, shocked supply chains and boosted e-commerce, has tested workers’ patience, with some shoppers railing about missing items and others refusing to adhere to mask-wearing mandates. “Once-mundane tasks, like store cleaning, have become critical.”
For affected employees, the pay raises will be implemented in October, taking the place of an annual increase typically received in February or April. Of course, there is a catch, because while WalMart is hiking base wages it will also eliminate quarterly bonuses for most workers: for workers in these hourly roles, the increase will take the place of Walmart’s regular quarterly bonus and become part of their base pay going forward.
“These associates will continue to be eligible to receive quarterly bonuses for Q3 and Q4 of this year. When we’ve asked associates, the overwhelming majority say their hourly wages are the most important part of their pay, well ahead of quarterly bonuses,” Walmart said in its release.
Furthermore, not everyone will benefit: U.S. Chief Operating Officer Dacona Smith declined to estimate how many associates won’t be selected for one of the new roles, but said they can remain in a “similar position” and their current pay won’t be adjusted until October 2021.
“I don’t anticipate us having a large problem” of losing staff because of the changes, Smith said.
via ZeroHedge News https://ift.tt/2ZMBoAA Tyler Durden
If you want a sneak peek of our dystopic future under the impending Kamala Harris/Progressive Left Regency look no further than the recent utterances of California Governor Gavin Nukesom.
The latter is the poster boy for the camarilla of left-wing ideologues fixing to take power if the electorate sees fit to put Sleepy Joe in the Oval Office for an occasional oxygenated and propped-up fireside chat from his teleprompter. Commenting on the raging wildfires ravaging the state, the ever so politically correct scourge of racists, right-wing bumpkins and climate deniers decreed that:
“The debate is over, around climate change,” Mr. Newsom told reporters. “This is a climate damn emergency. This is real and it’s happening.”
“I have no patience, and I say this lovingly, not as an ideologue but as someone who prides himself on being open to argument, interested in evidence…but I quite literally have no patience for climate change deniers,” the governor continued. He said skeptics’ point of view is “completely inconsistent…with the reality on the ground.”
He acknowledged failings in forest management in recent decades, but added:
“That’s one point, but it’s not the point.”
Oh, but drastic forestry mismanagement and negligence, which has turned much of California into a dry wood fuel dump, is exactly the point. The purported global warming has nothing to do with it.
And don’t take our word for it. This comes from the George Soros funded Pro Publica, which is not exactly a right-wing tin foil hat outfit. It points out that environmentalists have so shackled Federal and state forest management agencies that today’s tiny “controlled burns” are but an infinitesimal fraction of what Mother Nature herself accomplished before the helping hand of today’s purportedly enlightened political authorities arrived on the scene:
Academics believe that between 4.4 million and 11.8 million acres burned each year in prehistoric California. Between 1982 and 1998, California’s agency land managers burned, on average, about 30,000 acres a year. Between 1999 and 2017, that number dropped to an annual 13,000 acres. The state passed a few new laws in 2018 designed to facilitate more intentional burning. But few are optimistic this, alone, will lead to significant change.
We live with a deathly backlog. In February 2020, Nature Sustainability published this terrifying conclusion: California would need to burn 20 million acres – an area about the size of Maine – to restabilize in terms of fire.
In short, if you don’t clear and burnout the deadwood, you buildup nature-defying tinderboxes that then require only a lightening strike, a spark from an un-repaired power line or human carelessness to ignite into a raging inferno.
Indeed, in disregarding thousands of years of ecological knowledge and land stewardship practiced by indigenous peoples before the arrival of European settlers, the US government for years suppressed wildfires that were necessary to clear out overgrown vegetation and keep forests healthy. They shunned a practice, observed by hundreds of tribes in the region, of setting small, intentional fires to renew the landscape and prevent larger, more destructive wildfires – called “prescribed burns”. Over decades, Californians also built their homes into wild landscapes particularly prone to fires, and continue to do so.
Nor is it a matter of today’s authorities having somehow lost the knowledge possessed by the ancients. Tim Ingalsbee is a forty-year veteran of fighting the California fires up close and in the red hot. In 1980 he started working as a wildland firefighter, and in 1995 earned a doctorate in environmental sociology. Frustrated by the huge gap between what he was learning about fire management and experiencing on the fire line, in 2005 he started Firefighters United for Safety, Ethics, and Ecology (FUSEE).
Needless to say, FUSEE ain’t no coalition of developers, builders, utilities and chambers of commerce dedicated to turning forests and wilderness areas into concrete jungles. To the contrary, it has been lobbying Congress, and trying to educate anybody who will listen, about the misguided fire policy that is leading to today’s mega-fires.
In one pithy phrase, veteran firefighter Ingalsbee put the kibosh on the unfounded claims of Governor Newsom and the gaggle of Climate Change Howlers he represents:
…. There’s only one solution, the one we know yet still avoid. “We need to get good fire on the ground and whittle down some of that fuel load.”
Andrea Widburg of the American Thinker summed it up well:
Environmentalism is why California stopped grooming forests or doing controlled burns to get rid of deadwood (AKA tinder). It was because of environmentalism that PG&E poured all of its money into building renewable energy facilities, such as the solar facilities that failed during California’s recent heat wave, and stopped repairing old power lines (some going back 90 years) or trimming back tinder around those power lines. All this misbegotten environmentalism has controlled California even as more people have moved into fire zones over the past several decades.
In fact, a dramatically larger human footprint in the fire-prone shrub-lands and chaparral (dwarf trees) areas along the coasts increases the risk residents will start fires. California’s population nearly doubled from 1970 to 2010, from about 20 million people to 39 million people, and nearly all of the gain was in the coastal areas.
Under those conditions, California’s strong, naturally-occurring winds, which crest periodically, are the main culprit which fuels and spreads the human set blazes in the shrub-lands. The Diablo winds in the North and Santa Ana winds in the South can actually reach hurricane force. As wind moves West over California mountains and down toward the coast, it compresses, warms and intensifies. The winds blow flames and carry embers, spreading the fires quickly before they can be contained.
As one expert noted,
The first is the wind-driven fires on coastal shrub-land, or chaparral, where most of the houses are. Think: Malibu and Oakland. Nineteen of the state’s 20 most deadly and costly fires were there.
If you recognize that 100% of these [shrub-land] fires are started by people, and you add 6 million people [since 2000], that’s a good explanation for why we’re getting more and more of these fires,” said Keeley.
This year there was an especially lethal confluence of Mother Nature’s normal doings, having nothing to do with anthropogenic warming. These natural forces include the periodic La Nina cooling trend in the Pacific waters, which in turn tends to bring dry weather across portions of California and much of the Southwest.
Next, an unusually large tropical storm in the Pacific Ocean spun a massive front of moisture toward California, triggering a rare lighting storm that zapped the region more than 10,800 times over a recent three-day period, sparking small fires across the Bay Area and northern California. As Pro Publica further explained,
Then the humidity dropped and winds picked up, stoking the small flames until they erupted into full-blown infernos. One of the wildfires in northern California actually spawned a fire tornado – a 30,000 ft. smoky swirl that frizzled with lightning, prompting the National Weather Service to issue a first-of-its-kind weather alert.
The point is, none of these naturally occurring, fire-fueling forces arose suddenly subsequent to 1980 when, after purportedly inventing the computer, Al Gore went on to discover “global warming” at the end of a 1,000 year temperature hockey stick which (see below) was a fraud from the day it was concocted on Michael Mann’s hooky computer models.
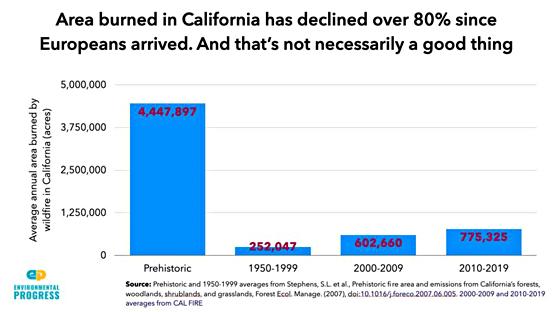
Among other proofs that industrialization and fossil fuels aren’t the culprit is the fact that researchers have shown that when California was occupied by indigenous communities, wildfires would burn up some 4.5 million acres a year. That’s nearly 6X the 2010-2019 period, when wildfires burned an average of just 775,000 acres annually in California.
In fact, researchers have found that before Europeans arrived, fires burned up woody biomass in California’s forests every 10 to 20 years, preventing the accumulation of (wood) fuel, and burned out the shrub-lands every 50 to 120 years.
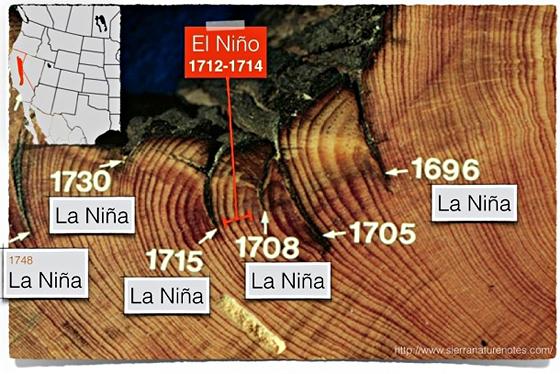
Nor is this mere conjecture. Redwood forests before Europeans arrived burned every 6 to 25 years. The evidence comes from fire scars on barks and the bases of massive ancient trees, hollowed out by fire. In the example below, the fire scars from La Nina years are readily visible, as are the growth spurts from El Nino years, which are wetter and conducive to growth.
Needless to say, for the last 100 years or so the US Forest Service and the state agencies have put out most fires, resulting in the vast accumulation of wood fuel. Another experts put it quite graphically:
Mike Beasley earned what he called his “red card,” or wildland firefighter qualification, in 1984. To him, California, today, resembles a rookie pyro Armageddon, its scorched battlefields studded with soldiers wielding fancy tools, executing foolhardy strategy.
“Put the wet stuff on the red stuff,” Beasley summed up his assessment of the plan of attack by Cal Fire, the state’s behemoth “emergency response and resource protection” agency. Instead, Beasley believes, fire professionals should be considering ecology and picking their fights: letting fires that pose little risk burn through the stockpiles of fuels. Yet that’s not the mission. “They put fires out, full stop, end of story.”
Accordingly, fire expert Nick Goulette, who is executive director of the Watershed Research and Training Center, quantified the massive gap between the needed burns and what has been done over the last several decades, which has built-up the current massive wildfire fuel dump in California:
We’re at 20,000 acres a year. We need to get to a million. What’s the reasonable path toward a million acres?” Maybe we could get to 40,000 acres, in five years……Forty thousand acres? Is that meaningful? The answer, obviously, is no.
Ironically, one of the major forces contributing to California’s ecological disaster is not the state’s industrial and automotive emitters of air pollutants including CO2, but its infamous clean air fanatics at the California Air Resources Board (CARB). As one forestry manager told Pro Publica,
‘Yeah, we’ve spent thousands and thousands of dollars to get all geared up to do a prescribed burn,’ and then they get shut down (by CARB).” Maybe there’s too much smog that day from agricultural emissions in the Central Valley, or even too many locals complain that they don’t like smoke. Reforms after the epic 2017 and 2018 fire seasons led to some loosening of the CARB/prescribed fire rules, but we still have a long way to go.
Needless to say, the raging wildfires of the present don’t pay any attention whatsoever to the CARB’s burn rules which shackle forest managers.
Beyond the untoward clash of all of these natural forces of climate and ecology with misguided government forest and shrub-land husbandry policies, there is actually an even more dispositive smoking gun, as it were.
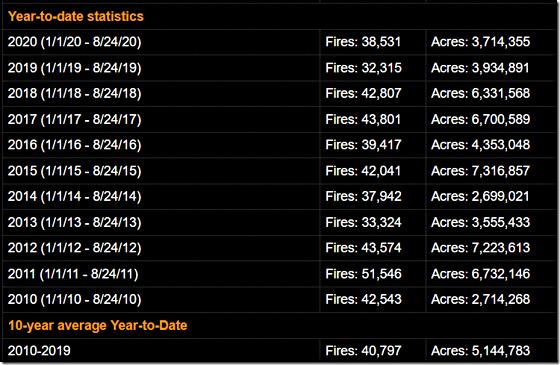
To wit, the Climate Change Howlers have not yet embraced the apparent absurdity that the planet’s purportedly rising temperatures have targeted the Blue State of California for special punishment. Yet when we look at the year-to-date data for forest fires we find, alas, that unlike California and Oregon, the US as a whole is now experiencing one of the weakest fire years since 2010.
That’s right. As of August 24 each year, the 10-year average burn has been 5.114 million acres across the US, but this year was 28% lower at 3.714 million acres.
National fire data year to date:
Indeed, what the above chart shows is that on a national basis there has been no worsening trend at all during the last decade, just huge oscillations year-to-year driven not by some grand planetary heat vector but by changing local weather and ecological conditions.
You just can’t go from 2.7 million burned acres in 2010 to 7.2 million acres in 2012 and then back to 3.9 million acres last year and 3.7 million acres this year and argue along with Nancy Pelosi that the planet is angry.
To the contrary, the only real trend evident is that on a decadal basis during recent times that average forest fire acreage in California has been slowly rising, owing to the above described dismal failure of government forest management policies. But even the mildly rising average fire acreage trend since 1950 is a rounding error compared to the annual averages from prehistoric times, which were nearly 6X greater than during the most recent decade.
Furthermore, the gently risen trend since 1950 should not be confused with the Climate Change Howlers bogus claim that California’s fires have “grown more apocalyptic every year,” as The New York Times reported.
In fact, they are comparing this year’s above average burn to 2019, which saw an unusually small amount of acreage burned – just 280,000 acres compared to 1.3 million and 1.6 million in 2017 and 2018, respectively, and 775,000 on average over the last decade.
At the end of the day, what is really going on in California is that the natural modern opponent of the kind of uncontrolled wildfires ravaging the state at present is actually industrial logging and timber harvesting. The later results in regular clearance, which reduces forest density, and the construction of logging roads and staging areas which double as firebreaks.
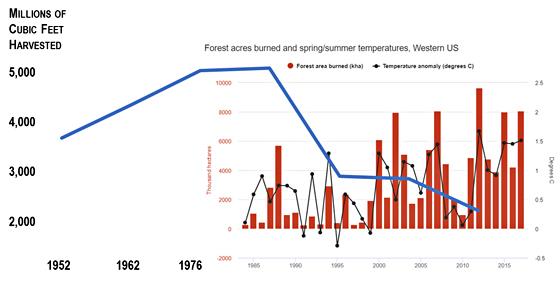
Not surprisingly, in fact, what correlates with the rising level of uncontrolled forest fires (red bars) in the Western US is not the so-called temperature anomaly trend (black line) ballyhooed by the Climate Change Howlers, but the plummeting level of timber harvest (blue line), which has been cut in half since the late 1980s.
So when you combine the collapse of the timber harvest with a concurrent drop in active forest management practices, the area burned by wildfire got progressively larger as the fuel load increased, not as Mother Earth got warmer. The so-called temperature anomaly change is flakey to begin with, as explained below, but has not really exhibited any material trend change since 1990.
Then there is also this. Fighting summer/fall wild fires is a big business and lucrative for both Cal Fire employees and outside contractors to boot.
Before 1999, Cal Fire never spent more than $100 million a year. In 2007-08 that figure rose to $524 million, then $773 million in 2017-18 and this year could be the first $1 billion season. And on top of all the state money, federal disaster funds flow down from “the big bank in the sky,”
As Pro Publica noted,
Studies have shown that over a quarter of U.S. Forest Service fire suppression spending goes to aviation – planes and helicopters used to put out fire. A lot of the “air show,” as he calls it, happens not on small fires in the morning, when retardant drops from planes are most effective, but on large fires in the afternoon. But never mind. You can now call in a 747 to drop 19,200 gallons of retardant. Or a purpose-designed Lockheed Martin FireHerc, a cousin of the C-130. How cool is that? Still only 30% of retardant is dropped within 2,000 yards of a neighborhood, meaning that it stands little chance of saving a life or home. Instead the airdrop serves, at great expense, to save trees in the wilderness, where burning, not suppression, might well do more good.
This whole system is exacerbated by the fact that it’s not just contracts for privately owned aircraft. Much of the fire-suppression apparatus – the crews themselves, the infrastructure that supports them – is contracted out to private firms. “The Halliburton model from the Middle East is kind of in effect for all the infrastructure that comes into fire camps,” Beasley said, referencing the Iraq war. “The catering, the trucks that you can sleep in that are air-conditioned…”
Likewise, Cal Fire staff firefighters are also very well compensated, especially relative to the thousands of California prison inmates who serve on fire crews for comparatively meager money and good time credit. As the California Policy Center reported in 2017:
The median compensation package – including base pay, special pay, overtime and benefits – for full time Cal Fire firefighters of all categories is more than $148,000 a year.
Stated differently, full-scale mobilization against 2 million acre wildfires is a lot more lucrative for all parties concerned than targeted, controlled burns of 20,000, 40,000 or even 100,000 acres per season. As in all things, therefore, follow the money, not the hyperventilating politicians like Governor Newcom, Kamala Harris and their noisy “base” of climate change alarmists.
Finally, of course, there is the small matter that aside from the normal forces that drive planetary climate patterns and temperature change over long intervals of time, Mother Earth is not getting warming anyway owing to the relatively meager impact of mankind’s industrial activities around the planet.
With respect to California specifically, a study of the US surface temperature record presented at the 2015 Fall Meeting of the American Geophysical Union indicated that the 30-year temperature trend per the official National Oceanic and Atmospheric Administration record is likely substantially exaggerated.
That’s owing to massive urban encroachment on weather station sites. Only 410 of 1,218 weather stations in the continental US were unperturbed by such heat concentrating structures as asphalt parking lots built next to what was once a weather station located in a grass field. Again, per Pro Publica:
Largely because of the urban heat island effect, weather stations in California and Nevada were particularly affected. In California and Nevada, the temperature increase per decade from 1979 to 2008 was 0.04 degrees centigrade when using unperturbed sites, versus the official record increase of 0.24 degrees, a six-fold difference.
Of course, in the greater scheme of planetary history, even this probable six-fold exaggeration of recent temperatures is of no real moment. That’s because the postulated pre-industrial climate equipoise never existed.
What there’s been is 4 billion years of wildly oscillating and often violent geologic evolution and climate disequilibrium – owing to manifold natural causes ranging from plate tectonics, to asteroid bombardments, to the multi-hundred million years succession of Ice Ages and the warming intervals in between.
Even the simple textbook extracts from the History Channel cited below remind us that what may or may not have been happening to the global temperature since it allegedly began rising again around 1980 amounts to a white noise rounding error in the grand scheme of things.
In fact, scientists have recorded five significant ice ages throughout the Earth’s history. There have naturally been extended periods of global warming in-between, and it goes without saying that we are now in the latest of them:
the Huronian (2.4-2.1 billion years ago),
Cryogenian (850-635 million years ago),
Andean-Saharan (460-430 mya),
Karoo (360-260 mya) and the
Quaternary (2.6 mya-present)…..
As the History Channel tutorial further explained regarding the most recent Quaternary era:
Warming of Earth and glacial retreat began about 14,000 years ago. The warming was shortly interrupted by a sudden cooling at about 10,000–8500 BC known as the Younger-Dryas. The warming resumed by 8500 BC. The younger-dryas event is significant because it shows that even during an otherwise tranquil period (the current interglacial), rapid climate shifts can still occur.
By 5000 to 3000 BC average global temperatures reached their maximum level during the Holocene and were 1 to 2 degrees Celsius warmer than they are today. Climatologists call this period either the Climatic Optimum or the Holocene Optimum.
During the climatic optimum many of the Earth’s great ancient civilizations began and flourished. In Africa, the Nile River had three times its present volume, indicating a much larger tropical region. 6,000 years ago the Sahara was far more fertile than today and supported large herds of animals, as evidenced by the Tassili N’Ajjer frescoes of Algeria (right).
From 3000 to 2000 BC a cooling trend occurred. This cooling caused large drops in sea level and the emergence of many islands (Bahamas) and coastal areas that are still above sea level today.
A short warming trend took place from 2000 to 1500 BC, followed once again by colder conditions. Colder temperatures from 1500–750 BC caused renewed ice growth in continental glaciers and alpine glaciers, and a sea level drop of between 2 to 3 meters below present day levels.
The period from 750 BC–800 AD saw warming up to 150 BC. Temperatures, however, did not get as warm as the Climatic Optimum. During the time of Roman Empire (150 BC – 300 AD) a cooling began that lasted until about 900 AD, although Global average temperature remained relatively warm until about 600 AD.
From 600-900 AD (the “Dark Ages”), global average temperatures were significantly colder than today. At its height, the cooling caused the Nile River (829 AD) and the Black Sea (800-801 AD) to freeze.
The period 1100–1300 AD has been called either the Little Climatic Optimum or the Medieval Warm Period. It represents the warmest climate since the Climatic Optimum.
During this period, the Vikings established settlements on Greenland and Iceland. The snow line in the Rocky Mountains was about 370 meters above current levels.
A period of cool and more extreme weather followed the Little Climatic Optimum. There are records of floods, great droughts and extreme seasonal climate fluctuations up to the 1400s. Horrendous floods devastated China in 1332 (reported to have killed several million people).
A great drought in the American southwest occurred between 1276 and 1299. During this period occurred the abandonment of settlements in the Southwest United States, including those in Chaco Canyon and Mesa Verde. Tree ring analysis has identified a period of “no” rain between 1276 and 1299 in these areas.
The cold winters of the little Ice Age were recorded in Dutch and Flemish paintings such as Hunters in the Snow by Pieter Bruegel (c. 1525-69)
From 1550 to 1850 AD global temperatures were at their coldest since the beginning of the Holocene. Scientists call this period the Little Ice Age.
During the period 1580 to 1600, the western United States experienced one of its longest and most severe droughts in the last 500 years. Cold weather in Iceland from 1753 and 1759 caused 25% of the population to die from crop failure and famine. Newspapers in New England were calling 1816 the year without a summer.
During the Medieval warm period (1100-1300 AD), global average temperatures were only 1°C (or less) warmer than in 1900, but in Europe the Vikings established a colony on Greenland (where) farming was productive (and has not been possible again since that time). Grape vines were grown in England and wheat was grown in Norway (64° North latitude) – also not possible at present.
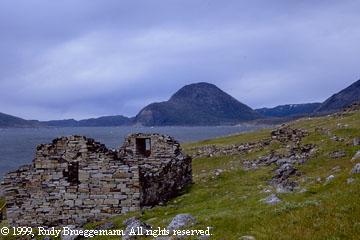
At end of period, the Viking colony was lost to sea ice expansion, and the remaining settlers’ last winter turned out to be one of rampant cannibalism as archeologists have documented with respect to the remains of the settlement pictured below.
Needless to say, as gory as the cannibalism might have been, it does prove that the Vikings were not colorblind when they named today’s pure white glacier, Greenland.
Long before the industrial era, Greenland was so warm, wet and fertile that major colonization occurred after 980AD in conjunction with the Medieval Warming period. At its peak it included upwards of 10,000 settlers, extensive farming, numerous catholic churches and a parliament that eventually voted for union with Norway.
By contrast, during the Little Ice Age (1550-1850 AD), which wiped out the Greenland settlements, the global average temperatures became substantially colder.
In Europe, glaciers came down the mountains, thereby covering houses and villages in the Swiss Alps, while canals in Holland froze for three months straight–a rare occurrence before or after. Agricultural productivity also dropped significantly, even becoming impossible in parts of northern Europe.
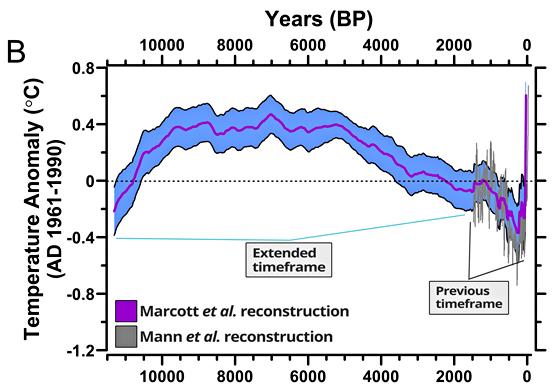
This brings us to the climatic Piltdown Mann – named for one Michael Mann, newly minted PhD in 1998 who became the IPCC’s (International Panel on Climate Change) lead investigator and advocate for what famously became the “hockey stick” proof of global warming.
The latter, of course, was the blatant fraud embedded in the image that Al Gore made famous in his propagandistic movie called “An Inconvenient Truth” in 2006. Suffice to say that the purpose of the hockey stick was to wipe out all of the evidence summarized above.
That is, in lieu of the planet’s long-term and recent severe climate oscillations, the IPCC posited an entirely opposite thesis. Namely, that for the pre-industrial millennium before 1900, global temperatures were nearly flat as a board.
Accordingly, only when the industrial age got a head of steam and reached full force after 1950 did today’s warming temperatures first appear, or so it was alleged. The suggestion, of course, was that an uncontrolled temperature breakout to the upside was well underway and that a planetary disaster was just around the corner.
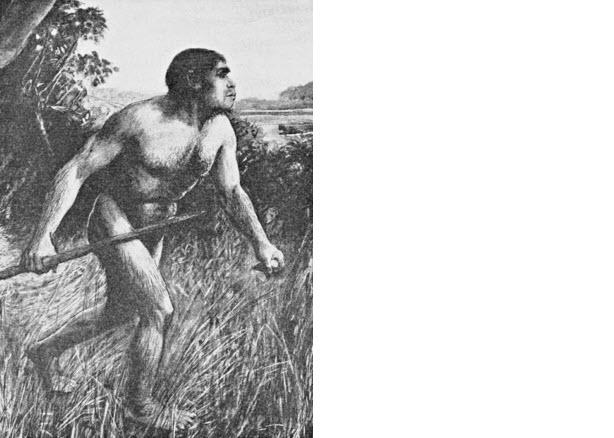
The only problem is that Mann’s graph was as phony as the Piltdown Man that was confected in England in 1912 and conveniently “discovered” by an amateur anthropologist who claimed it was the missing link in human evolution. At length, it was shown that the fossil was a forgery; it consisted of a modern human cranium and an orangutan jaw with filed-down teeth.
In this case, professor Mann and his accomplices at the IPCC doctored the evidence, used misleading data from Southwestern US tree rings in lieu of abundant alternative data showing the contrary, and jiggered their computer models to generate preconceived results.
That is, the models were goal-seeked by Mann and his associates to prove the man-made warming thesis. In essence, it was accomplished by simply pasting modern temperature records showing steady increases on top of a pre-industrial baseline that never happened.
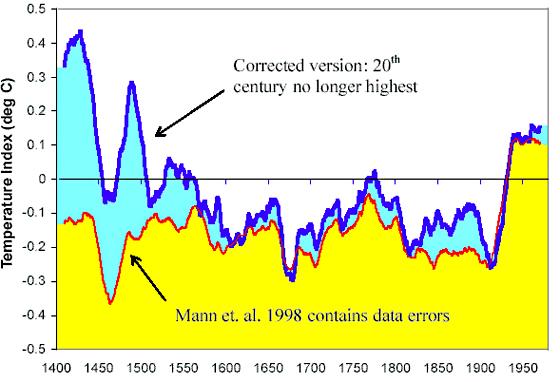
The phony pre-industrial baseline is depicted by the yellow area in the graph for the period 1400-1900. The hockey stick like eruption of the yellow space after 1900, of course, allegedly depicts the man-made temperature rise since the onset of the hydrocarbon age.
By contrast, the corrected version is in blue. In this version – which comports with the history of climate oscillations cited above – there is no hockey stick because the shaft never happened; it was invented by computer model manipulations, not extracted from the abundant scientific data bases on which the Mann study was allegedly based.
More importantly, when the 600 year time frame in the above graph is put in a longer 12,000 year historical framework, per the graph below, the whole hockey stick disappears entirely. Accordingly, long before the iron age (1200 to 700 BC) or even the rise of the great River Civilizations (3000 BC), which first made use of extensive man-made combustion, temperatures were often well higher than today.
That’s the “science” of the matter. And the $30 trillion economic disaster known as the Green New Deal designed to reverse so-called anthropogenic climate change advocated by Governor Nukesome and the Kamala Harris Regency is just as bogus as the claim that today’s raging wild fires in California are “a climate damn emergency”.
via ZeroHedge News https://ift.tt/3hFrW8h Tyler Durden
Putin Critic Navalny Releases “Evidence” Of Novichok Poisoning Tyler Durden
Thu, 09/17/2020 – 14:25
A few days after sharing the first photo of himself and his family from his hospital bed in Germany, Alexei Navalny and his team are back in the headlines Thursday, proclaiming that they now have “evidence” that the Russian opposition politician was poisoned with Novichok.
As we’ve noted in the past, the notion that Novichok is a feared nerve agent routinely deployed in state craft is somewhat undermined by the fact that both Navalny and Sergei Skripal, the Russian double-agent whom Moscow handed over to Britain as part of a voluntary agreement, survived their alleged attacks.
A video posted by Navalny’s team on his Instagram page showed them searching Navalny’s room at the Xander Hotel in Tomsk on Aug. 20, an hour after they were informed about his illness.
Apparently, this is how Germany got the materials, which a military lab allegedly tested to confirm the presence of Novichok. Initially, Navalny’s team claimed he had been poisoned after drinking a cup of tea at the airport. But now it’s a water bottle from his hotel room. The story just keeps changing,
“It was decided to gather up everything that could even hypothetically be useful and hand it to the doctors in Germany. The fact that the case would not be investigated in Russia was quite obvious,” the post said.
It showed his team bagging several empty bottles of “Holy Spring” mineral water, among other items, while wearing protective gloves.
“Two weeks later, a German laboratory found traces of Novichok precisely on the bottle of water from the Tomsk hotel room,” the post said.
“And then more laboratories that took analyses from Alexei confirmed that that was what poisoned Navalny. Now we understand: it was done before he left his hotel room to go to the airport.”
One of Navalny’s team members bragged to Al Jazeera that the evidence was taken “right under the KGB’s nose”.
Vladimir Milov, a former deputy energy minister and an ally of Navalny, said his team had outplayed the FSB security police with their quick thinking: “They took the evidence from under their noses and shipped it out of the country.”
In case you missed it, the suspect water bottles are highlighted in the video with red circles.
International authorities have demanded an investigation into the alleged poisoning, while Russia has maintained its innocence. So far, Navalny’s second alleged poisoning by the Kremlin in just over a year hasn’t rated on the level with the attack on the Skripals, which led to tit-for-tat diplomat expulsions and a general rupture in international relations with Russia.
via ZeroHedge News https://ift.tt/3kjY4Qy Tyler Durden
Testifying before the Senate Appropriations Committee Wednesday morning, CDC Director Robert Redfield entered further into quack doctor territory, claiming that wearing a mask protects the wearer against the novel coronavirus, even more so than a high-efficacy vaccine.
“These facemasks are the important, powerful public health tool we have,” Redfield said, while touching both sides of his mask and unconsciously contaminating it with his hands. “I might even go so far as to say that this facemask is more guaranteed to protect me against COVID than when I take a COVID vaccine,” he added.
.@CDCDirector Dr. Robert Redfield: “These face masks are the most important, powerful public health tool we have…I might even go so far as to say that this face mask is more guaranteed to protect me against COVID than when I take a COVID vaccine.” pic.twitter.com/yPdsSSQAbr
This appears to be another “scientific” evolution on masks from the “public health expert” class. At first, we were advised not to wear masks. Then, the “my mask protects you. Your mask protects me” mantra became the widely disseminated narrative. Now, masks apparently have the incredible power of protecting the mask wearer from the virus.
Redfield wrote this on August 25th the role of the mask was to protect others. Now, it protects the wearer?
In the February hearing, Redfield told Americans not to buy medical-grade masks, saying there’s “no role for these masks in the community.”
There remains zero evidence that cloth masks or the earloop masks displayed by Redfield helps to slow the spread of COVID-19 or protect the wearer from infection. No country in the world has proven a link in slowing or stopping the spread due to mask wearing mandates, which are in effect in countless nations.
Given the lack of demonstrated evidence supporting it, mask-wearing has become a cult-like religious movement in the United States, one that relies on complete subservience to total mysticism. Members of the mask movement frequently target Americans who engage in non-compliance, likening these individuals to evil, plague-carrying menaces. Redfield’s testimony will only add fuel to the mask mania that is sowing discord in America.
In his testimony, Redfield added that a COVID vaccine probably won’t be available to the general public until at least the second or third quarter of 2021.
“If you’re asking me when is it going to be generally available to the American public, so we can begin to take advantage of vaccine to get back to our regular life, I think we’re probably looking at third, late second quarter, third quarter 2021,” he testified, adding that first responders may have access to the vaccine before the end of the year.
Like many institutional bureaucracies in the federal government, the CDC has become plagued with corruption and “woke” politics. A whistleblower recently revealed that the CDC was forcing its staff to undergo “critical race theory” training.
This story is rapidly spinning out of control for @CDCgov—and still no comment from @CDCDirector. We should be fighting a pandemic, but our Center for Disease Control is violating a presidential order to push “critical race theory.”https://t.co/KlWRRfKW6n
Under Redfield’s leadership, the CDC dropped the ball on preparing Americans for the U.S. coronavirus outbreak, as shown through internal emails displaying the bureaucracy as an organizational mess.
* * *
Thanks for reading! I would be honored if you are willing to support my work and subscribe to The Mass Illusion, my newsletter for people concerned about our “new normal.”
via ZeroHedge News https://ift.tt/3iH5kp5 Tyler Durden
West Coast Wildfires Causing “Smoky Skies” As Far East As New York City Tyler Durden
Thu, 09/17/2020 – 13:45
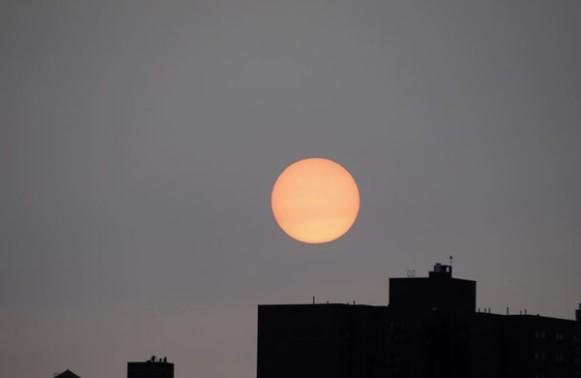
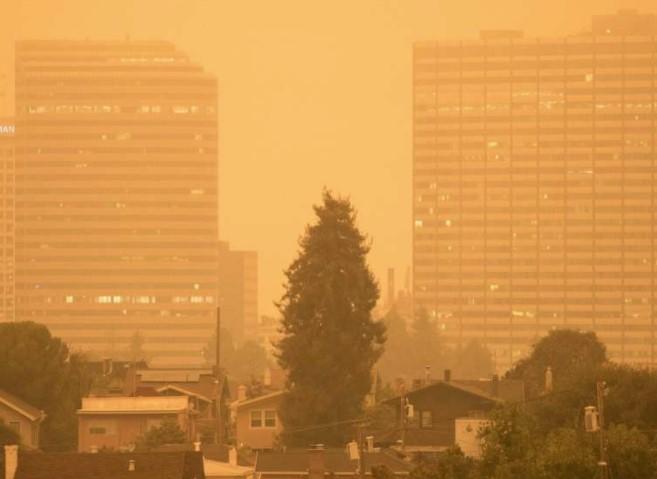
Just days ago, we posted photographs of just how stunning the effects of the California wildfires had gotten on the west coast. The photos showed bright orange skies, painting a scene that looked more suited for Mars than the United States.
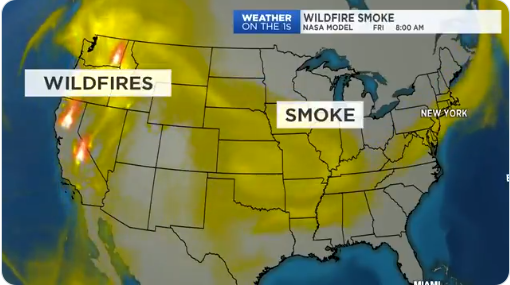
Now the effects of the wildfires are becoming so profound they can be seen all the way across the country in New York City. Photos posted yesterday to Gothamist show “advancing plumes of smoke” as a result of the wildfires. They have turned the skies smokier looking than usual.
The National Oceanic and Atmospheric Administration says that smoke from the fires moved east this week and meteorologists expect that the effects will be even worse throughout the week, until dissipating on Friday due to an incoming cold front.
The smoke is traveling between 15,000 and 20,000 feet overhead, according to New York Metro Weather. This means that ground-level area shouldn’t be impacted. The NWS has said there could be a “yellow or brown tinge” to the sky.
That’s exactly what it is! In fact, smoke is expected to be even more noticeable tomorrow. You can see the smoke on satellite —> pic.twitter.com/73erjttVXN
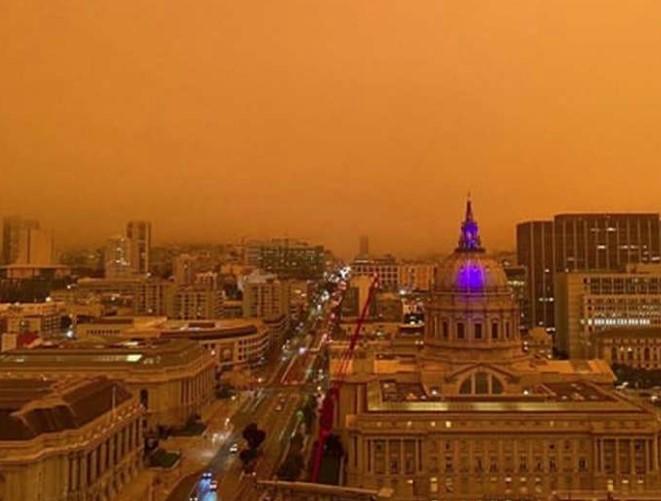
Recall, eerie, dark orange clouds enveloped San Francisco and the Bay Area last week as a result of nearby wildfire smoke entering the atmosphere. Stunning photos were posted by SF Gate last Wednesday showing what looks like a Martian sky, which was yellow on Tuesday, but darkened in color overnight to orange as a result of smoke being pushed inland off the Pacific Ocean.
According to the, at 10:45 AM local time, “it looked as if it were dawn”.
UCLA climate scientist Daniel Swain said on Twitter: “Extremely dense & tall smoke plumes from numerous large wildfires, some of which have been generating nocturnal pyrocumulunimbus clouds (‘fire thunderstorms), are almost completely blocking out the sun across some portions of Northern California this morning.”
via ZeroHedge News https://ift.tt/3kEiC6D Tyler Durden
The US economy is completing the sixth month of the Pandemic. So how is the recovery going, as seen by the near-real-time indicators that have sprung up as a result of the Pandemic? The raw unadjusted data of these indicators compare daily or weekly data this year to how it was just before the Pandemic, or how it was at the same time last year.
There is some roughness in this data. For example, this year, Labor Day fell on September 7; last year, it fell on September 2 (prior week). So there are some wild fluctuations as Labor Day data gets compared to non-Labor Day data. Independence Day was similar. But that’s raw data.
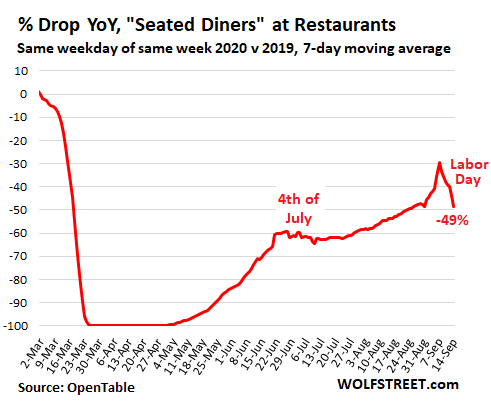
Restaurants, “seated diners”: -49%
Online reservation service OpenTable provides daily data on “seated diners” – how many people actually sit down in restaurants to eat and drink compared to the same weekday in the same week last year – including walk-ins and those who made reservations online or by calling. This data is based on thousands of restaurants in the US that share that information with OpenTable. I used a 7-day moving average to smoothen out the day-to-day fluctuation. The date-mismatch of Labor Day caused the spike in the chart below. Currently, after six months of Pandemic, “seated diners” are still down 49% through September 14, from where they’d been last year at this time:
In the chart above, that plunge to -100% (meaning zero seated diners) occurred during the lockdown when sit-down restaurants were closed. Then the recovery took off in its uneven manner, including some backtracking after Independence Day.
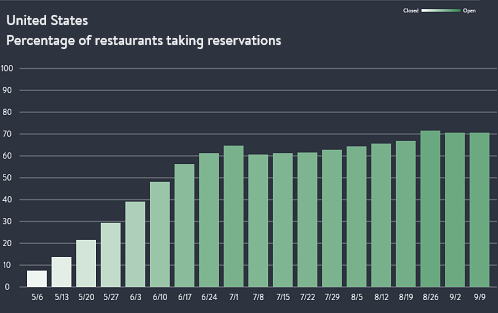
According to OpenTable data, about 70% of the restaurants that took reservations before the pandemic are now taking reservations again, up from zero percent in April, and there has not been any improvement over the past three weeks, and not a lot of improvement since early July (chart via OpenTable):
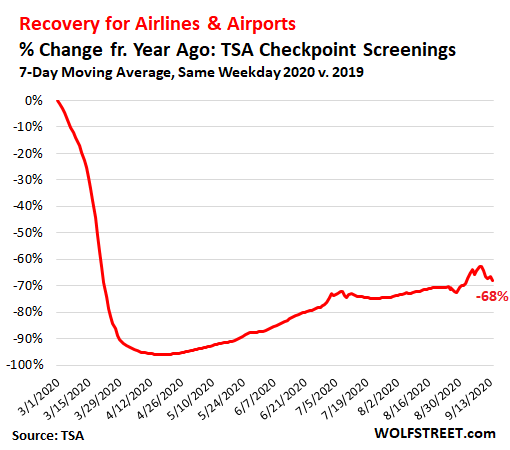
Airlines, Airports, & Related Businesses: -68%.
The air passenger count entering the security zones of US airports is still down over 68% (-69.7% on September 14), according to TSA airport screenings. Airport operations, restaurants and shops at airports, airport rental cars, and the rest of the airport ecosystem are on a similar trajectory. Beyond the date-mismatch around Labor Day, demand has improved only slightly since early July:
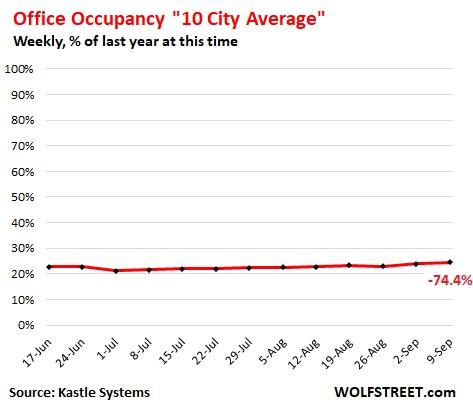
Going to the Office: -74.4%.
This is a measure of the shift to work-from-home mixed with employment reductions of office workers, and sheds light on what all the businesses face that cater to office workers, such as cafes, restaurants, shops, barbershops, hair saloon, and the like. And it sheds light on what the office segment of commercial real estate is facing.
The data from Kastle Systems, provider of access systems for 3,600 buildings and 41,000 businesses in 47 states, represents a large sample of how many people are entering offices each day. Its “10 City Average” of office occupancy is currently at 24.6% of the pre-Pandemic level in early March, and has not significantly improved in over the past few months, meaning it’s still down by 75.4% (the available average data only goes back to June):
The weekly “Back to Work Barometer” by Kastle shows each of the 10 metros separately: At the high end, the Dallas metro (38.3% of pre-Pandemic) and the Los Angeles metro (32.4% of pre-Pandemic); at the low end, the San Francisco metro (13.7% of pre-Pandemic) and the New York metro (13.8% of pre-Pandemic), meaning that office occupancy in those 10 metros is still down between 61.7% (Dallas) and 86.3% (San Francisco). I added the black horizontal line, reflecting the current value of the top-10-city average (click on chart to enlarge):
Consumer and worker visits to “Places of Commerce.”
How many people are going to stores, malls, restaurants, hotels, movie theaters, airports, hospitals, other places of commerce, and other points of interest, and to work locations? The AEI’s weekly Foot Traffic Index for 40 metro areas tracks this based on cellphone GPS data from Safegraph.com.
Each line, representing one of the 40 metros, compares foot traffic in the current week to where visits were in the week ended January 15. A value of 100% would mean foot traffic is back to the January “old normal.”
The top bold redlines are Kansas City, Jacksonville, Riverside-San Bernardino, Seattle, Los Angeles, San Francisco, in that order, with Kansas City being the red line at the top (77%) and San Francisco being the green line at the bottom (45%). This means visits to places of commerce in Kansas City are 77% of where they were in the week ended January 15; and in San Francisco, visits are 45% of where they were (click on the chart to enlarge it):
These near-real-time measures don’t track the entire economy, such as manufacturing, oil-and-gas drilling, financial services, insurance, and many other aspects. But the data show that certain physical aspects of the economy – where people are physically going to do business in some manner – are still very far from the “old normal.”
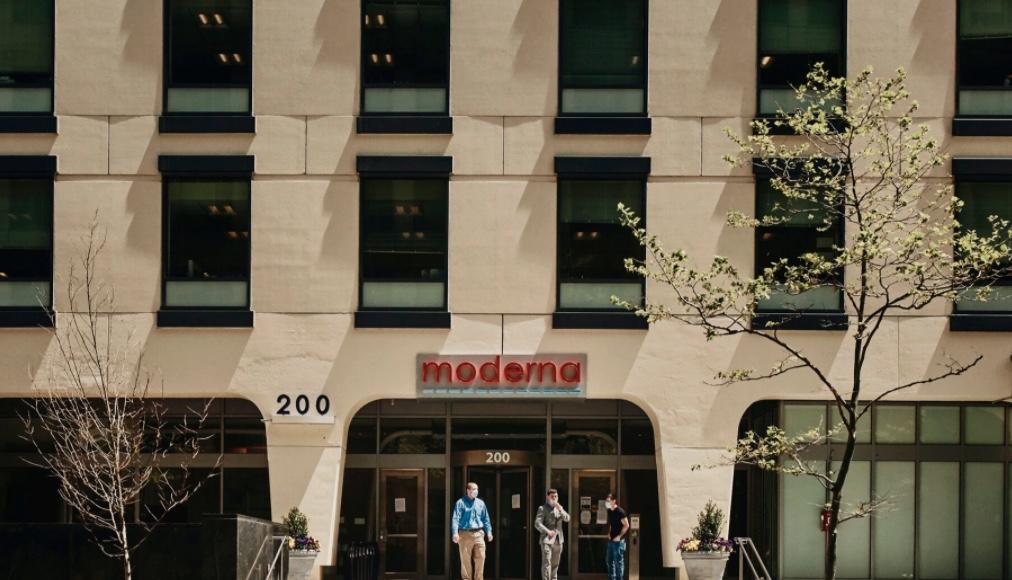
Moderna Publishes COVID-19 Vaccine Trial “Blueprint” To Quiet Concerns About Rushed Approval Tyler Durden
Thu, 09/17/2020 – 13:05
With the AstraZeneca-Oxford vaccine study still paused in the US, reports about a sickened patient in the UK have undermined credibility with the public at an extremely delicate time. Vaccine maker are trying to achieve emergency regulatory approval, then produce hundreds of millions of doses, all by mid-next year, at the latest.
In reality, nobody can say for certain how long it will take for a vaccine to be widely. But in the meantime, companies like Moderna, which has seen its share price explode this year after taking nearly $1 billion in US taxpayer money (though that hasn’t stopped it from considering a price per dose at the upper end of the range), are doing everything they can to build back that trust.
So Dr. Tal Zaks, Moderna’s chief medical officer, consulted an outside expert, who recommended that the company be more “transparent to the point of discomfort.”
In keeping with that mantra, the company has released a 130+ page status report on its Stage 3 trials.
“If what you want to do is see the protocol – here,” Dr. Zaks said.
Moderna hopes competitors like Pfizer, which is developing a vaccine candidate in a joint project with Germany’s BioNTech, will adopt a similarly “transparent” approach. The company announced earlier this week that it’s trials have been running swimmingly.
The release of the company’s vaccine trial protocols coincided with a call to investors on Thursday.
Not all the feedback was positive. One independent research quoted by the NYT said Moderna risks exaggerating the vaccine’s effectiveness with how it processes the data.
Dr. Eric Topol, a clinical trial expert at Scripps Research in San Diego, gave the company “big kudos” for sharing the information, but said that he was disappointed by some of the details. For example, the company intends to include in its data people who developed relatively mild cases of Covid-19. Dr. Topol said more compelling evidence of the vaccine’s effectiveness would be produced if the company counted only moderate to severe cases.
In addition, the protocol allows for the possibility of stopping the trial early after a relatively small number of cases. Stopping early could lead to an exaggerated perception of the vaccine’s efficacy, and could also miss safety problems that could turn out to be significant later if the vaccine is given to millions and millions of people.
“Take the time, the extra weeks,” Dr. Topol said. “No shortcuts. Nobody will regret it. I’ve been doing clinical trials for decades. I don’t know if there’s ever been a more important one than this one. I’d like to see it done right, and not stopped early.”
Dr. Zaks added that he’s “proud” of what’s going on: “I’m proud of doing that…I don’t think there’s much there that we’re disclosing that hasn’t already been spoken to, but let the public be the judge of that.”
Below, we have summaries of the most important takeaways from the protocols, culled from a NYT report on the release (text courtesy of the NYT).
The company’s coronavirus vaccine, developed in collaboration with scientists from the National Institutes of Health, was the first to be tested in humans. The Phase 3 study now underway has enrolled more than 25,000 of its intended 30,000 volunteers, and Dr. Zaks said the enrollment should be complete in the next few weeks.
About 28 percent of the participants are Black, Latino or from other populations that have been particularly hard hit by the disease. A diverse enrollment has been considered essential to make sure that the findings apply to people from as many backgrounds as possible.
Half the participants receive the vaccine, and half a placebo shot consisting of salt water, with neither the volunteers nor the doctors treating them knowing who gets which. Two shots are needed, four weeks apart. Then the participants are monitored to see if they develop symptoms of Covid-19 and test positive for the virus.
Side effects of the vaccine are also tracked, with participants recording symptoms in electronic diaries, taking their own temperatures, making clinic visits and receiving periodic phone calls to assess their condition. In earlier studies the vaccine has caused transient reactions like a sore arm, fever, chills, muscle and joint pain, fatigue and headaches.
To determine the vaccine’s efficacy, Covid-19 cases are counted only if they occur two weeks after the second shot. Some patients are already two weeks beyond the second shot, but Dr. Zaks said he did not know if any trial participants had contracted the disease yet.
A total of 151 cases — spread between the vaccine and placebo groups — would be enough to determine whether the vaccine is 60 percent effective. The Food and Drug Administration has set the bar at 50 percent.
Moderna is developing a vaccine based on a new technique that uses messenger RNA to produce viral proteins in the body that would help it fight off the virus.
Why do vaccine-makers feel the need to justify these projects like this? Well, if you don’t know, try asking Bill Gates.
via ZeroHedge News https://ift.tt/32GvWB7 Tyler Durden