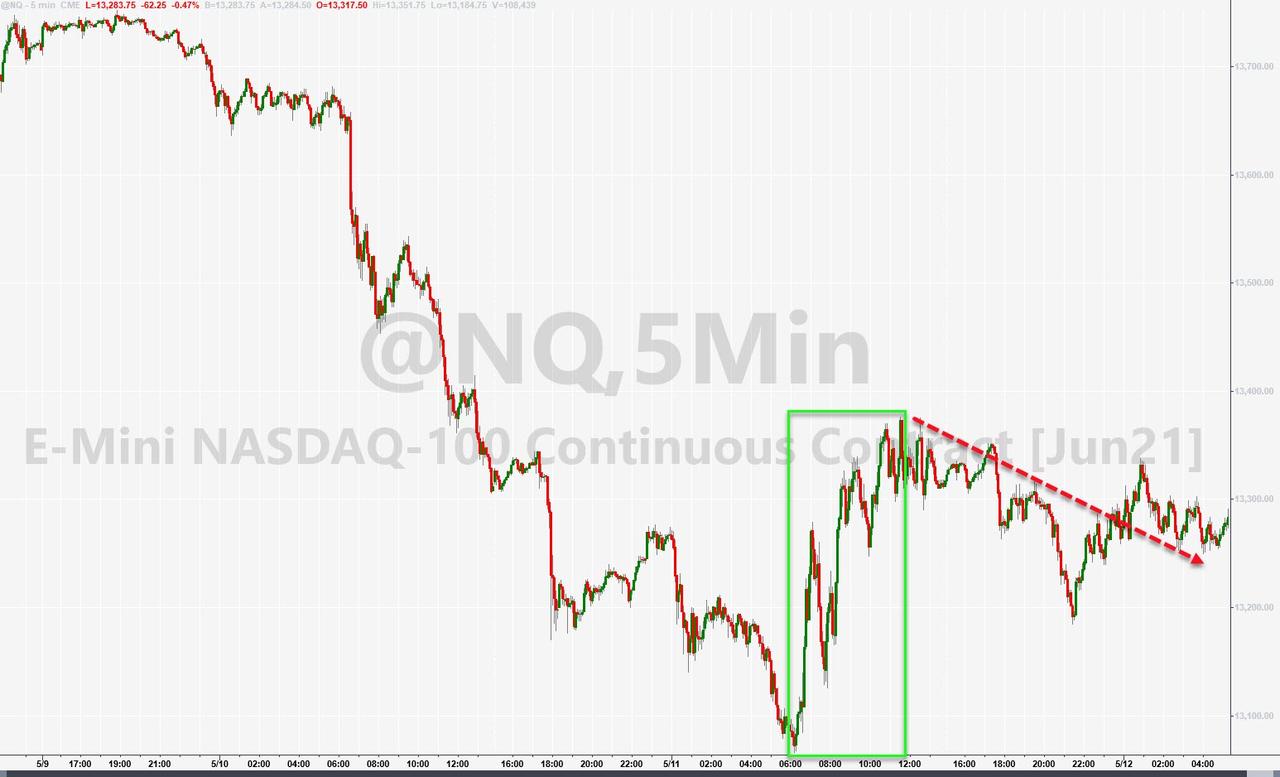
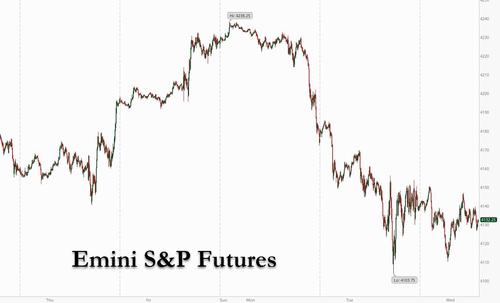
US equity futures continued their slide, and a sell-off in global shares extended to its longest losing streak in two months on Wednesday as investors awaited the latest inflation figures to assess the risk that soaring prices will snuff a recovery in the world’s biggest economy, prompting bets on earlier interest rate hikes and higher bond yields.
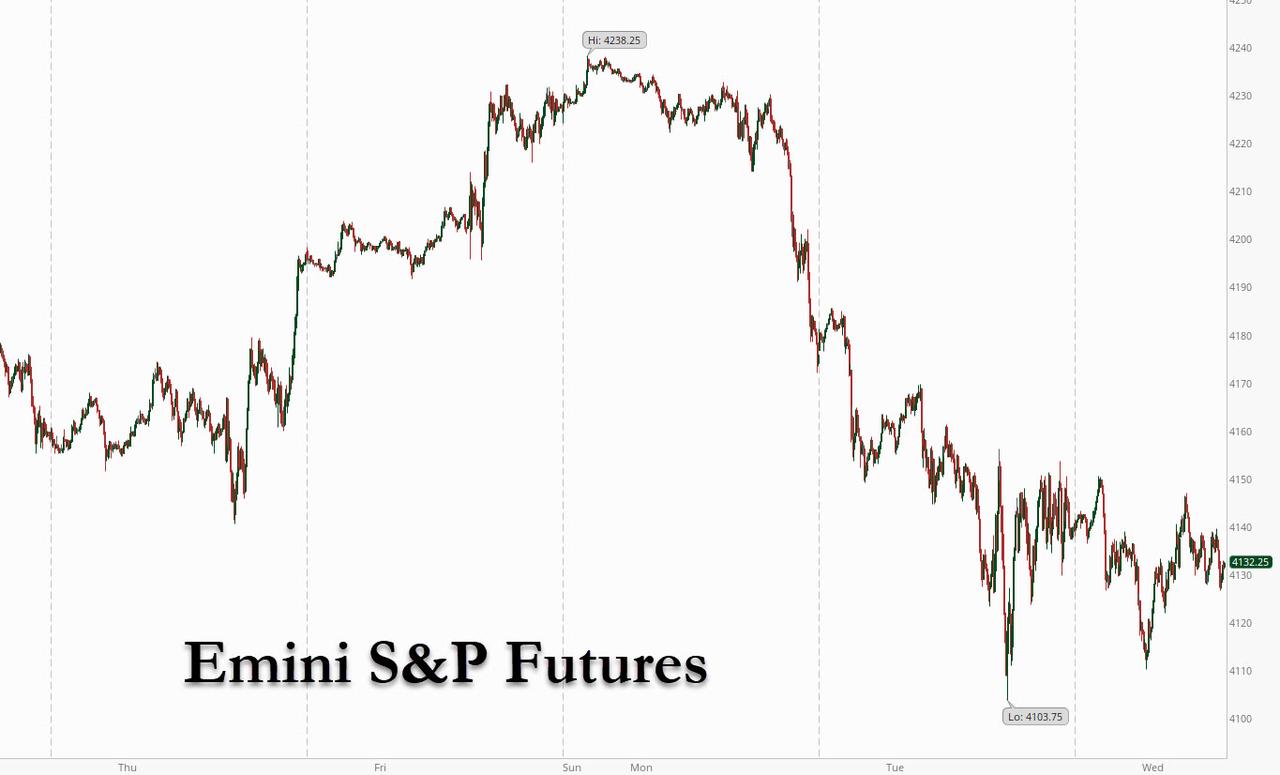
At 7:15am Dow e-minis were down 136 points, or 0.4%, S&P 500 e-minis were down 17 points, or 0.42%, Nasdaq 100 e-minis were down 84 points, or 0.62% while futures tracking the small-cap Russell 2000 index dropped 1%. The dollar advanced with Treasuries.
Notable pre-market movers included:
- FAAMG mega-caps – Facebook, Amazon.com, Apple, Google and Microsoft – which all fell between 0.4% and 0.9%.
- Streaming platform FuboTV surged 20% after it raised its full-year revenue and subscription forecasts.
- Electronic Arts Inc inched up 1.2% as it forecast annual adjusted revenue above analysts’ estimates, betting that demand for its titles like “FIFA 21” and “Apex Legends” would stay strong.
- Upstart Holdings jumped 23% in premarket trading after the online lending platform published an earnings outlook that exceeded analyst expectations
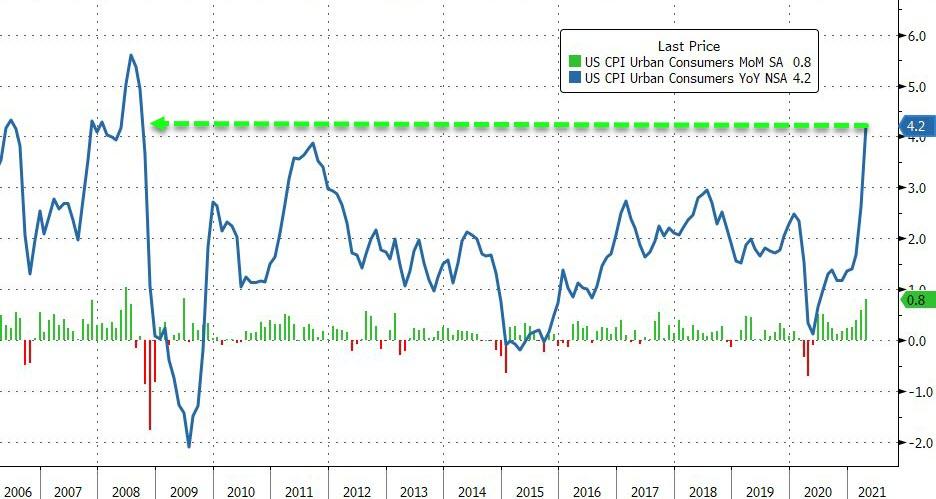
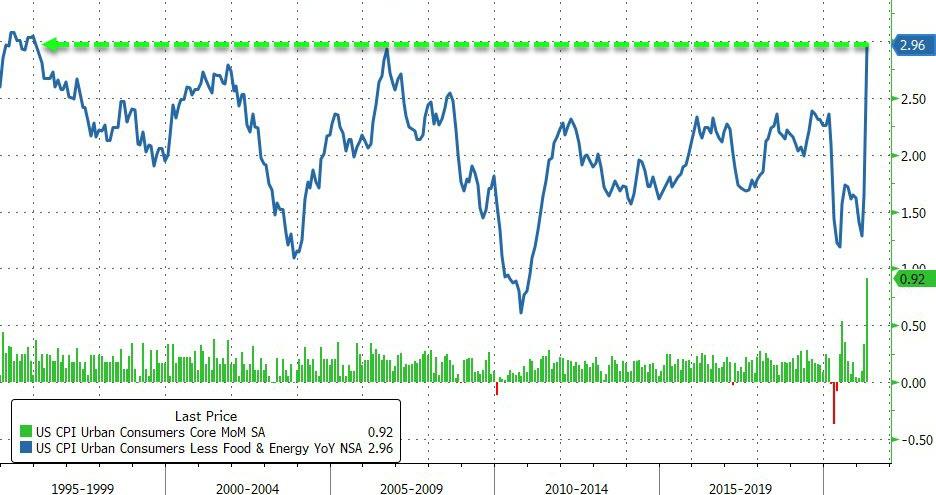
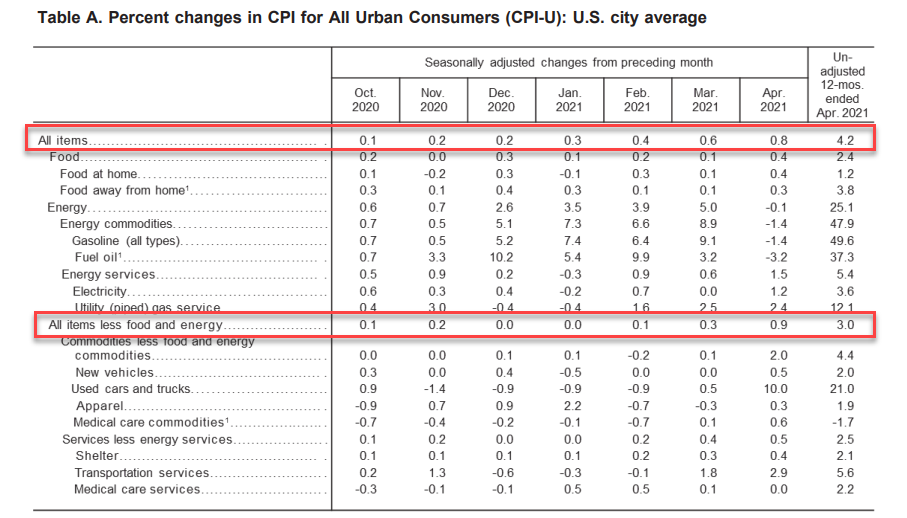
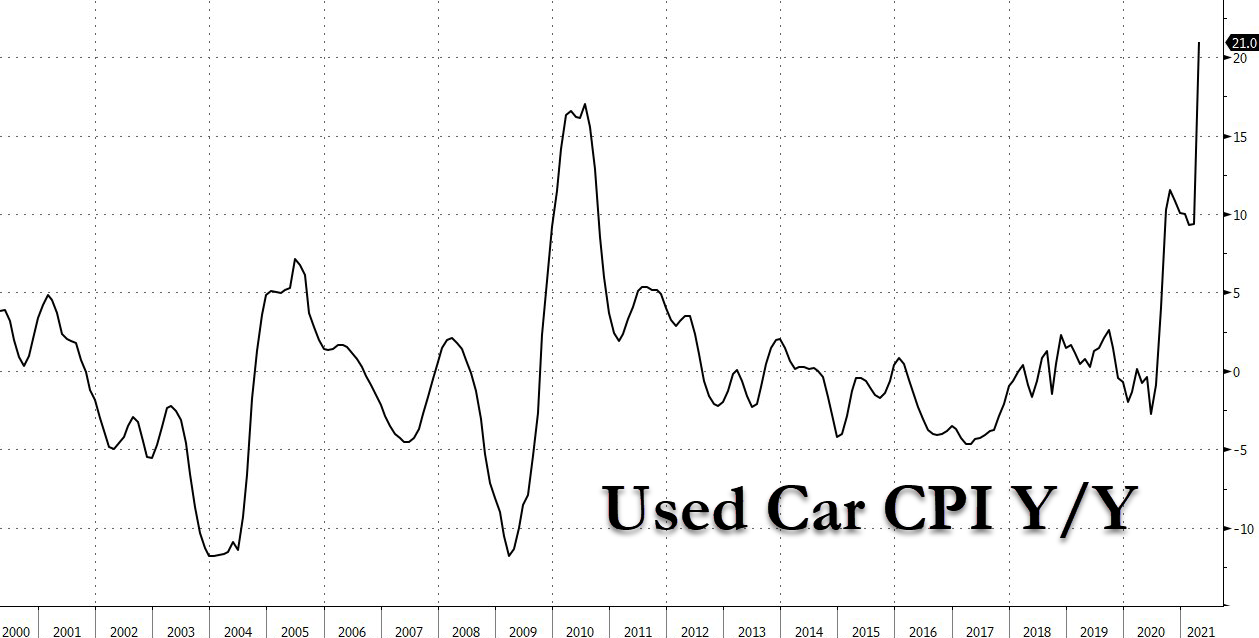
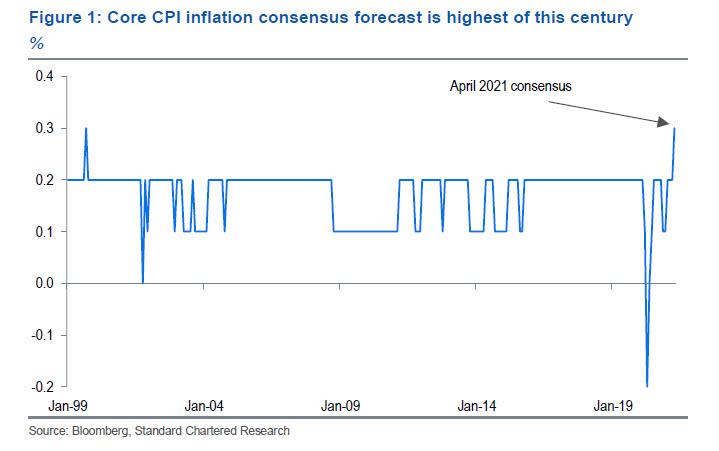
The tech-heavy Nasdaq 100 underperformed after hedge funds emerged on Tuesday to cover their shorts, although reflation fears returned with a vengeance overnight. Investor focus is locked on the U.S. CPI report to be released at 830am with analysts expecting a 3.6% lift in year-on-year prices, boosted by last April’s low base. More notable is the sequential jump in core CPI which at 0.3% avoids volatile food and energy prices as well as the 2020 base effect, and will be the biggest monthly increase this century.
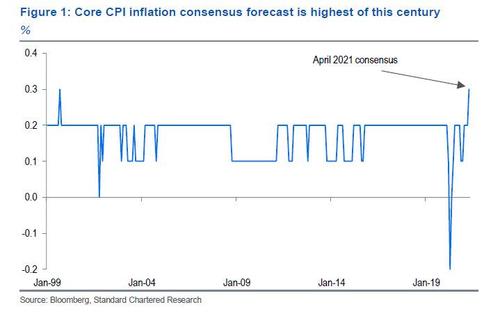
Looking at the CPI print, consensus expects a rise in the year-on-year reading to +3.6%. That would be the highest annual CPI number since September 2011 if realised, and up from 2.6% in March. Since the underwhelming payrolls release on Friday, the market narrative has turned to the question of whether labor supply constraints are the issue, which could prove inflationary moving forward.
The expected “big jump” in the April consumer price growth will be largely driven by volatile food and energy prices, as well as base effects, according to Michael Hewson, chief market analyst at CMC Markets in London, who probably did not see the chart above. “The Federal Reserve would have us believe that today’s move higher is likely to be transitory,” he said. “Unfortunately, we won’t know if they are right for another 2-3 months, which means we can probably expect to see further gyrations in global equity markets until the picture becomes clearer.”
Soaring commodity prices and signs of a labor shortage have fueled worries over rising prices this week, triggering a broad selloff that sent the S&P 500 2% below its record closing high on Friday, even as the Fed has reassured that any inflationary pressures would be transient.
Analysts said a combination of inflation fears and some investors cutting their exposure to overstretched stocks or sectors was behind the recent downturn.
“It’s a battle of two narratives: one of reflation and roaring 20s, with fiscal stimulus creating higher levels of growth; and the other is the lower-for-longer idea where ultimately inflation proves hard to generate and interest rates stay at low levels,” Kiran Ganesh, head of multi asset at UBS Global Wealth Management in London. “These two narratives are conflicting and are in investors’ minds at the same time.”
The said, other analysts doubted the broader equities sell-off would extend much further in a world of easy accommodative policy and fiscal largesse: “Despite the severity of the moves, we sensed limited panic in our client conversations with many using (the) weakness as an opportunity to buy the dip, particularly in the value orientated areas e.g. banks, energy and insurance,” JPMorgan analysts wrote.
European stocks rose, lifted by gains in miners and optimism about economic re-openings. The Stoxx Europe 600 Index gained 0.3% led by London’s FTSE 100 which was buoyed by data showing Britain’s pandemic-battered economy grew more strongly than expected in March. Basic-resources companies led gains while the tech industry underperformed. Diageo jumped 3.5%, the most in more than a month after the world’s biggest distiller and producer of Johnnie Walker said it would restart a share buyback. Bayer advanced the most in two months after better-than-expected earnings. European tech stocks trade little changed ahead of a key U.S. inflation data release, following declines of at least 2% on Monday and Tuesday. Prosus gets a boost from Naspers’s share swap plans and pandemic winners recover, while Jst Eat Takeaway falls after rival Delivery Hero plans to re-enter German market.
Here are some of the biggest European movers today:
- Diageo shares rise as much as 3.6%, the most since Feb. 2. The distiller’s trading update is upbeat, with a good performance across the board, RBC (sector perform) writes in a note.
- Commerzbank shares rise as much as 9%, hitting the highest since February 2020. The lender’s strong fee momentum, focus on costs and better capital ratio should be taken positively, RBC (sector perform) writes in a note.
- Evolution shares gain as much as 5.9% and founder and chairman Jens von Bahr says he thought the timing of the Osterbahr Ventures stake sale was “fairly good” after several banks and brokers had testified to strong international demand in past weeks, newspaper Dagens Industri reports, citing an interview.
- Prosus shares advance as much as 3.6% and global tech investor Naspers climbs 5.5% after the companies announced a share-swap plan for Naspers investors.
- Ubisoft shares slump as much as 9.2% after results, with Jefferies (buy) saying that the video game maker’s growth and margin guidance may disappoint investors even against low expectations.
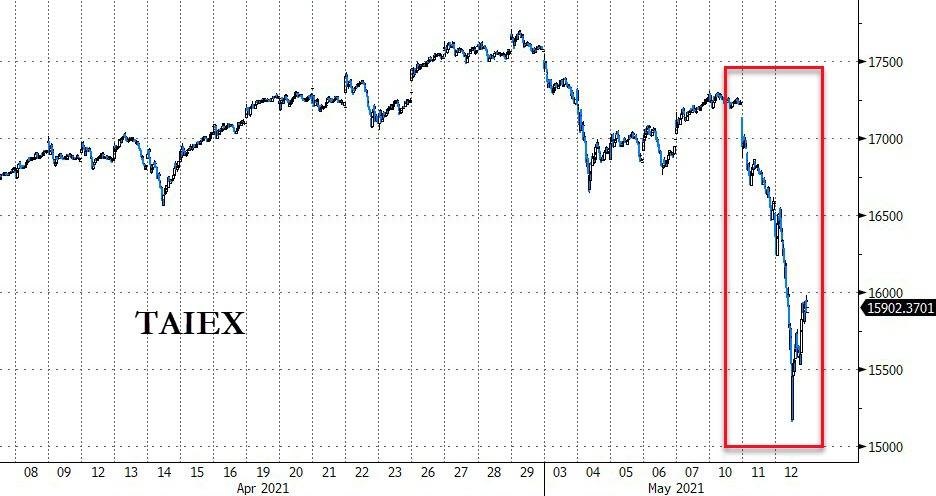
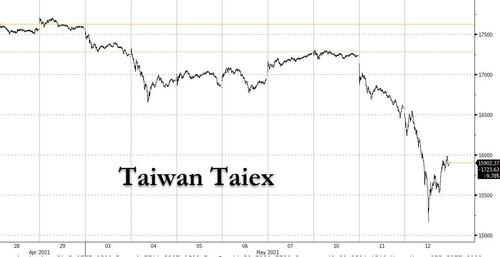
Earlier in the session, Asian stocks tumbled for a second day, hit by declines in chipmakers rattled by signs of a resurgence in global inflation as well as a massive slump in Taiwan stocks. The MSCI Asia Pacific Index extended its two-day drop to almost 3%, heading for its biggest such decline since Jan. 29, while MSCI’s broadest index of Asia-Pacific shares outside Japan slumped 0.9%, having earlier touched its lowest since March 26.A subgauge of information-technology firms including Taiwan Semiconductor Manufacturing and Samsung Electronics contributed most to the day’s share price losses. Japan’s Nikkei reversed early gains to shed 1.9%, a day after the Topix tumbled more than 2% without the BOJ stepping in to buy ETFs.
The highlight of the Asian session however were Taiwan stocks which plunged as much as 8%, the most in 14 months to levels seen in February on fears it may raise its COVID-19 alert level in coming days, which would lead to closure of shops dealing in non-essential items as infections rise. Fears of a further tightening of coronavirus-linked restrictions added to pressure from the global tech sell-off in dragging shares like TSMC down. The Taiwan Stock Exchange Weighted Index lost as much as 8.6% in morning trading, in its worst intraday loss since 1969.
“Investor anxiety continues to hang over markets,” said Masahiro Ichikawa, chief market strategist at Sumitomo Mitsui DS Asset Management. “People appear conscious of the U.S. inflation trends.” Investors are worried that price rises will endure and force the Federal Reserve into tightening policy sooner than current guidance suggest. The yield on 10-year Treasuries advanced two basis points, climbing for its fourth straight day, the longest winning streak since March 19, ahead of U.S. CPI data.
“One may place caution on the 1.75% level for 10-year yields, which constitutes its one-year high,” Yeap Jun Rong, a market strategist at IG Asia Pte. wrote in note. “A break above that level may potentially trigger further market volatility on inflation concerns. The inflation narrative may continue to linger in the markets for the months ahead.”
China stocks bucked a broad loss in Asian shares to end higher on Wednesday, after the central bank downplayed inflation concerns and promised to maintain sufficient liquidity in a report. The benchmark CSI 300 Index climbed 0.4% at the close, driven by the strength in the health care and energy sectors. Walvax Biotechnology and PetroChina were among the biggest contributors to the gauge’s gain. Morgan Stanley has upgraded the Hong Kong-listed shares of China Petroleum & Chemical Corp to overweight and lifted targets on the stock and PetroChina on higher earnings estimates, after the firms’ “stronger-than-expected” first-quarter results. The rise in Chinese shares contrasted with losses in other major stock markets in Asia on concern about growing signs of global inflation. The People’s Bank of China in its first-quarter monetary policy implementation report published late Tuesday said that higher global commodity prices have little impact on domestic consumer inflation. It also promised to keep liquidity reasonably ample
Hong Kong-listed technology stocks also provided another silver lining to the otherwise gloomy markets. The Hang Seng TECH Index rose 2.8%, marking its biggest gain in more than a month, with Tencent Holdings, JD.com and Meituan providing it with its biggest boosts.
In rates, US Treasury yields remained stuck in a tight range with the yield on benchmark 10-year Treasuries drifting lower to 1.6130%, below the recent peaks of late March levels and far from the 1.9% level at the start of 2020 before the coronavirus pandemic. Yields were lower by ~1bp across long-end of the curve, flattening 5s30s by 0.6bp; 10-year yields around 1.61% lag gilts by ~1.5bps. Treasury gains were led by long-end, flattening the curve ahead of April CPI data and auction of a new 10-year note.Today, the Treasury auction cycle continues with the sale of $41BN in 10-Year notes at 1pm ET ahead of a sale of $27BN in 30-years on Thursday.
Euro zone bond yields held below recent highs touched on Tuesday. Germany’s 10-year yield was down 1 basis point to -0.17%, after rising to the highest since March 2020 at -0.152% on Tuesday. Italy’s 10-year bond yields climbed above 1% for the first time in eight months, reigniting concern over the nation’s debt burden amid prospects for less ECB support later this year
In FX, the Bloomberg Dollar Spot Index inched higher as the greenback advanced against most of its Group-of-10 peers. Curiously, the equity rout barely helped drive any safe haven flows into the greenback even as futures pointed to another negative open for Wall Street. “What is unusual about the last two days is that the equity-market angst did not provide the U.S. dollar with a notable lift,” said Alvin T. Tan, head of Asia FX strategy at RBC Capital Markets.
The euro touched its weakest level this week against the dollar; 10-year Treasury yields inched lower after rising for four consecutive days. The pound pared small losses after U.K. GDP data rose 2.1% following a revised 0.7% increase in February, versus a median estimate for a 1.5% increase; it was later weighed down by a Bloomberg News report saying France aims to delay U.K. financial firms’ access to the European single market. The currencies of major natural resource suppliers such as Canada have been buoyant amid rising commodity prices. The loonie was not far from a 3-1/2-year high of C$1.2078. The Australian and New Zealand dollars decline; Aussie 10-year yields jumped after the government announced a higher-than-expected budget deficit, while N.Z. yields climbed after low prices were offered into the QE buying operation.
In commodities, oil prices were higher, with U.S. crude adding 1% to $65.94 a barrel. Brent crude added 0.9% to $69.20 per barrel. Copper prices rose and were not far from a record high hit earlier this week, with three-month copper on the London Metal Exchange adding 1.1% to $10,579 a tonne. Spot gold was 0.2% lower at $1,832 an ounce. In cryptocurrencies, ether hit a fresh record high touched on Monday and was last at $4,315.41. The value of the second-biggest digital token has surged over 5.5 times so far this year.
To the day ahead now, and the highlight will be the aforementioned April CPI reading from the US. Otherwise, data releases include the US monthly budget statement for April. Central bank speakers include BoE Governor Bailey, the Fed’s Clarida, Bostic and Harker, and the ECB’s Centeno. Otherwise, President Biden will be meeting with Congressional leaders from both parties, while the European Commission will be releasing their latest economic forecasts.
Market Snapshot
- S&P 500 futures down 0.3% to 4,134.50
- STOXX Europe 600 up 0.29% to 437.87
- MXAP down 1.0% to 202.43
- MXAPJ down 0.8% to 679.22
- Nikkei down 1.6% to 28,147.51
- Topix down 1.5% to 1,877.95
- Hang Seng Index up 0.8% to 28,231.04
- Shanghai Composite up 0.6% to 3,462.75
- Sensex down 0.7% to 48,837.18
- Australia S&P/ASX 200 down 0.7% to 7,044.87
- Kospi down 1.5% to 3,161.66
- Brent Futures little changed at $68.50/bbl
- Gold spot down 0.4% to $1,830.44
- U.S. Dollar Index up 0.14% to 90.27
- Euro down 0.1% to $1.2134
- German 10Y yield fell 0.11 bps to -0.172%
Top Overnight News from Bloomberg
- Trading in the U.S. Treasury bill market has been drying up, as more cash looks for a home and supply dwindles. Six-week average volumes have fallen to just $473 billion, near the lowest since the data series began in March 2020, according to figures from the Financial Industry Regulatory Authority’s Trace system. The slump comes despite volumes in the broader Treasury market remaining robust, comfortably above equivalent average activity levels seen last year
- Heightened financial stability risks surrounding China Huarong Asset Management Co. could prompt the Chinese central bank to proceed more cautiously in tapering its monetary support this year
- Israel unleashed a relentless attack on the Hamas-ruled Gaza Strip after a massive rocket barrage over the country’s commercial heartland, as the death toll climbed and the sides edged closer to all-out war
- The International Energy Agency said the supply glut created by the global pandemic has cleared, even as demand suffers a blow from a resurgence of the virus in India
- The European Commission upgraded the euro area’s growth for this year to 4.3% from 3.8% after taking account of the 800 billion-euro ($971 billion) joint recovery fund for the first time. Output in the European Union’s 27 member states is now expected to reach its pre- pandemic size by the end of this year, earlier than initially thought
A quick look at global markets courtesy of Newsquawk
Asian equity markets were subdued following the lacklustre performance in the US where the DJIA suffered its worst day in over two months and sentiment remained hampered by ongoing inflationary concerns ahead of the looming US CPI data, although losses in the Nasdaq were only marginal after the tech sector spent most the session nursing its recent underperformance. ASX 200 (-0.7%) traded negative with nearly all sectors on the backfoot aside from tech as it found some solace from the rebound in US counterparts, while a jump in CBA’s March quarter profits and the recent budget announcement including spending of AUD 589.3bln for next fiscal year did little to spur risk appetite. Nikkei 225 (-1.6%) failed to hold on to opening gains as focus centred on a deluge of earnings releases with Nissan among the biggest decliners with double-digit percentage losses after it reported another substantial FY net loss and guided it will remain in the red for its next FY results. Conversely, Sharp and SoftBank Corp were underpinned after posting improved results and Toyota clawed back initial losses and then some, following its earnings and a JPY 250bln share buyback announcement, while focus now turns to SoftBank Group which is reportedly set to post a record JPY 4.9tln fiscal year profit. Hang Seng (+0.7%) and Shanghai Comp. (+0.6) succeeded in shrugging off the losses in their regional peers with both indexes initially kept afloat following the recent PBoC Q1 Monetary Policy Implementation Report which stated the central bank will further guide real lending rates lower, while reports also noted that China’s Sinovac COVID-19 vaccine was found to be highly effective in a real-world study with 100% effectiveness against preventing deaths and the UN also upgraded its Chinese GDP growth forecast for this year to 8.2% from 7.2%. TAIEX (-4.3%) was today’s biggest mover with intraday losses of 8% and selling exacerbated by reports that stricter COVID measures could be announced in the coming days and after the index slipped into correction territory. Finally, 10yr JGBs were subdued despite the mostly negative risk tone with prices constrained following the bear steepening stateside and amid the lack of BoJ presence in the market, while Australian government 10yr bond yields were also firmer after the recent budget announcement and with the RBA just purchasing semi-government bonds today.
Top Asian News
- China Stocks End Higher After PBOC Downplays Inflation Concern
- U.S. Agrees to Remove Xiaomi From Blacklist After Lawsuit
- More Than 40% of Hong Kong Expats in AmCham Survey May Leave
Major European bourses trade flat/directionless (Euro Stoxx 50 +0.1%) following a somewhat lukewarm cash open and directionless APAC session as traders bide time heading into US CPI, with the 10yr Note Auction also eyed as an inflation expectation gauge. US equity futures in contrast post modest losses in early European trade with some underperformance portrayed in the RTY (-1.2%) vs NQ (-0.6%) and ES/YM (-0.4%). The tone across markets has been one of caution and positioning rather than risk appetite/aversion as macro newsflow also remains scarce head of the main events. Back to Europe, the UK’s FTSE (+0.6%) outpaces peers as its heavyweight mining names lift the index in tandem with gains across base metals, whilst broad-based modest gains are seen across Euro Zone bourses, featuring the SMI faring slightly better amid a firm healthcare sector. Basic resources and Healthcare are the top-performing sectors at the time of writing whilst Tech and Autos reside on the other end of the spectrum, and with no clear overarching theme as a deluge of European earnings cloud that picture. Earning-related movers today include the likes of Commerzbank (+7.9%), Bayer (+4.3%), Allianz (Unch), Merck (-0.3%), RWE (+1.6%), Deutsche Telekom (+2%), EDF (2.2%), Carrefour (-1.4%), and ABN AMRO (8.9%), with the latter also noting that net interest income was impacted by continued pressure on deposit margins and lower corporate loan volumes as the CIB non-core portfolio was wound down further. Elsewhere, Prosus (+2.5%) is firmer as it announced a voluntary offer to acquire 45.4% of Naspers shares. On completion, it is expected to more than double the Prosus free float’s effective economic interest in the group’s underlying assets, improving the stock’s liquidity. Finally, Flutter Entertainment (-3.0%) is lower as the CEO of FanDuels, the unit up for a spinoff, left his position.
Top European News
- U.K. Goods Trade Crawls Back Amid Brexit Slump, Pandemic Turmoil
- ECB Compromise on Bond-Buying Might Be Brokered by Summer Lull
- Top Private Markets Banker Toledano-Koutsouris to Leave UBS
- Crypto’s Anonymity Has Regulators Circling After Colonial Hack
In FX, it’s becoming a recurring pattern as the Dollar continues to lick wounds in wake of last Friday’s big NFP miss, but encounters heavy offers into upticks within the overall bear trend. Indeed, having survived a more sustained bout of downward pressure yesterday, the Buck has clawed back losses, and particularly vs high beta currencies and the commodity bloc that have outperformed on strength in underlying prices of late. However, the index has faded yet again from a higher recovery peak just shy of 90.500 and is hovering around 90.300 between 90.415-176 parameters vs Tuesday’s 90.359-89.979 range and 90.342-032 intraday band. So, from a technical perspective the latest rebound could be deemed relatively constructive, but US CPI looms and in similar vein to the aforementioned jobs data, market expectations are elevated to leave ample room for disappointment. Also ahead, another slew of Fed officials are scheduled to orate and the second leg of this week’s Quarterly Refunding comprises Usd 41 bn 10 year notes that may have more bearing for Treasuries than the inflation update.
- NZD/AUD – As noted above, the Aussie and Kiwi are bearing the brunt of the Greenback revival, with Nzd/Usd retreating below 0.7250 and Aud/Usd relinquishing 0.7800+ status following a fairly downbeat assessment of the Australian Budget from S&P and CBA contending that additional spending will culminate in the country losing its AAA rating.
- CAD – In contrast to its non-US Dollar counterparts and other major peers, the Loonie is on a firmer footing and back over 1.2100 amidst rebounding crude prices and significantly less risk aversion after heavy tech-led global stock market declines. Usd/Cad is currently hovering around 1.2085 and within striking distance of Tuesday’s new multi-year nadir circa 1.2078.
- GBP/EUR/CHF/JPY – The Pound has managed to retain hold of the 1.4100 handle, and is consolidating near 1.4150 following a deluge of forecast-beating UK data, but more so due to the broad Buck fade, though Sterling has regained momentum against the Euro towards 0.8575 after the Eur/Gbp cross tested support/resistance into the psychological 0.8600 level and Eur/Usd waned around 1.2150. Elsewhere, the Franc is unwinding more of its outperformance and has been under 0.9150 vs the Greenback and sub-1.0980 against the Euro, while the Yen has retreated from 108.50+ highs to meander between 108.56-91 extremes.
In commodities, WTI and Brent front month futures experience another choppy European morning amid a distinct lack of fresh macro catalysts in the run-up to US inflation figures and the DoEs. WTI Jun rose to a peak of USD 65.99/bbl from a base of USD 64.98/bbl before trimming those, whilst its Brent counterpart saw similar action between its 68.18-69.26/bbl current intraday band. Prices remain underpinned to an extent by the situation regarding the Colonial Pipeline – with an end-week timeline touted for a reopening – although the US East Coast is expected to receive cargoes in the interim to ease some of the tightness caused by the outage. Meanwhile, the crude complex could also be pricing in some geopolitical premium amid the intensifying shelling in Israel-Gaza, although the conflict remains contained to the region for now with no major oil infrastructure in the vicinity. Moving on, yesterday saw the release of both the OPEC MOMR and EIA STEO followed today by the IEA OMR. the IEA and EIA both cut their 2021 forecasts whilst OPEC maintained their metric – with the former two citing India’s COVID situation as a factor. IEA also maintained their forecast of a strong ramp-up in refining activity in the next four months, with refinery runs expected to peak in August. “While the market looks oversupplied in May, stock draws are set to resume from June, even with global oil supply on the rise…Under the current OPEC+ production scenario, supplies won’t rise fast enough to keep pace with the expected demand recovery.”, the agency said. Finally, yesterday saw the release of the weekly Private Inventories with the headline posting a smaller-than-expected draw whilst the internals were mixed. Today’s EIA headline crude inventories are forecast to draw 2.8mln bbls. Turning to metals, spot gold and silver are biding time within recent ranges ahead of the US CPI and 10yr Auction. Base metals are back on the grind with LME copper holding its head above USD 10,500/t amid the mounting inflation bets and EV demand prospect and EV demand prospect. Eyes are also on BHP’s Chilean copper operations as union leaders are reportedly advising workers against the final offer, which could see strikes. Overnight, Chinese iron ore and steel futures ended the session near record highs, although analysts have been warning about the momentum behind prices, with SinoSteel suggesting the front-month contracts are heavily influenced by the Aussie-Sino spat.
US Event Calendar
- 8:30am: April CPI YoY, est. 3.6%, prior 2.6%; CPI Ex Food and Energy YoY, est. 2.3%, prior 1.6%
- 8:30am: April CPI MoM, est. 0.2%, prior 0.6%; CPI Ex Food and Energy MoM, est. 0.3%, prior 0.3%
- 2pm: April Monthly Budget Statement, est. -$207.8b, prior -$738b
Central Banks:
- 9am: Fed’s Clarida Discusses U.S. Economic Outlook
- 9:05am: Fed’s Rosengren Speaks on Crypto Currency
- 1pm: Fed’s Bostic Speaks to Council on Foreign Relations
- 1:30pm: Fed’s Harker Discusses Higher Education
DB’s Jim Reid concludes the overnight wrap
Inflation fears led to yet another selloff in global markets yesterday and had extended into the Asian session as investors look forward to today’s much-anticipated CPI reading from the US. The jitters took hold across multiple asset classes, and by the close of trade, the S&P 500 had fallen another -0.87%, with the VIX index of volatility up +2.2pts at a 2-month high of 21.8pts. The equity slump was worse early in the US session though with the S&P being down as much as -1.8% in the first couple of hours of trading. However we are testing these lows again as we type in the Asian session. Before this the index had recovered as Fed speakers tried to talk down inflation fears again. It was still an incredibly broad-based decline, with 417 companies in the S&P moving lower on the day, alongside 22 of the 24 level 2 industry groups, including 14 seeing losses over -1.0%. Over in Europe, the catch-up to the US from the previous night meant that the STOXX 600 (-1.97%) had its worst day of the year so far, with a massive 562 of its companies losing ground by the close.
Tech stocks had underperformed dramatically at the start of the session in the US, with the NASDAQ down -2.2% and the FANG+ Index down -2.8% shortly after the open before outperforming by the close with the former closing down ‘only’ -0.09% and the more heavily concentrated FANG+ index gaining +0.45%. Much of the recovery occurred midway through the day as Fed speakers tempered worries by again indicating that they view inflation as “transitory.”
The initial turn higher for tech shares seemed to come as Governor Brainard said policy makers should be patient as the post-pandemic distortions sort themselves out. She added that the economic outlook “is bright, but risks remain, and we are far from our goals.” She also reiterated a point that President Biden made shortly after the jobs report last Friday, saying “with less than one in four individuals ages 18 to 64 fully vaccinated at the end of the survey period for the April jobs report, health and safety concerns remain important for in-person work and for people relying on public transport, and childcare remains a challenge for many parents.” Those numbers have improved markedly since that time and will be something to look at in this month’s report. Fed Governors Bostic and Harker both sung from a similar song sheet later in the New York afternoon, with the hawkish-leaning Governor Harker saying that April is likely an outlier but that it is “premature” to talk about tapering. Fed Governor Bullard later came out saying that the time to look at policy changes would be after the pandemic is over, adding yet another signpost for fed-watchers.
Sovereign bonds shared in the slump yesterday, with European yields reaching fresh highs across the continent. Those on 10yr bunds were up +5.1bps to -0.16%, a level not seen in over a year, whilst German 10yr breakevens rose to 1.44%, their highest since 2014. And in Italy, 10yr BTP yields were up +5.8bps as their own breakevens hit their highest since 2013. For the US however it was a much smaller move, with yields on 10yr Treasuries up just +2.0bps to 1.622%, with breakevens up yet another +0.9bps as real rates rose slightly as well (+1.1bps). It was the fourth straight session of higher yields, which is the longest such stretch since March 19.
Of course, attention today will be on that CPI reading from the US at 13:30, where the current consensus on Bloomberg is pointing to a rise in the year-on-year reading to +3.6%. That would be the highest annual CPI number since September 2011 if realised, and up from 2.6% in March. Since the underwhelming payrolls release on Friday, the market narrative has turned to the question of whether labour supply constraints are the issue, which could prove inflationary moving forward. This was backed up in our flash poll you’d have seen at the top of yesterday’s edition, where 61% of the respondents (700 in total) felt that the number represented labour supply constraints, against just 14% who thought it was due to weak demand for labour and another 18% who put it down to measurement errors that will likely be revised in due course. Further data in the US backed up this theory yesterday, where the number of job openings rose to a record 8.123m in March, while the “jobs hard to fill” index in the latest NFIB small business survey rose to another record once again.
Overnight in Asia, the main news has been Taiwan’s stock market trading down as much as -8.6% (-5.77% as we go to print) at one point due to the tightening of pandemic related restrictions (more below) and the tech rout with semiconductor companies leading the declines. The index seems to be facing the worst drop since stock-price limits were loosened in 2015. Other markets in the region are also trading lower with the Nikkei (-2.03%), Hang Seng (-0.37%), CSI (-0.28%), Shanghai Comp (-0.01%) and Kospi (-2.09%) all down. Meanwhile, Australia’s 10yr yields are up +5.4bps after the government unveiled a big-spending budget to spur the country’s rebounding economy. The Australian debt office said overnight that it now expects Treasury bond issuance to be about AUD 130bn for the fiscal year ending June 2022, defying some expectations that it would decline to as little as AUD 110bn. This is also weighing on the Australian dollar (-0.65%) this morning with the strength of the greenback (+0.28%) also a factor. Outside of Asia, futures on the S&P 500 (-0.83%) are notably lower as mentioned earlier.
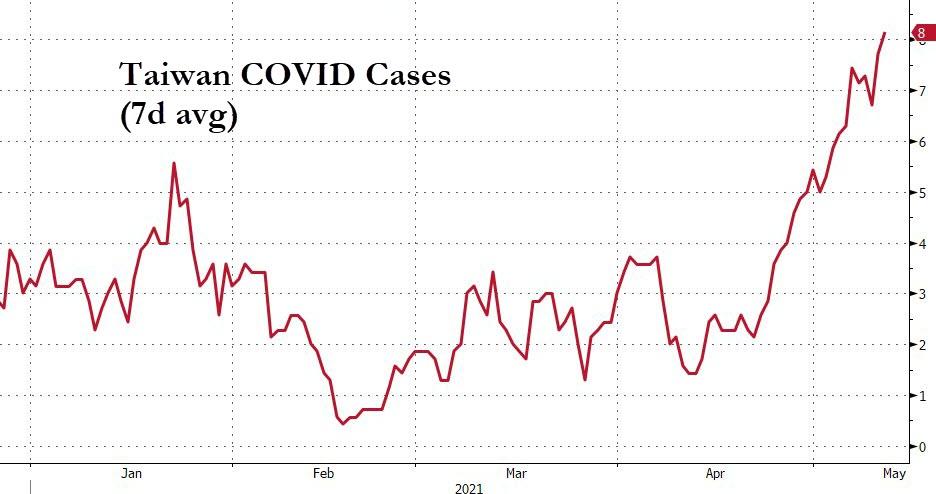
On the pandemic, the news at the global level has continued to get marginally better, with the rise in cases continuing to fall from its peak two weeks ago, albeit remaining at very elevated levels still. In Taiwan, which has been very successful at keeping the virus contained, fresh restrictions were imposed as 7 new local cases were reported yesterday. This will see a ban on indoor gatherings of more than 100 people and outdoor gatherings of more than 500, with the restrictions in place until June 8. Overnight, the Liberty Times has reported that Taiwan may elevate its alert level further today with the government likely to ban indoor gatherings of over five people and outdoor gatherings of more than 10 people, and it may request non-essential businesses to close their doors. So a rapid escalation of restrictions potentially.
Meanwhile in the UK, Prime Minister Johnson said that a public inquiry would be set up to look at the pandemic in this session of parliament, and it was confirmed that restrictions in Scotland would be eased further from Monday. There is also going to be an easing of restrictions in the Netherlands with gyms, zoos and parks reopening on May 19 if infection numbers continue to improve. Germany announced good news as well with one-third of the country having received at least one shot and the lowest virus incidence rate in over a month at 115 cases per 100k people.
There wasn’t a great deal of other data out yesterday, though the German ZEW survey outperformed expectations, with the expectations measure up to 84.4 (vs. 72.0 expected), its highest level since 2000, while the current situation reading also rose to -40.1 (vs. -41.6 expected). Meanwhile in Italy, industrial production was down -0.1% in March (vs. +0.4% expected).
To the day ahead now, and the highlight will be the aforementioned April CPI reading from the US. Otherwise, data releases include the US monthly budget statement for April, the UK’s Q1 GDP, and the Euro Area’s March industrial production. Central bank speakers include BoE Governor Bailey, the Fed’s Clarida, Bostic and Harker, and the ECB’s Centeno. Otherwise, President Biden will be meeting with Congressional leaders from both parties, while the European Commission will be releasing their latest economic forecasts.