10/9/1954: Justice Robert H. Jackson dies.

from Latest – Reason.com https://ift.tt/2M0X8Cn
via IFTTT
another site
10/9/1954: Justice Robert H. Jackson dies.
from Latest – Reason.com https://ift.tt/2M0X8Cn
via IFTTT
Futures Soar As China Offers To Buy Another $10 Billion Of US Goods
Indeed, the last hour of watching E-mini S&P500 futures has been a wild ride. There have been two spikes in futures, one at 5:10 am est. or so, when a headline hit detailing how Beijing “may be open” to a “partial” US trade deal.
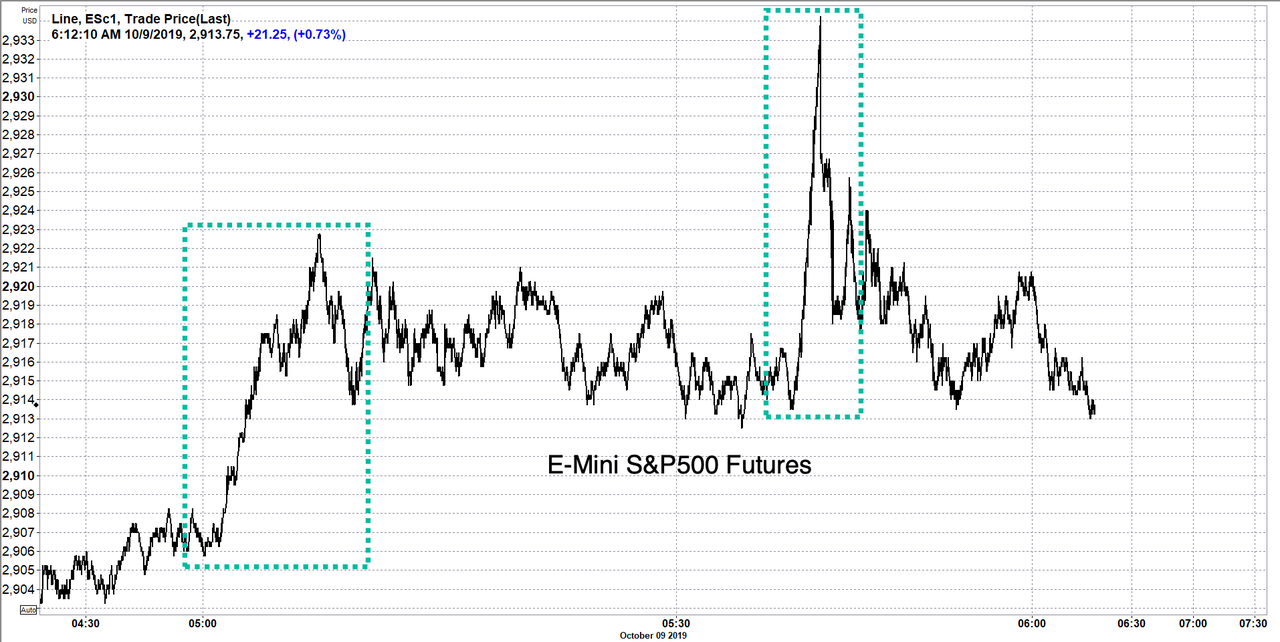
Then, the next spike, at 5:47 am est. was a 20 point, 71bps pop in 35 seconds, algos went into panic buying after the Financial Times reported Chinese officials offered “to increase annual purchases of US agricultural products by $10bn a year.”

China’s lead trade negotiator, Vice Premier Liu He, will meet with US Trade Representative Robert Lighthizer and Treasury Secretary Steven Mnuchin on Thursday to hash out a possible lite trade deal, and if all goes well, a potential meeting with President Trump could be seen on Friday.
“Liu He is coming with real offers, it’s not an empty visit,” said one of the people briefed on the talks. “The Chinese are ready to de-escalate.”
And all of these headlines are occurring as E-Mini S&P500 futures struggle to stay above the daily 200ema.

Tyler Durden
Wed, 10/09/2019 – 06:18
via ZeroHedge News https://ift.tt/2IAl1OK Tyler Durden
Watch Turkish Troops & Tanks Travel Into Syria As US Backs Away
Just like the Kurds warned, Turkish troops have started crossing into northeastern Syria as the country begins a military offensive that President Erdogan has insisted is vital for Turkey’s security. As of early Wednesday morning in New York, a small group of Turkish forces had already entered the country, and reinforcements of troops and artillery were preparing to take up positions, Bloomberg reports.

One video that has been circulating on Twitter showed Turkish troops crossing the border, as journalists warned that “a new phase of this bloody regional war could be about to begin.”
🎥 The latest from the #Turkey / #Syria border as Turkish troops and artillery take up positions. Despite international calls for Turkey to hold back, a new phase of this bloody regional war could be about to begin. @SkyNews pic.twitter.com/w9kf6JDdC2
— Mark Stone (@Stone_SkyNews) October 8, 2019
Even BBG is reporting that the goal of the Turkish operation is to “force back Kurdish militants controlling the border area.” Turkish troops entered Syria at two points along the border near the Syrian towns of Tal Abyad and Ras al-Ayn.
Bloomberg said there was “no immediate comment from Kurdish-led forces” though it noted that the YPG had earlier vowed to defend themselves against any Turkish attack.
Turkish markets were treading water on Wednesday after President Trump insisted that the US wouldn’t stand in Turkey’s way, but that Ankara had promised him that Washington’s allies in the area – i.e. the Kurds – would be safe, with Trump threatening to “obliterate” the Turkish economy if Turkish forces attack the wrong people.
In what has been described as a “dramatic” reversal in US foreign policy, Trump signaled earlier in the week that the US would turn over thousands of ISIS members to Turkey (after their home countries overwhelmingly refused to take them back), and allow the Turkish military to cross into northeastern Syria as the US pulls out. However, Trump’s move is in line with his insistence that other NATO members shoulder more of the responsibility for their defense. Turkey is a NATO member.
Turkish Defense Minister Hulusi Akar told state-run TRT TV that “deployments and work is still underway regarding the operation,” indicating that more Turkish forces will move across the border.
If they want to prevent a resurgence of ISIS, they better hurry up. YPG forces have warned about mass jailbreaks of ISIS prisoners during a Turkish invasion.
Turkey wants to eliminate the YPG because of its ties to the separatist PKK, a Kurdish party inside Turkey that has been battling against Ankara for decades to try and achieve sovereignty for the country’s Kurds. Ironically, though it was Washington’s closest ally on the ground in Syria, the YPG is considered a terrorist organization.
In a statement, Turkey’s chief of communications warned that Kurds have two options: “They can defect, or we will stop them from disrupting our counter-ISIS efforts.”
We imagine the Kurds will find that very convincing.
As for where Turkey goes from here, one journalist has a breakdown:
How will Turkey conduct the operation in Syria?
• First phase: 120km area between Tal Abyad/Rasulayn, where US troops withdrew
• Airforce, drones/jets and howitzers will pound YPG targets
• Then Turkish Special Forces and Syrian National Army will enter— Turkish reports pic.twitter.com/KhLqKZEEby
— Ragıp Soylu (@ragipsoylu) October 8, 2019
Tyler Durden
Wed, 10/09/2019 – 06:03
via ZeroHedge News https://ift.tt/2AVYDeH Tyler Durden
Environmental scientist Jesse Ausubel remembers the moment his research trajectory changed. Over dinner one night in 1987, his friend and colleague Robert Herman, a physicist with a wide range of interests, wondered aloud, “Are buildings getting lighter?” That apparently simple question inspired the pair to begin looking into the “material intensity” of the modern world.
In 2015, Ausubel published an essay titled “The Return of Nature: How Technology Liberates the Environment.” He had found substantial evidence not only that Americans were consuming fewer resources per capita but also that they were consuming less in total of some of the most important building blocks of an economy: things such as steel, copper, fertilizer, timber, and paper. Total annual U.S. consumption of all of these had been increasing rapidly prior to 1970. But since then, consumption had reached a peak and then declined.
This was unexpected, to put it mildly. “The reversal in use of some of the materials so surprised me that [a few colleagues] and I undertook a detailed study of the use of 100 commodities in the United States from 1900 to 2010,” Ausubel wrote. “We found that 36 have peaked in absolute use…Another 53 commodities have peaked relative to the size of the economy, though not yet absolutely. Most of them now seem poised to fall.”
A few years earlier, a writer and researcher named Chris Goodall had noticed something similar in the United Kingdom’s Material Flow Accounts, “a set of dry and largely ignored data published annually by the Office for National Statistics,” as the Guardian put it. He summarized his findings in a 2011 paper titled “‘Peak Stuff ‘: Did the UK Reach a Maximum Use of Material Resources in the Early Part of the Last Decade?”
Goodall’s answer to his own question was, essentially, yes: “Evidence presented in this paper supports a hypothesis that the United Kingdom began to reduce its consumption of physical resources in the early years of the last decade, well before the economic slowdown that started in 2008. This conclusion applies to a wide variety of different physical goods, for example water, building materials and paper and includes the impact of items imported from overseas. Both the weight of goods entering the economy and the amounts finally ending up as waste probably began to fall from sometime between 2001 and 2003.”
Goodall was eloquent about the significance of dematerialization: “If correct, this finding is important. It suggests that economic growth in a mature economy does not necessarily increase the pressure on the world’s reserves of natural resources and on its physical environment. An advanced country may be able to decouple economic growth and increasing volumes of material goods consumed. A sustainable economy does not necessarily have to be a no-growth economy.”
I agreed with Goodall about the significance of economy-wide dematerialization, especially because the United Kingdom and the United States were the leading economies of the Industrial Era—a period that was defined by an unprecedented and extraordinary rise in the use of natural resources and other exploitations of the environment. If those two countries could reverse course and achieve substantial dematerialization, it would be a fascinating and hopeful development.
It would also be surprising, because it would mean that something fundamental about the mainstream understanding of how growth works would be incorrect. Most of us carry around an implicit or explicit belief that because humans always want to consume more, we will use more resources year after year to satisfy these wants. Technologies that allow us to make more efficient use of resources will not let us conserve resources, because we’ll just use the technologies to let us consume even more—so much more that overall resource use will continue to rise.
This was the clear pattern until 1970. What could possibly have caused it to change? Moreover, if absolute dematerialization was a real and durable phenomenon, were there any interventions that individuals, communities, and governments could make that would help accelerate and spread it?
The Great Reversal
Fortunately for anyone interested in dematerialization, a lot of high-quality evidence exists about resource consumption over time in America. Much of it comes from the U.S. Geological Survey (USGS), a federal agency formed in 1879 and tasked by Congress with “classification of the public lands, and examination of the geological structure, mineral resources, and products of the national domain.”
That examination of mineral resources is a boon to anyone interested in dematerialization, because since the start of the 20th century, the USGS has been collecting data on the use of the most economically important minerals in America. Of particular interest is the survey’s yearly estimate of “apparent consumption” of each mineral.
This consumption takes into account not only domestic production of the resource but also imports and exports. For example, to calculate America’s total apparent consumption of copper in 2015, the USGS would take the amount of copper produced in the country that year, add total imports of copper, and subtract total copper exports.
The survey’s data tell a fascinating story. To understand it, let’s start with metals, one of the most obviously important materials for any economy. Here’s total annual consumption from 1900 to 2015 of the five most important metals in the United States. A reminder: This is not annual consumption per American. This is annual consumption by all Americans—the total tonnage used year by year of these metals.
All of these metals are “post-peak” in America, meaning that the country hit its maximum consumption of each of them some years ago and has seen generally declining in use since then. The magnitude of the dematerialization is large. In 2015 (the most recent year for which USGS data are available), total American use of steel was down more than 15 percent from its high point in 2000. Aluminum consumption was down more than 32 percent and copper 40 percent from their peaks.
This dematerialization becomes even more impressive when consumption of resources in the United States is compared to the country’s economic growth. Note that a huge decoupling has taken place. Up to 1970, consumption of metals in America grew just about in lockstep with the overall economy. In the years since 1970, the economy has continued to grow pretty steadily, but consumption of metals has reversed course and is now decreasing. We’re now getting more “economy” from less metal year after year. We’ll see a similar great reversal in the use of many other resources.
America is an agricultural powerhouse—the world’s largest producer of both soybeans and corn and fourth-largest producer of wheat. Fertilizer is, as we’ve seen, essential for growing crops. So here’s the country’s total consumption over time of fertilizer, water, and cropland. Instead of GDP, this graph charts total U.S. crop tonnage.
Here again, output (crop tonnage) used to be tightly linked to inputs (water and fertilizer). But then that relationship changed, and we’re now getting more from less. Fertilizer use is down almost 25 percent from its 1999 peak, and by 2014 total water used for irrigation had decreased by more than 22 percent from its maximum in 1984. Total cropland has also fallen, to levels rivaling the lowest points of the previous century.
Building structures and infrastructure requires a lot of resources, so let’s look at total consumption, according to the USGS, of the most important building materials. Let’s also include data on timber use from the U.S. Department of Agriculture and throw in paper for good measure.
Here I see two different stories. The first is about building materials—cement, sand and gravel, and stone. Consumption of all of these peaked in 2007 and has dropped sharply since. But the sharp drop-off is surely because of the Great Recession, which hit the construction industries particularly hard. As construction recovers, we may find that we are not post-peak in these materials. But I predict that we’re forever post-peak in our use of both wood and paper. Total timber use is down by a third and paper by almost 20 percent since their high points.
Are these graphs representative of what’s been going on in the American economy as a whole? They are. Of the 72 resources tracked by the USGS, from aluminum and antimony through vermiculite and zinc, only six are not yet post-peak. Of these, we spend by far the most on gemstones. We Americans apparently have a bottomless thirst for bling. If shiny ornamental stones are excluded from the analysis, then more than 90 percent of total 2015 resource spending in America was on post-peak materials.
American consumption of plastics, which is not tracked by the USGS, is an exception to the overall trend of dematerialization. Outside of recessions, the United States continues to use more plastic year after year in the form of trash bags, water bottles, food packaging, toys, outdoor furniture, and countless other products. But in recent years, there has been an important slowdown.
According to the Plastics Industry Trade Association, between 1970 and the start of the Great Recession in 2007, American plastic use grew at a rate of about 5.2 percent per year. This was more than 60 percent faster than the country’s GDP grew over the same period. But a very different pattern has emerged in the years since the recession ended. The growth in plastic consumption has slowed down greatly, to less than 2 percent per year between 2009 and 2015. This is almost 14 percent slower than GDP growth over the same period. So while America is not yet post-peak in its use of plastic, it’s quickly closing in on this milestone.
Finally, let’s look at total energy consumption combined with greenhouse gas emissions, which are the most harmful side effect of generating energy from fossil fuels.
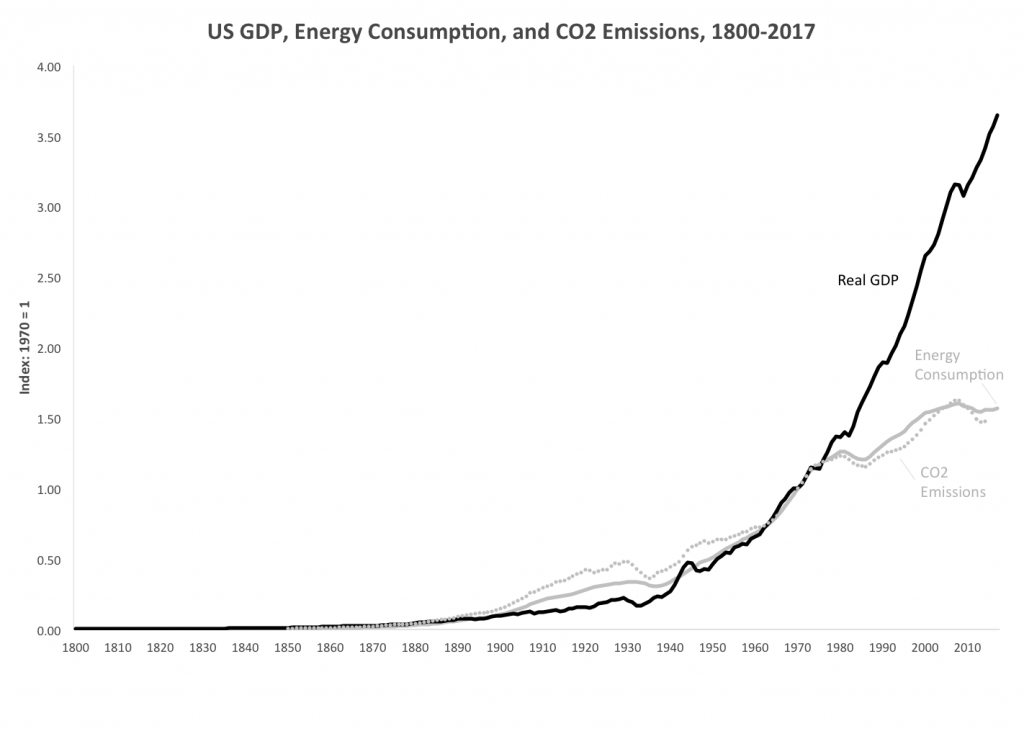
I was surprised to learn that total American energy use in 2017 was down almost 2 percent from its 2008 peak, especially since our economy grew by more than 15 percent between those two years. I had walked around with the unexamined assumption that growing economies must consume more energy year after year. This turns out not to be the case anymore—a profound change. Energy use went up in lockstep with economic growth in America for more than a century and a half, from 1800 to 1970. Then the increase in energy use slowed down, and then it turned negative—even as the economy kept growing. Over the last decade, we’ve gotten more economic output from less energy.
Greenhouse gas emissions have gone down even more quickly than has total energy use. This is largely because we have in recent years been using less coal to generate electricity and more natural gas, which produces 50–60 percent less carbon per kilowatt-hour.
The conclusion from this set of graphs is clear: A great reversal of our Industrial Age habits is taking place. The American economy is now experiencing broad and often deep absolute dematerialization.
Is the rest of the world dematerializing? It’s a hard question to answer definitively because there’s no equivalent of the detailed and comprehensive USGS data for countries other than America. There is evidence, though, that other advanced industrialized nations are also now getting more from less. Goodall, of course, found that the United Kingdom is now past “peak stuff.” And Eurostat data show that countries including Germany, France, and Italy have generally seen flat or declining total consumption of metals, chemicals, and fertilizer in recent years.
Developing countries, especially fast-growing ones such as India and China, are probably not yet dematerializing. But I predict that they will start getting more from less of at least some resources in the not-too-distant future.
from Latest – Reason.com https://ift.tt/2VwJQk3
via IFTTT
Environmental scientist Jesse Ausubel remembers the moment his research trajectory changed. Over dinner one night in 1987, his friend and colleague Robert Herman, a physicist with a wide range of interests, wondered aloud, “Are buildings getting lighter?” That apparently simple question inspired the pair to begin looking into the “material intensity” of the modern world.
In 2015, Ausubel published an essay titled “The Return of Nature: How Technology Liberates the Environment.” He had found substantial evidence not only that Americans were consuming fewer resources per capita but also that they were consuming less in total of some of the most important building blocks of an economy: things such as steel, copper, fertilizer, timber, and paper. Total annual U.S. consumption of all of these had been increasing rapidly prior to 1970. But since then, consumption had reached a peak and then declined.
This was unexpected, to put it mildly. “The reversal in use of some of the materials so surprised me that [a few colleagues] and I undertook a detailed study of the use of 100 commodities in the United States from 1900 to 2010,” Ausubel wrote. “We found that 36 have peaked in absolute use…Another 53 commodities have peaked relative to the size of the economy, though not yet absolutely. Most of them now seem poised to fall.”
A few years earlier, a writer and researcher named Chris Goodall had noticed something similar in the United Kingdom’s Material Flow Accounts, “a set of dry and largely ignored data published annually by the Office for National Statistics,” as the Guardian put it. He summarized his findings in a 2011 paper titled “‘Peak Stuff ‘: Did the UK Reach a Maximum Use of Material Resources in the Early Part of the Last Decade?”
Goodall’s answer to his own question was, essentially, yes: “Evidence presented in this paper supports a hypothesis that the United Kingdom began to reduce its consumption of physical resources in the early years of the last decade, well before the economic slowdown that started in 2008. This conclusion applies to a wide variety of different physical goods, for example water, building materials and paper and includes the impact of items imported from overseas. Both the weight of goods entering the economy and the amounts finally ending up as waste probably began to fall from sometime between 2001 and 2003.”
Goodall was eloquent about the significance of dematerialization: “If correct, this finding is important. It suggests that economic growth in a mature economy does not necessarily increase the pressure on the world’s reserves of natural resources and on its physical environment. An advanced country may be able to decouple economic growth and increasing volumes of material goods consumed. A sustainable economy does not necessarily have to be a no-growth economy.”
I agreed with Goodall about the significance of economy-wide dematerialization, especially because the United Kingdom and the United States were the leading economies of the Industrial Era—a period that was defined by an unprecedented and extraordinary rise in the use of natural resources and other exploitations of the environment. If those two countries could reverse course and achieve substantial dematerialization, it would be a fascinating and hopeful development.
It would also be surprising, because it would mean that something fundamental about the mainstream understanding of how growth works would be incorrect. Most of us carry around an implicit or explicit belief that because humans always want to consume more, we will use more resources year after year to satisfy these wants. Technologies that allow us to make more efficient use of resources will not let us conserve resources, because we’ll just use the technologies to let us consume even more—so much more that overall resource use will continue to rise.
This was the clear pattern until 1970. What could possibly have caused it to change? Moreover, if absolute dematerialization was a real and durable phenomenon, were there any interventions that individuals, communities, and governments could make that would help accelerate and spread it?
The Great Reversal
Fortunately for anyone interested in dematerialization, a lot of high-quality evidence exists about resource consumption over time in America. Much of it comes from the U.S. Geological Survey (USGS), a federal agency formed in 1879 and tasked by Congress with “classification of the public lands, and examination of the geological structure, mineral resources, and products of the national domain.”
That examination of mineral resources is a boon to anyone interested in dematerialization, because since the start of the 20th century, the USGS has been collecting data on the use of the most economically important minerals in America. Of particular interest is the survey’s yearly estimate of “apparent consumption” of each mineral.
This consumption takes into account not only domestic production of the resource but also imports and exports. For example, to calculate America’s total apparent consumption of copper in 2015, the USGS would take the amount of copper produced in the country that year, add total imports of copper, and subtract total copper exports.
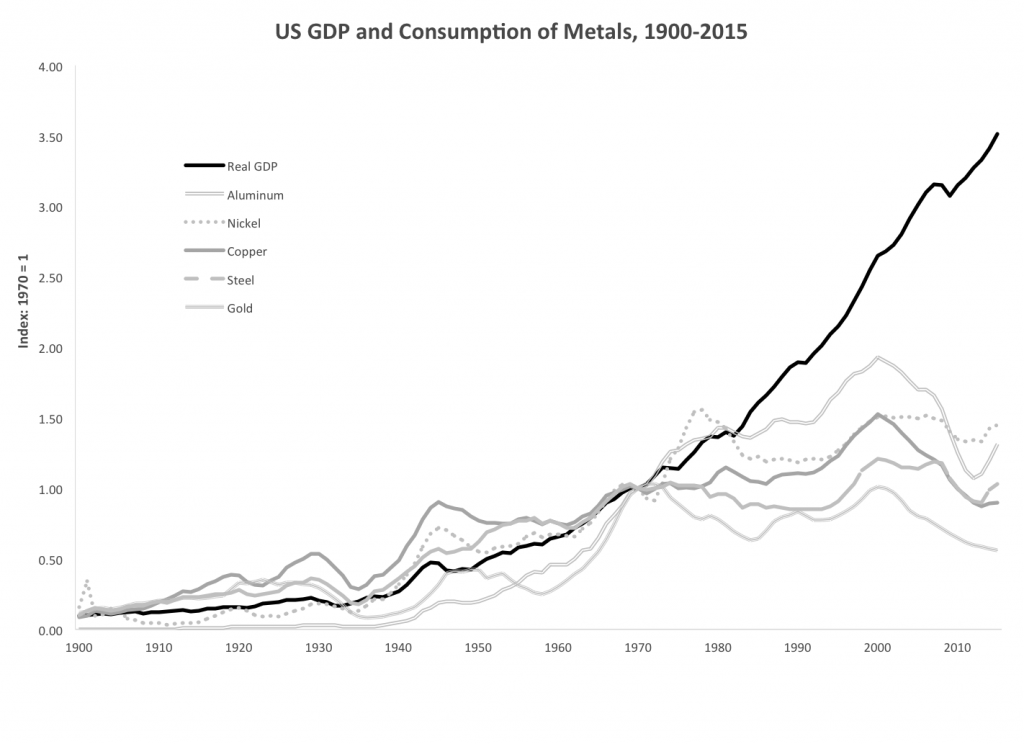
The survey’s data tell a fascinating story. To understand it, let’s start with metals, one of the most obviously important materials for any economy. Here’s total annual consumption from 1900 to 2015 of the five most important metals in the United States. A reminder: This is not annual consumption per American. This is annual consumption by all Americans—the total tonnage used year by year of these metals.
All of these metals are “post-peak” in America, meaning that the country hit its maximum consumption of each of them some years ago and has seen generally declining in use since then. The magnitude of the dematerialization is large. In 2015 (the most recent year for which USGS data are available), total American use of steel was down more than 15 percent from its high point in 2000. Aluminum consumption was down more than 32 percent and copper 40 percent from their peaks.
This dematerialization becomes even more impressive when consumption of resources in the United States is compared to the country’s economic growth. Note that a huge decoupling has taken place. Up to 1970, consumption of metals in America grew just about in lockstep with the overall economy. In the years since 1970, the economy has continued to grow pretty steadily, but consumption of metals has reversed course and is now decreasing. We’re now getting more “economy” from less metal year after year. We’ll see a similar great reversal in the use of many other resources.
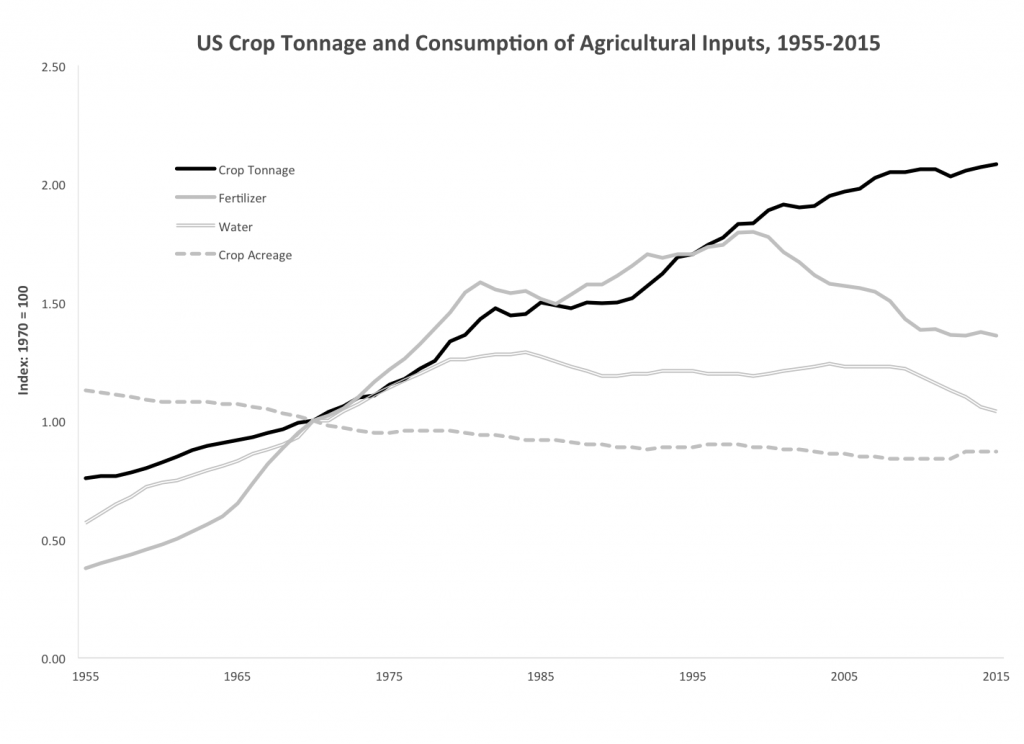
America is an agricultural powerhouse—the world’s largest producer of both soybeans and corn and fourth-largest producer of wheat. Fertilizer is, as we’ve seen, essential for growing crops. So here’s the country’s total consumption over time of fertilizer, water, and cropland. Instead of GDP, this graph charts total U.S. crop tonnage.
Here again, output (crop tonnage) used to be tightly linked to inputs (water and fertilizer). But then that relationship changed, and we’re now getting more from less. Fertilizer use is down almost 25 percent from its 1999 peak, and by 2014 total water used for irrigation had decreased by more than 22 percent from its maximum in 1984. Total cropland has also fallen, to levels rivaling the lowest points of the previous century.
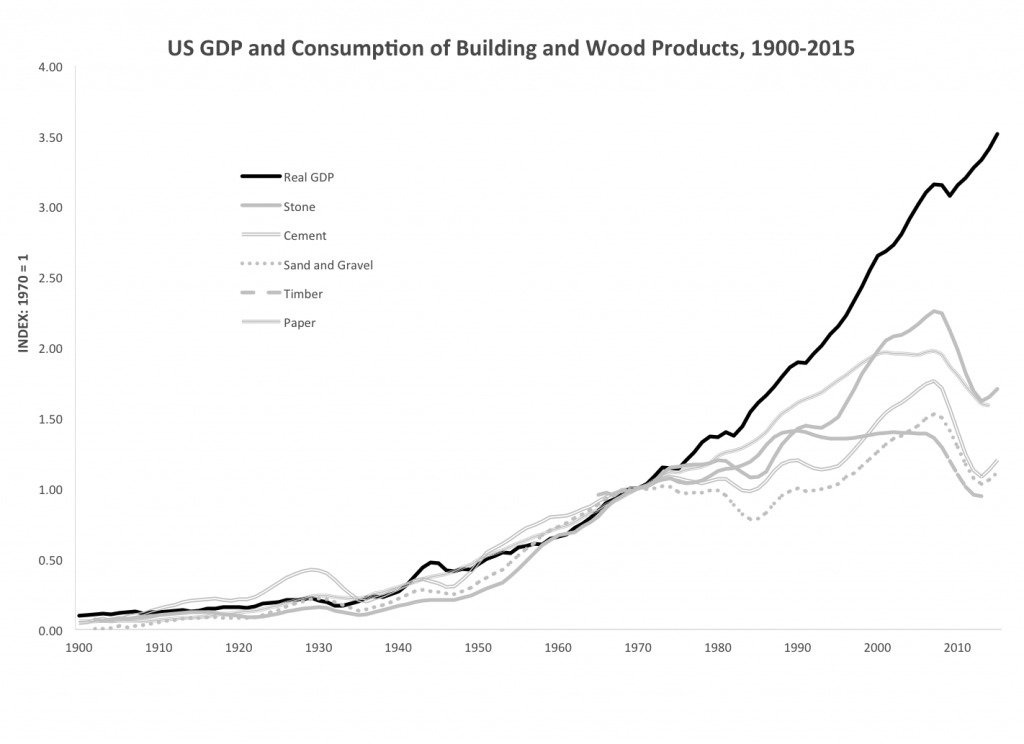
Building structures and infrastructure requires a lot of resources, so let’s look at total consumption, according to the USGS, of the most important building materials. Let’s also include data on timber use from the U.S. Department of Agriculture and throw in paper for good measure.
Here I see two different stories. The first is about building materials—cement, sand and gravel, and stone. Consumption of all of these peaked in 2007 and has dropped sharply since. But the sharp drop-off is surely because of the Great Recession, which hit the construction industries particularly hard. As construction recovers, we may find that we are not post-peak in these materials. But I predict that we’re forever post-peak in our use of both wood and paper. Total timber use is down by a third and paper by almost 20 percent since their high points.
Are these graphs representative of what’s been going on in the American economy as a whole? They are. Of the 72 resources tracked by the USGS, from aluminum and antimony through vermiculite and zinc, only six are not yet post-peak. Of these, we spend by far the most on gemstones. We Americans apparently have a bottomless thirst for bling. If shiny ornamental stones are excluded from the analysis, then more than 90 percent of total 2015 resource spending in America was on post-peak materials.
American consumption of plastics, which is not tracked by the USGS, is an exception to the overall trend of dematerialization. Outside of recessions, the United States continues to use more plastic year after year in the form of trash bags, water bottles, food packaging, toys, outdoor furniture, and countless other products. But in recent years, there has been an important slowdown.
According to the Plastics Industry Trade Association, between 1970 and the start of the Great Recession in 2007, American plastic use grew at a rate of about 5.2 percent per year. This was more than 60 percent faster than the country’s GDP grew over the same period. But a very different pattern has emerged in the years since the recession ended. The growth in plastic consumption has slowed down greatly, to less than 2 percent per year between 2009 and 2015. This is almost 14 percent slower than GDP growth over the same period. So while America is not yet post-peak in its use of plastic, it’s quickly closing in on this milestone.
Finally, let’s look at total energy consumption combined with greenhouse gas emissions, which are the most harmful side effect of generating energy from fossil fuels.
I was surprised to learn that total American energy use in 2017 was down almost 2 percent from its 2008 peak, especially since our economy grew by more than 15 percent between those two years. I had walked around with the unexamined assumption that growing economies must consume more energy year after year. This turns out not to be the case anymore—a profound change. Energy use went up in lockstep with economic growth in America for more than a century and a half, from 1800 to 1970. Then the increase in energy use slowed down, and then it turned negative—even as the economy kept growing. Over the last decade, we’ve gotten more economic output from less energy.
Greenhouse gas emissions have gone down even more quickly than has total energy use. This is largely because we have in recent years been using less coal to generate electricity and more natural gas, which produces 50–60 percent less carbon per kilowatt-hour.
The conclusion from this set of graphs is clear: A great reversal of our Industrial Age habits is taking place. The American economy is now experiencing broad and often deep absolute dematerialization.
Is the rest of the world dematerializing? It’s a hard question to answer definitively because there’s no equivalent of the detailed and comprehensive USGS data for countries other than America. There is evidence, though, that other advanced industrialized nations are also now getting more from less. Goodall, of course, found that the United Kingdom is now past “peak stuff.” And Eurostat data show that countries including Germany, France, and Italy have generally seen flat or declining total consumption of metals, chemicals, and fertilizer in recent years.
Developing countries, especially fast-growing ones such as India and China, are probably not yet dematerializing. But I predict that they will start getting more from less of at least some resources in the not-too-distant future.
from Latest – Reason.com https://ift.tt/2VwJQk3
via IFTTT
Stocks Rally As Beijing “May Be Open” To “Partial” Trade Deal
With algos showing they’re still firmly in control of the market, another optimistic trade headline has managed to drive Dow futures more than 100 points higher.
The report this time is that Beijing “may be open” to a “partial” US trade deal despite Washington’s decision to add several Chinese tech firms to the Commerce Department’s ‘blacklist’. Yesterday, Beijing warned that investors should “stay tuned” for its “retaliation’ against the blacklisting. So, at a time when the market was bracing for more aggressive rhetoric, Beijing has instead surprised us with another vaguely bullish trade headline, to which the market has once again enthusiastically glommed on.
S&P futures were up more than 25 points.

It wasn’t just the US, of course. Global markets rallied on the first sign in days that negotiations haven’t already been undermined by Washington’s latest tactics.

Over the past couple of weeks, algos have proven incredibly sensitive to trade headlines. And after so much aggression out of Washington, any sign that Beijing might look past tensions over Hong Kong, Taiwan and the NBA, as well as the tech blacklistings, would inevitably drive markets higher – even though President Trump and some of his top economic advisors have insisted that he wants a “grand” trade deal, and won’t accept a “partial” agreement.
Tyler Durden
Wed, 10/09/2019 – 05:37
via ZeroHedge News https://ift.tt/2p7WytC Tyler Durden
Sweden: One In Four Women Are Afraid To Leave Their Homes
Authored by Paul Joseph Watson via Summit News,
According to a new survey, almost a quarter of Swedish women are afraid to leave their homes over fears they will be attacked or sexually assaulted.

“15.3 percent of people aged 16 or older stated that they did not want to go out in the evening out of concern about being assaulted or threatened. Among women, the proportion was almost 25 percent,” reports Statistics Sweden.
As we reported back in August, sales of pepper spray in some areas of Sweden have surged as much as 90 per cent amidst concerns over the country’s rape problem.
After a string of four sexual assaults and rapes in the span of five nights, Swedish police in numerous cities advised women to not walk alone at night and to go home early.
Figures released last year found that 58 per cent of convicted rapists and 85 per cent of all convicted assault rapists in Sweden were born outside of Europe.
In cases where the victim did not know the attacker, the proportion of foreign offenders was more than 80 per cent. Nearly 40 per cent of the convicted rapists are from the Middle East or from Africa, areas of the world from which Sweden has accepted large numbers of migrants in recent years.
A study by the Swedish newspaper Aftonbladet found that 88 per cent of gang rapists in the Scandinavian country over the last six years have had a migrant background.
Other figures show that migrants from Muslim-majority nations commit 84 per cent of “very violent” rapes in Sweden.
* * *
My voice is being silenced by free speech-hating Silicon Valley behemoths who want me disappeared forever. It is CRUCIAL that you support me. Please sign up for the free newsletter here. Donate to me on SubscribeStar here. Support my sponsor – Turbo Force – a supercharged boost of clean energy without the comedown.
Tyler Durden
Wed, 10/09/2019 – 05:00
via ZeroHedge News https://ift.tt/2Vv7tcW Tyler Durden
Turkey Joins Russia’s Ruble-Based Alternative To SWIFT
After repeated warnings over the past couple of years, Turkey and Russia have signed a pact to increase use of the ruble and lira in cross-border payments, with Turkey signing on to Russia’s alternative to SWIFT, the international telecommunications protocol used by banks and central banks the world over.
Though SWIFT is an international cooperative owned by its members, with more than 10,000 banks worldwide relying on its system for handling sizable inter-bank transactions, the safety of the network was brought into question after a series of cyberattacks in 2015 and 2016 resulted in the theft of $101 million from the Central Bank of Bangladesh.
For the first time since SWIFT’s laucnh, the hacks stoked doubts about the system’s safety, and prompted many US rivals, including Russia, to ramp up work on their alternatives to SWIFT.

Erdogan and Putin
In addition to Turkey, China and Russia have signed agreements to bolster trade between the two countries, including settling a larger percentage of their bilateral trade in rubles and renminbi. For China, bilateral trade with Russia grew from $69.6 billion in 2016 to $107.1 billion last year. China is Russia’s biggest partner for imports and exports.
There has also been talk about India joining Russia’s SWIFT alternative as Washington continues to threaten New Delhi with sanctions over its decision to purchase Russian-made missile-defense systems.
According to Reuters, Russian Finance Minister Anton Siluanov signed the agreement with Ankara on Tuesday. The agreement, signed on Oct. 4, will encourage the two countries to start using Russia’s system in mutual settlements.
The agreement envisions Turkish banks and companies becoming connected to the Russian version of the SWIFT payment system, while enhancing the infrastructure in Turkey to allow Russian MIR cards, designed by Moscow as alternative to MasterCard and VISA, to work.
Though President Trump on Tuesday reiterated his love and respect for Turkish President Recep Tayyip Erdogan, it’s worth remembering President Putin’s warning about the potential ramifications of American sanctions, which risk undermining the dollar’s dominance of the global financial system by driving more countries to use alternatives to SWIFT.
For example, President Trump’s sanctions against Iran prompted Washington’s European Union allies to try and launch their own SWIFT alternative to make payments to Iran.
As Putin warned, American sanctions against Russia are a “colossal strategic mistake” and eventually risk undermining the dollar-based hegemony of the global financial system.
Tyler Durden
Wed, 10/09/2019 – 04:15
via ZeroHedge News https://ift.tt/2IzKGr2 Tyler Durden
Michigan state Rep. Sherry Gay-Dagnogo wants to know who tore down a house she owns in Detroit. “It’s a hole in the ground,” she said. “It’s clean. It was a professional company. It has an orange barricade around the big hole in the ground.” City officials say they didn’t tear the house down, and they didn’t issue a permit to any private party to tear it down. The house next door was torn down months ago by the Adamo Group, one of the largest contractors in the city’s demolition program. Adamo Group has torn down the wrong house at least once before. The company says it did not tear down Gay-Dagnogo’s house, but city officials say that is under investigation. Adamo Group has torn down 3,397 houses for the city, earning more than $56 million for that work, according the Detroit Free Press.
from Latest – Reason.com https://ift.tt/2LXw5YA
via IFTTT